| Param | Original file | Final file |
|---|---|---|
| Filename | modeM0/AS1A04_149T01_9000002082_14122cztM0_level2.evt | modeM0/AS1A04_149T01_9000002082_14122cztM0_level2_quad_clean.evt |
| Size (bytes) | 487,411,200 | 91,609,920 |
| Size | 464.8 MB | 87.4 MB |
| Events in quadrant A | 3,030,518 | 597,256 |
| Events in quadrant B | 4,828,151 | 588,020 |
| Events in quadrant C | 3,103,146 | 591,966 |
| Events in quadrant D | 3,389,159 | 575,036 |
| Mode SS | |||
|---|---|---|---|
| Quadrant | BADHDUFLAG | Total packets | Discarded packets |
| A | 0 | 122 | 0 |
| B | 0 | 122 | 0 |
| C | 0 | 122 | 0 |
| D | 0 | 122 | 0 |
| Mode M0 | |||
|---|---|---|---|
| Quadrant | BADHDUFLAG | Total packets | Discarded packets |
| A | 0 | 12865 | 2 |
| B | 0 | 18283 | 1 |
| C | 0 | 12847 | 1 |
| D | 0 | 13977 | 1 |
| Mode M9 | |||
|---|---|---|---|
| Quadrant | BADHDUFLAG | Total packets | Discarded packets |
| A | 0 | 10 | 0 |
| B | 0 | 10 | 0 |
| C | 0 | 10 | 0 |
| D | 0 | 10 | 0 |
| Quadrant | Total seconds | Saturated seconds | Saturation percentage |
|---|---|---|---|
| A | 6045 | 85 | 1.406121% |
| B | 6045 | 805 | 13.316791% |
| C | 6045 | 68 | 1.124897% |
| D | 6045 | 84 | 1.389578% |
Noise dominated data is calculated using 1-second bins in cleaned event files. If a bin has >2000 counts, and if more than 50% of those come from <1% of pixels, then it is considered to be noise-dominated and hence unusable.
| Quadrant | # 1 sec bins | Bins with >0 counts | Bins with >2000 counts | High rate bins dominated by noise | Noise dominated (total time) | Noise dominated (detector-on time) | Marked lightcurve |
|---|---|---|---|---|---|---|---|
| A | 7026 | 6046 | 9 | 9 | 0.13% | 0.15% | 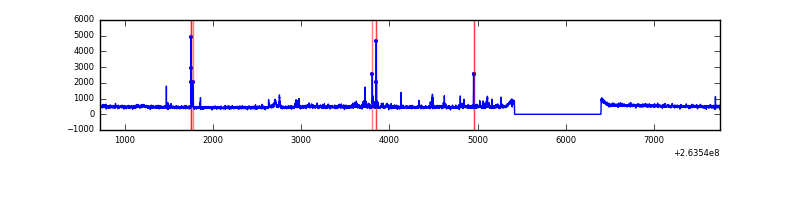 |
| B | 7026 | 6047 | 459 | 459 | 6.53% | 7.59% | 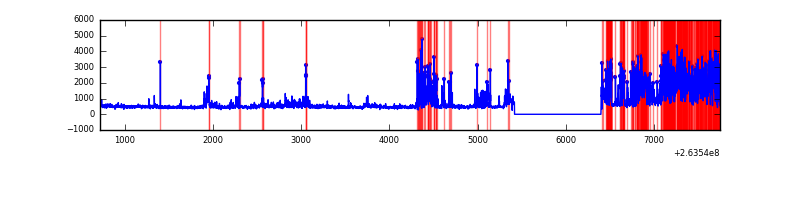 |
| C | 7026 | 6046 | 2 | 2 | 0.03% | 0.03% | 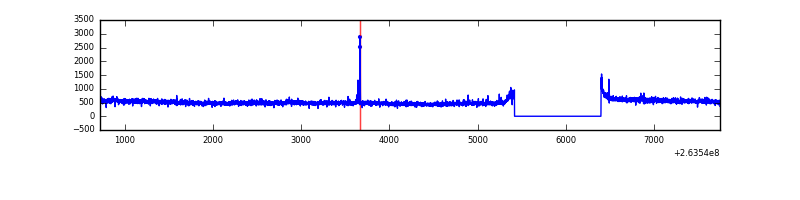 |
| D | 7026 | 6047 | 20 | 20 | 0.28% | 0.33% | 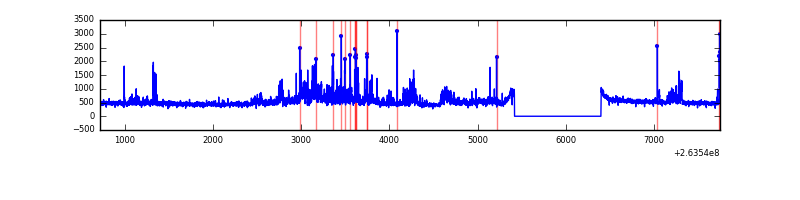 |
Top three noisy pixels from each quadrant. If the there are fewer than three noisy pixels in the level2.evt file, extra rows are filled as -1
| Pixel properties | Quadrant properties | ||||||
|---|---|---|---|---|---|---|---|
| Quadrant | DetID | PixID | Counts | Sigma | Mean | Median | Sigma |
| A | 12 | 189 | 146819 | 991.69 | 726 | 711 | 147.3 |
| A | 12 | 96 | 68393 | 459.38 | 726 | 711 | 147.3 |
| A | 8 | 15 | 13279 | 85.3 | 726 | 711 | 147.3 |
| B | 0 | 85 | 1928200 | 14674.81 | 692 | 675 | 131.3 |
| B | 0 | 189 | 101216 | 765.45 | 692 | 675 | 131.3 |
| B | 0 | 219 | 33529 | 250.13 | 692 | 675 | 131.3 |
| C | 3 | 233 | 318428 | 1946.02 | 709 | 714 | 163.3 |
| C | 0 | 207 | 13789 | 80.09 | 709 | 714 | 163.3 |
| C | 14 | 234 | 5805 | 31.18 | 709 | 714 | 163.3 |
| D | 1 | 52 | 472918 | 2574.59 | 706 | 688 | 183.4 |
| D | 10 | 157 | 64783 | 349.44 | 706 | 688 | 183.4 |
| D | 2 | 152 | 57110 | 307.61 | 706 | 688 | 183.4 |
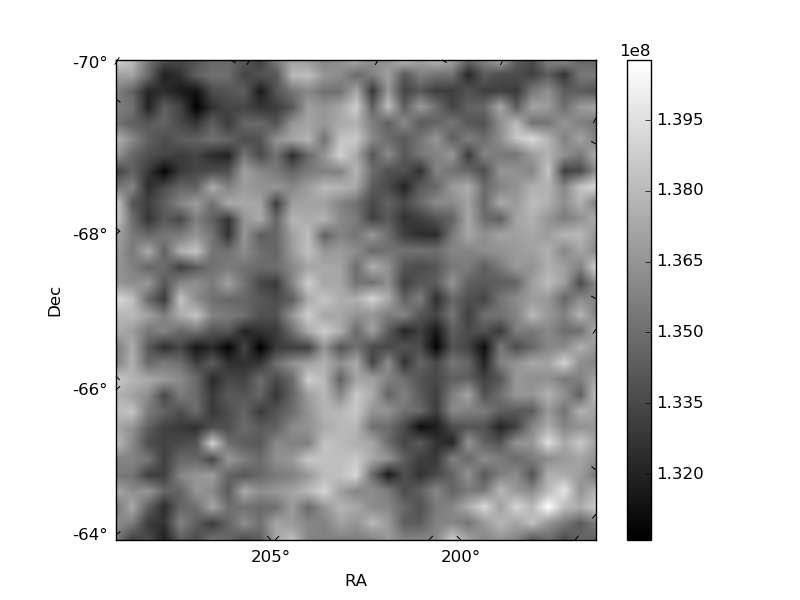
Histogram calculated using DETX and DETY for each event in the final _common_clean file
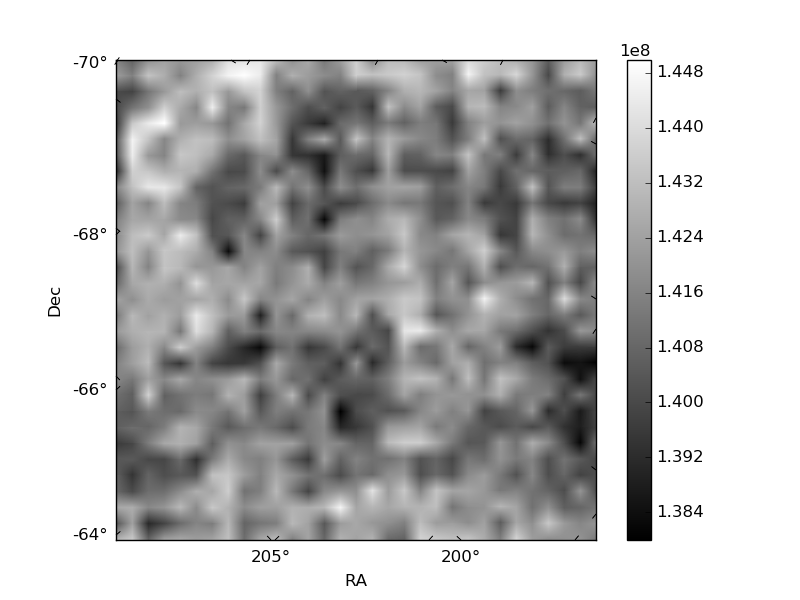
| Quadrant A | 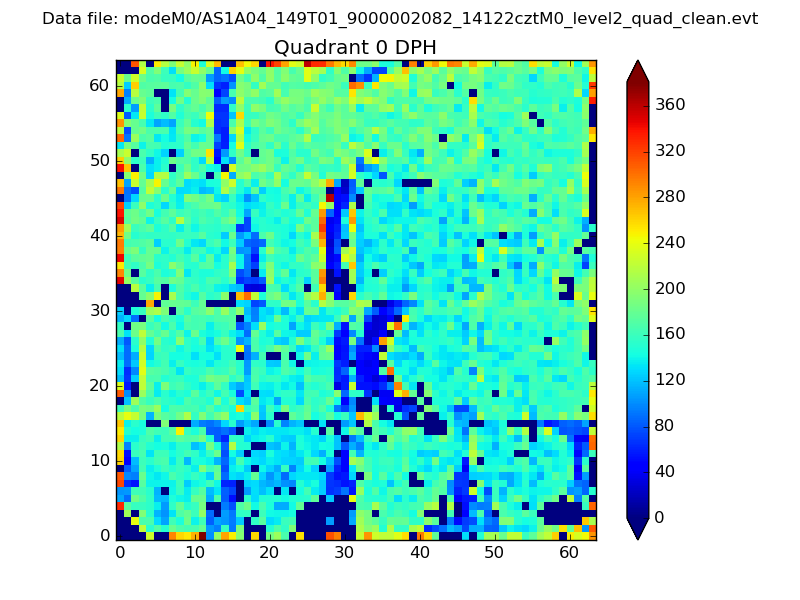 |
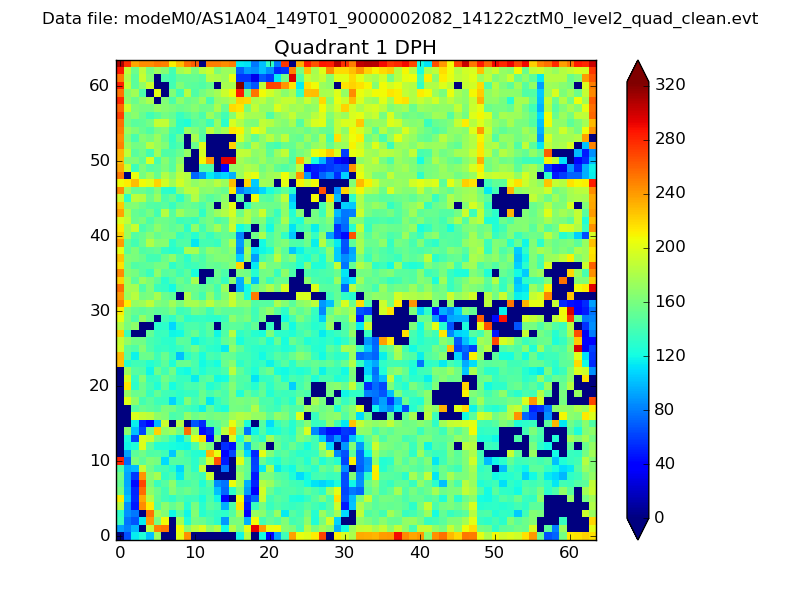 |
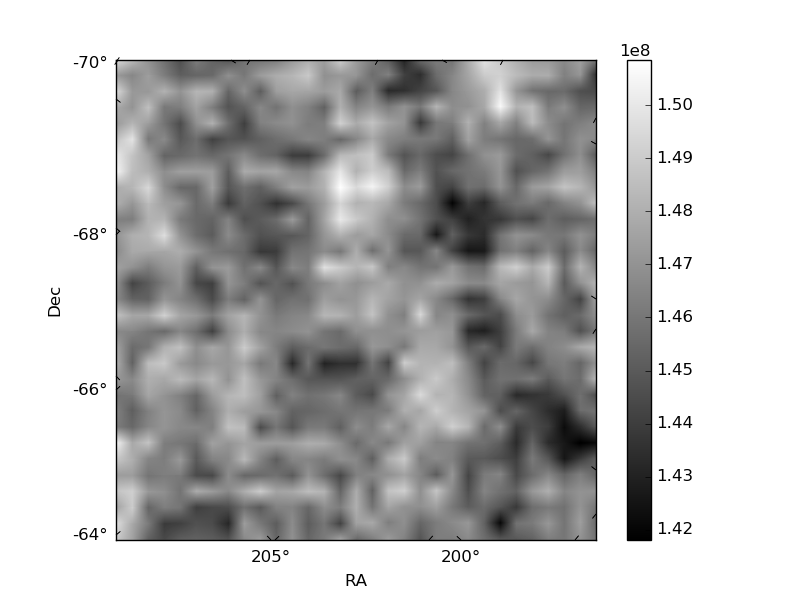
Quadrant B |
|---|---|---|---|
| Quadrant D |  |
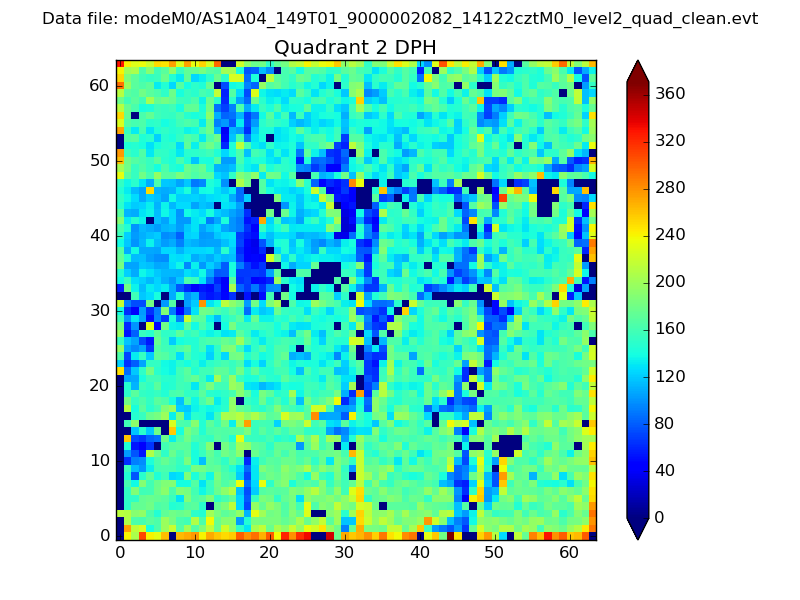 |
Quadrant C |
| Plot type | Count rate plots | Images |
|---|---|---|
| Comparison with Poisson distribution Blue bars denote a histogram of data divided into 1 sec bins. Red curve is a Poisson curve with rate = median count rate of data. |
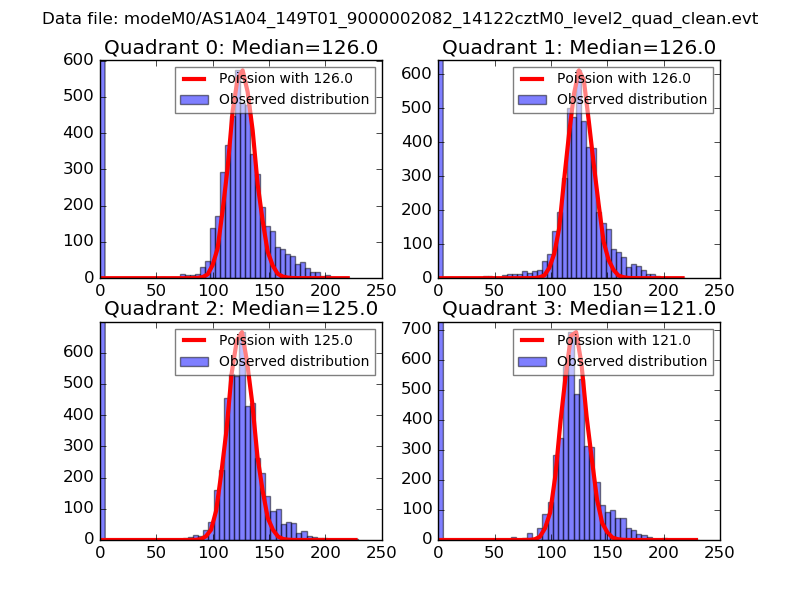 |
 |
| Quadrant-wise count rates Data is divided into 100 sec bins |
 |
|
| Module-wise count rates for Quadrant A Data is divided into 100 sec bins |
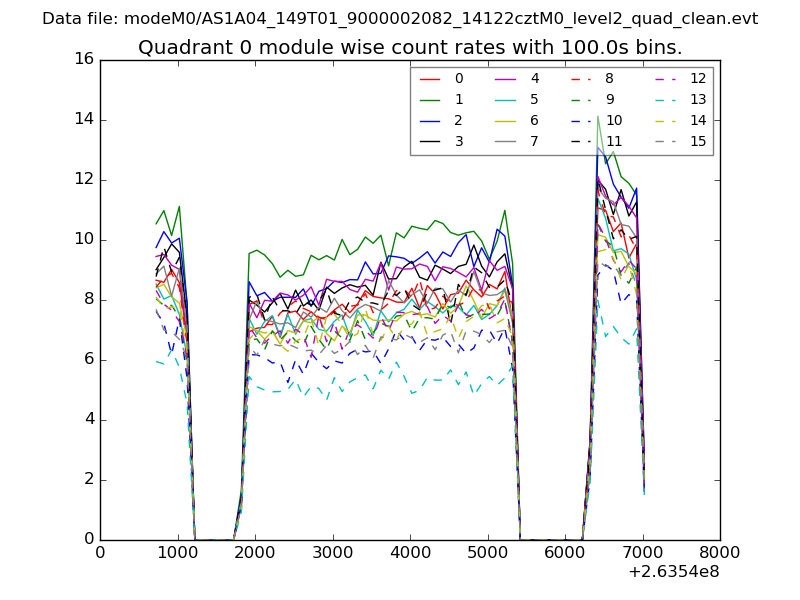 |
 |
| Module-wise count rates for Quadrant B Data is divided into 100 sec bins |
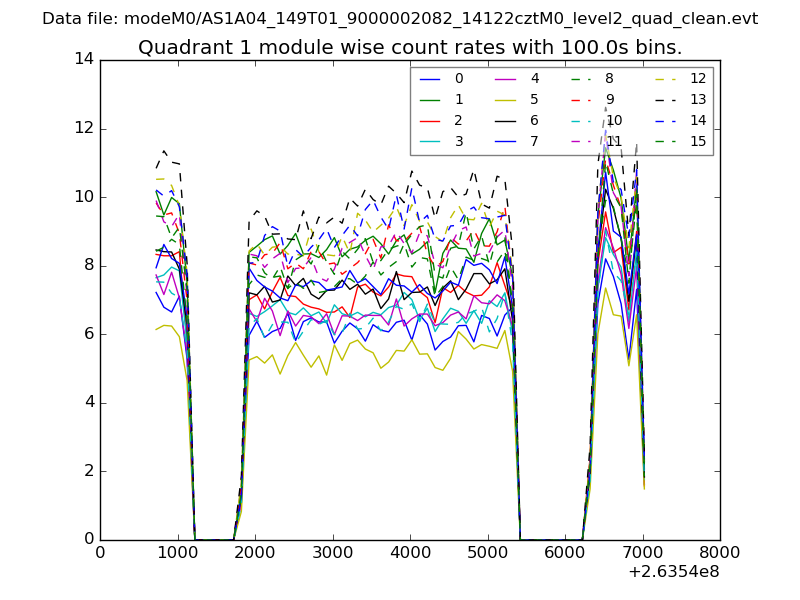 |
 |
| Module-wise count rates for Quadrant C Data is divided into 100 sec bins |
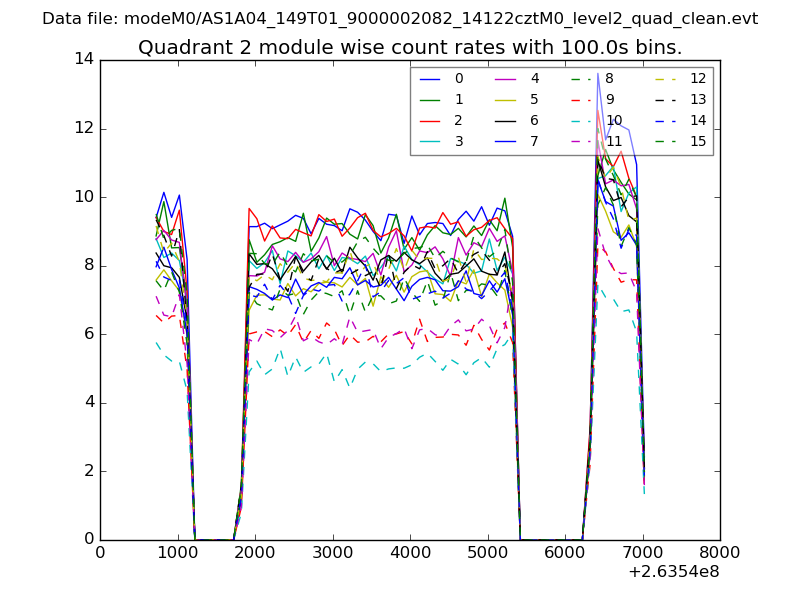 |
 |
| Module-wise count rates for Quadrant D Data is divided into 100 sec bins |
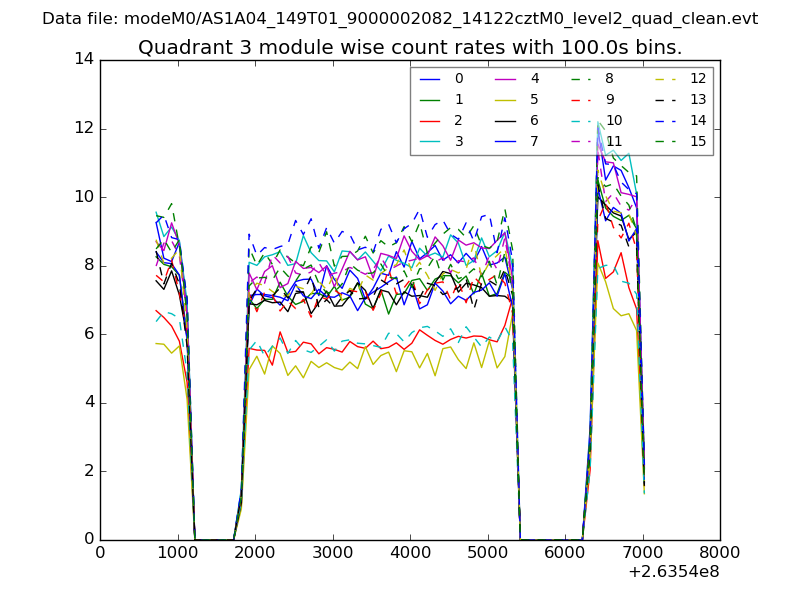 |
 |
| Parameter | Plot |
|---|---|
| CZT HV Monitor | 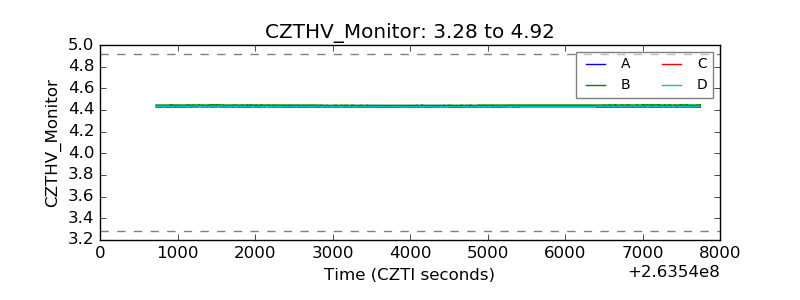 |
| D_VDD | 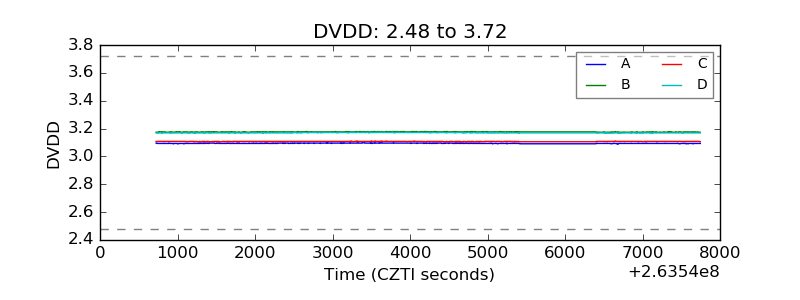 |
| Temperature 1 | 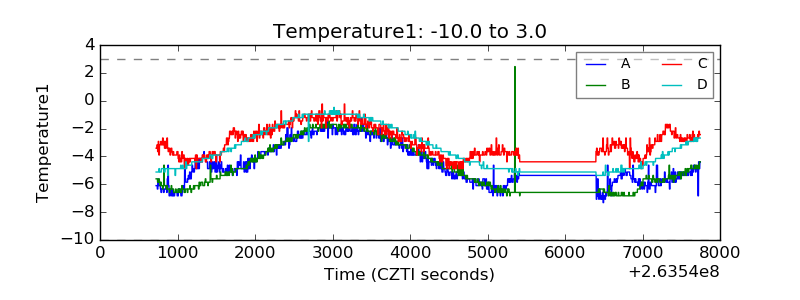 |
| Veto HV Monitor | 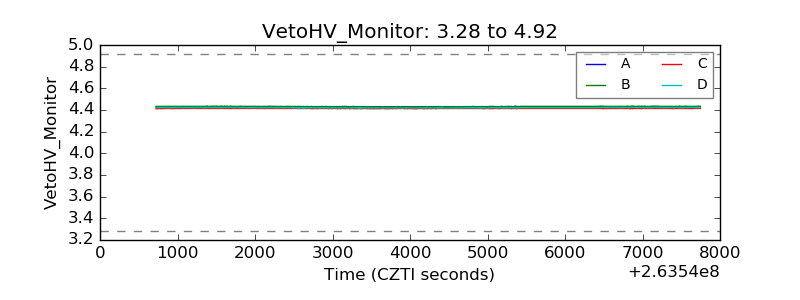 |
| Veto LLD | 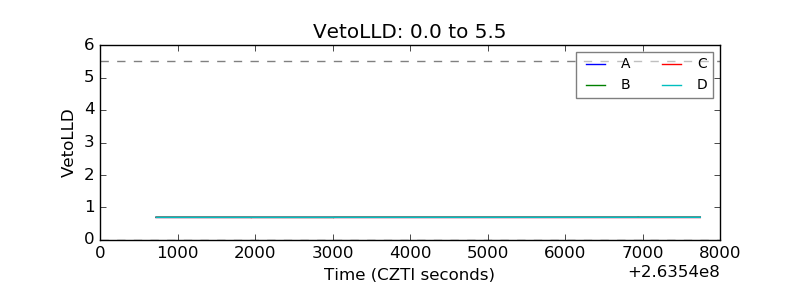 |
| Alpha Counter | 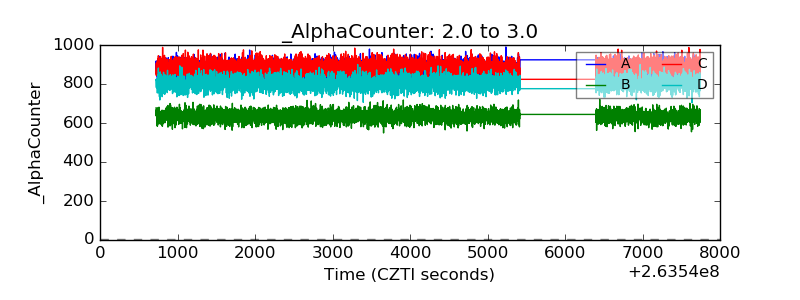 |
| _CPM_Rate | 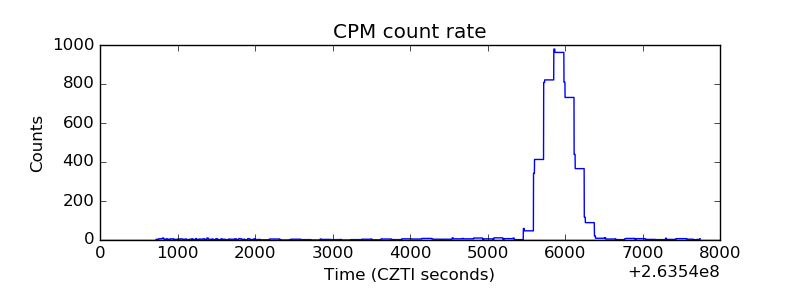 |
| CZT Counter |  |
| +2.5 Volts monitor |  |
| +5 Volts monitor |  |
| _ROLL_ROT | 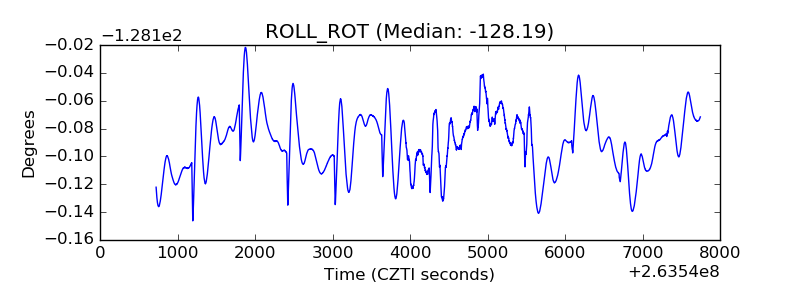 |
| _Roll_DEC | 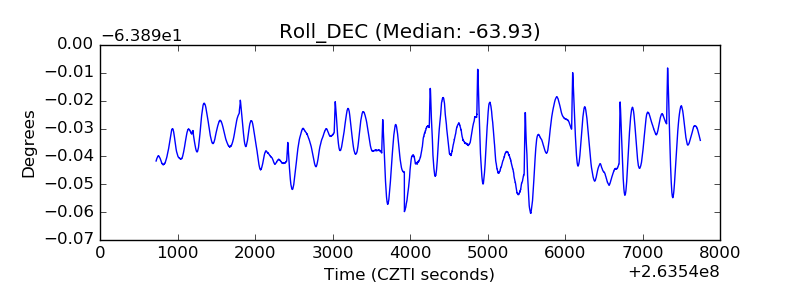 |
| _Roll_RA |  |
| Veto Counter | 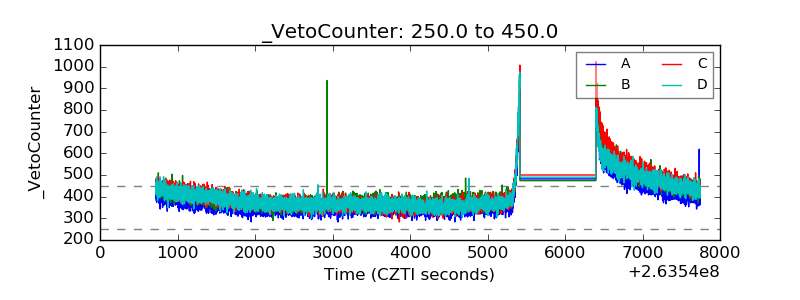 |