| Param | Original file | Final file |
|---|---|---|
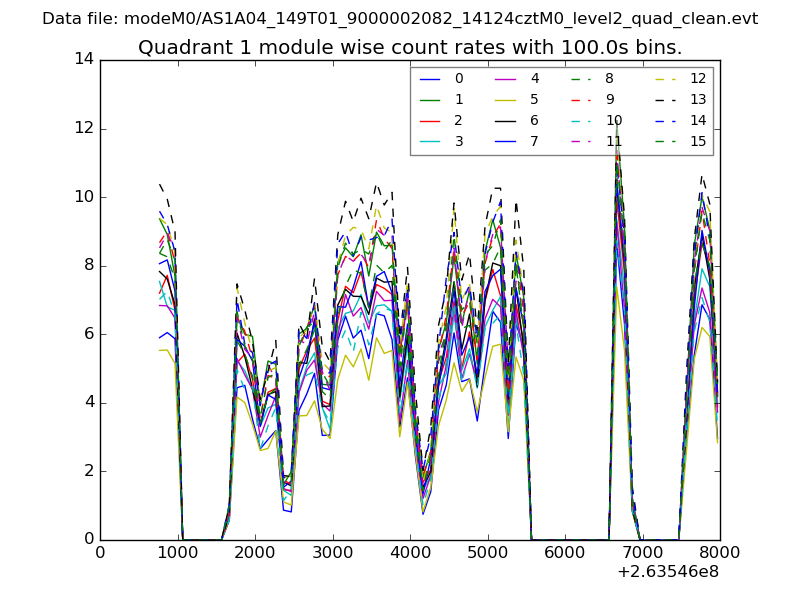
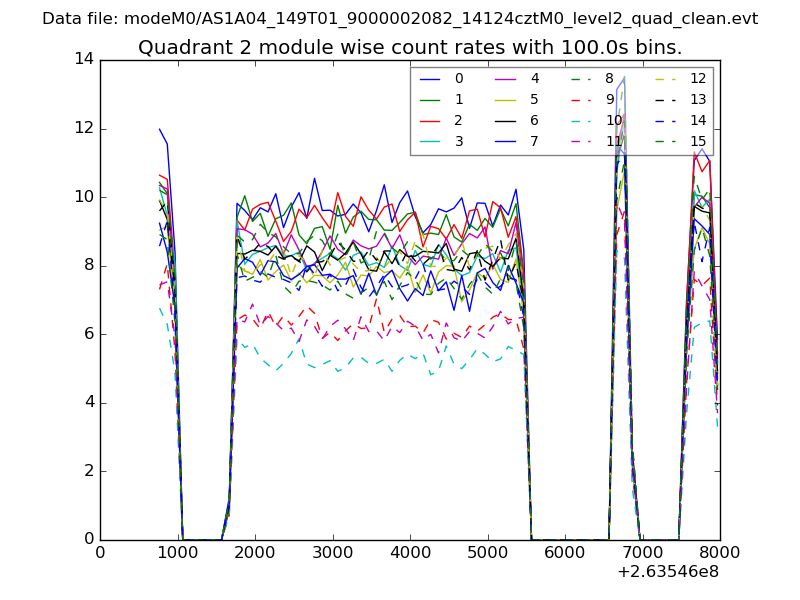
| Filename | modeM0/AS1A04_149T01_9000002082_14124cztM0_level2.evt | modeM0/AS1A04_149T01_9000002082_14124cztM0_level2_quad_clean.evt |
| Size (bytes) | 621,299,520 | 90,524,160 |
| Size | 592.5 MB | 86.3 MB |
| Events in quadrant A | 3,020,478 | 625,430 |
| Events in quadrant B | 8,970,401 | 459,785 |
| Events in quadrant C | 3,194,017 | 622,190 |
| Events in quadrant D | 3,215,468 | 604,907 |
| Mode SS | |||
|---|---|---|---|
| Quadrant | BADHDUFLAG | Total packets | Discarded packets |
| A | 0 | 126 | 0 |
| B | 0 | 126 | 0 |
| C | 0 | 126 | 0 |
| D | 0 | 126 | 0 |
| Mode M0 | |||
|---|---|---|---|
| Quadrant | BADHDUFLAG | Total packets | Discarded packets |
| A | 0 | 12915 | 2 |
| B | 0 | 30805 | 1 |
| C | 0 | 13361 | 1 |
| D | 0 | 13576 | 1 |
| Mode M9 | |||
|---|---|---|---|
| Quadrant | BADHDUFLAG | Total packets | Discarded packets |
| A | 0 | 11 | 0 |
| B | 0 | 11 | 0 |
| C | 0 | 11 | 0 |
| D | 0 | 11 | 0 |
| Quadrant | Total seconds | Saturated seconds | Saturation percentage |
|---|---|---|---|
| A | 6125 | 59 | 0.963265% |
| B | 6125 | 2734 | 44.636735% |
| C | 6125 | 50 | 0.816327% |
| D | 6125 | 62 | 1.012245% |
Noise dominated data is calculated using 1-second bins in cleaned event files. If a bin has >2000 counts, and if more than 50% of those come from <1% of pixels, then it is considered to be noise-dominated and hence unusable.
| Quadrant | # 1 sec bins | Bins with >0 counts | Bins with >2000 counts | High rate bins dominated by noise | Noise dominated (total time) | Noise dominated (detector-on time) | Marked lightcurve |
|---|---|---|---|---|---|---|---|
| A | 7256 | 6127 | 0 | 0 | 0.00% | 0.00% | 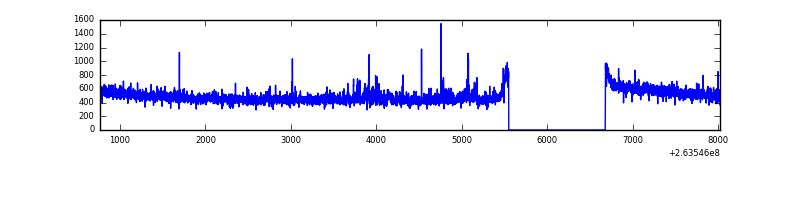 |
| B | 7256 | 6127 | 1865 | 1865 | 25.70% | 30.44% | 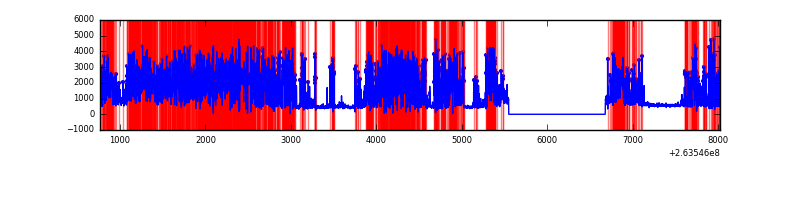 |
| C | 7256 | 6127 | 0 | 0 | 0.00% | 0.00% | 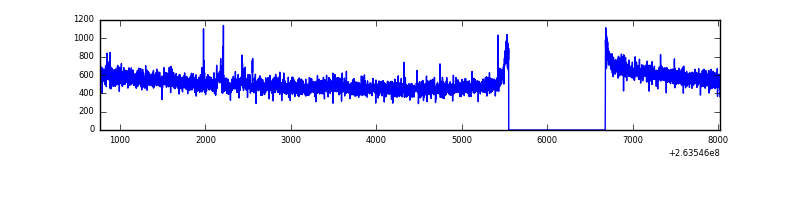 |
| D | 7256 | 6127 | 12 | 12 | 0.17% | 0.20% | 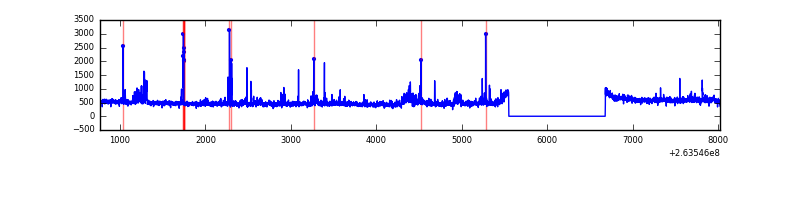 |
Top three noisy pixels from each quadrant. If the there are fewer than three noisy pixels in the level2.evt file, extra rows are filled as -1
| Pixel properties | Quadrant properties | ||||||
|---|---|---|---|---|---|---|---|
| Quadrant | DetID | PixID | Counts | Sigma | Mean | Median | Sigma |
| A | 12 | 189 | 66675 | 429.05 | 764 | 749 | 153.7 |
| A | 0 | 226 | 6849 | 39.7 | 764 | 749 | 153.7 |
| A | 2 | 79 | 6751 | 39.06 | 764 | 749 | 153.7 |
| B | 0 | 85 | 6527972 | 57822.46 | 604 | 590 | 112.9 |
| B | 0 | 189 | 22679 | 195.67 | 604 | 590 | 112.9 |
| B | 4 | 142 | 17637 | 151.01 | 604 | 590 | 112.9 |
| C | 3 | 233 | 281535 | 1665.0 | 741 | 745 | 168.6 |
| C | 10 | 22 | 15161 | 85.48 | 741 | 745 | 168.6 |
| C | 13 | 61 | 5415 | 27.69 | 741 | 745 | 168.6 |
| D | 1 | 52 | 157305 | 889.01 | 742 | 723 | 176.1 |
| D | 8 | 195 | 118521 | 668.81 | 742 | 723 | 176.1 |
| D | 2 | 152 | 71318 | 400.81 | 742 | 723 | 176.1 |
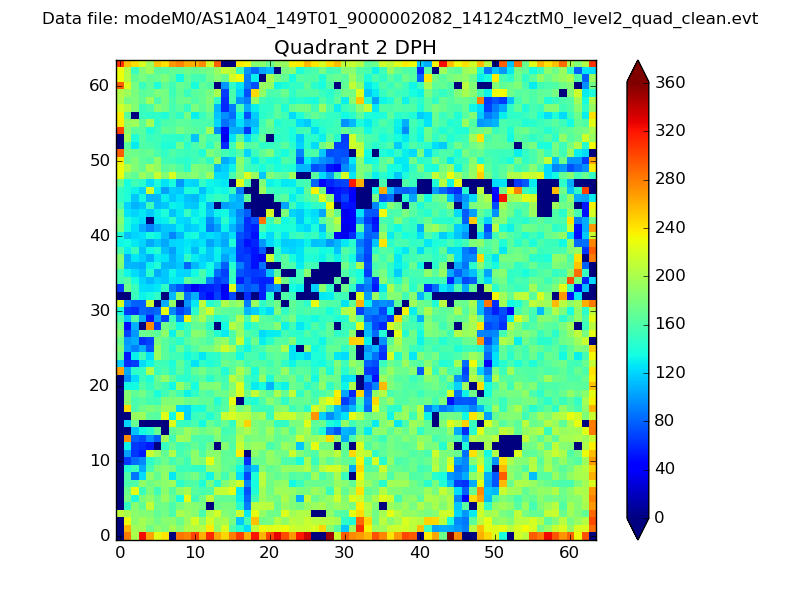
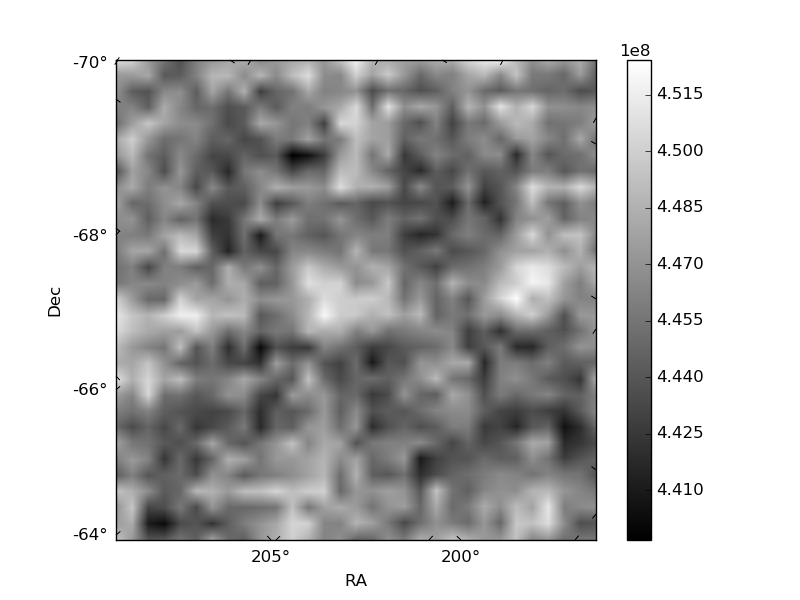
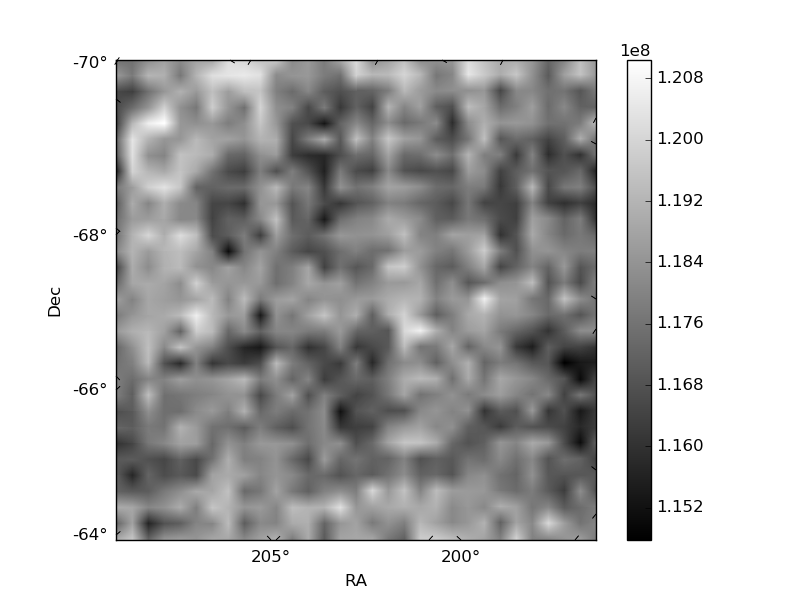
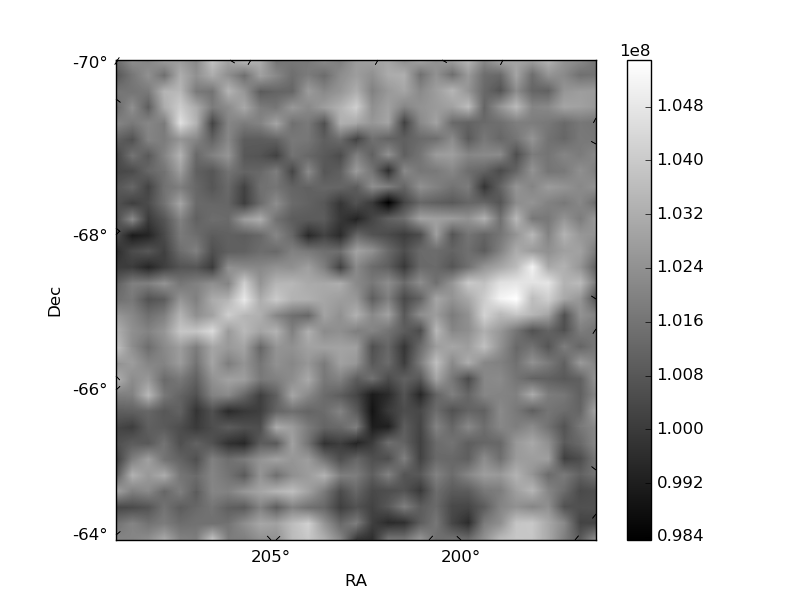
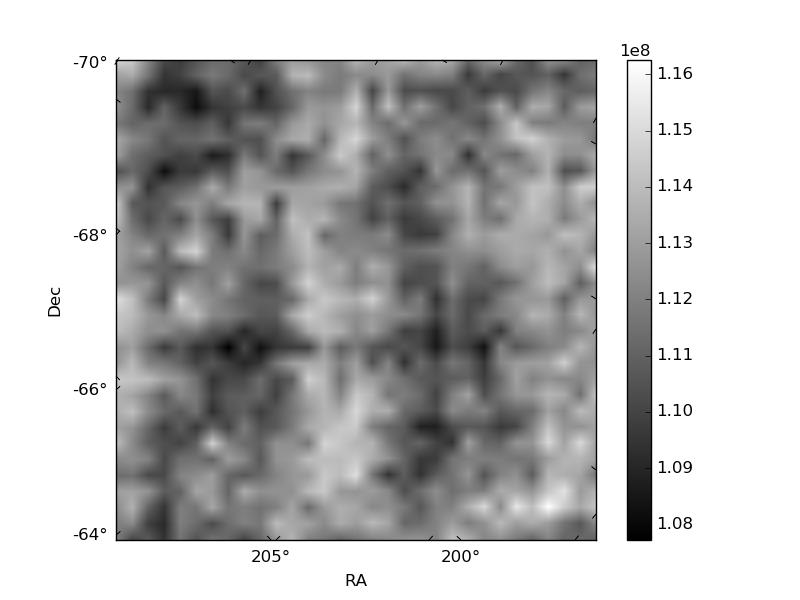
Histogram calculated using DETX and DETY for each event in the final _common_clean file
| Quadrant A | 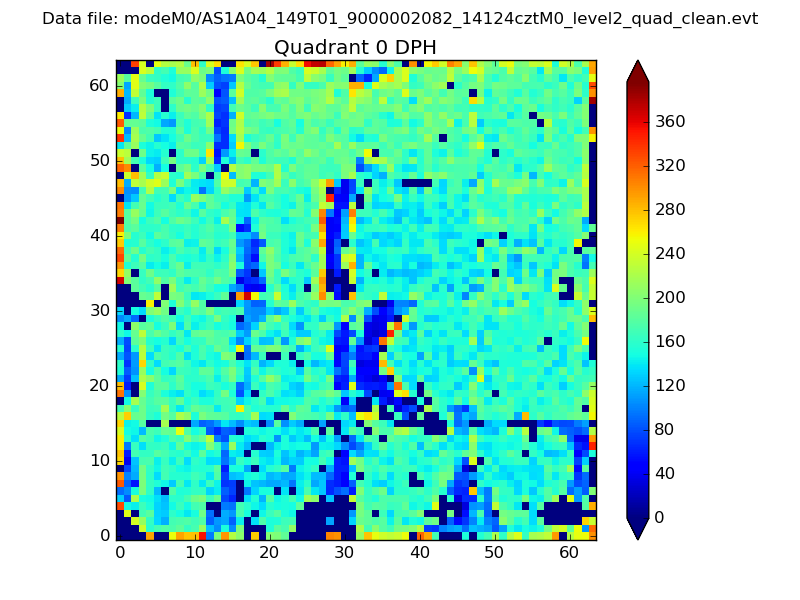 |
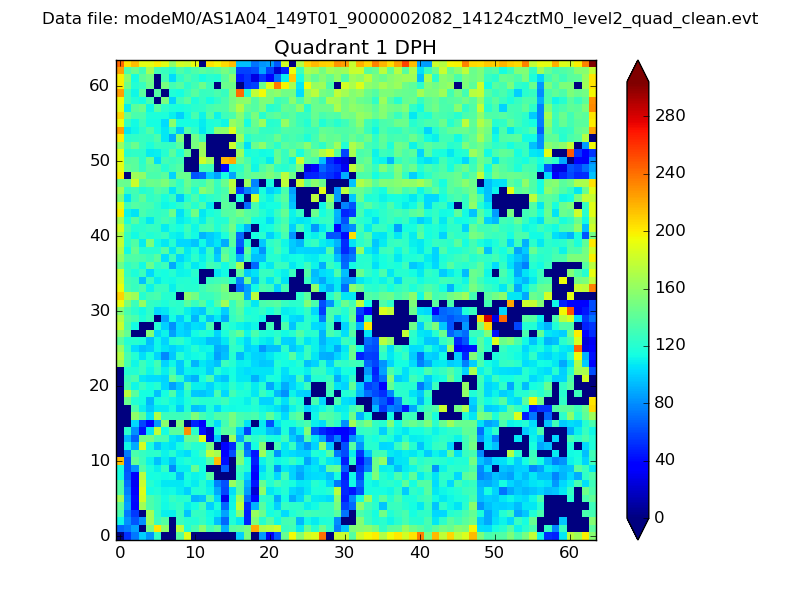 |
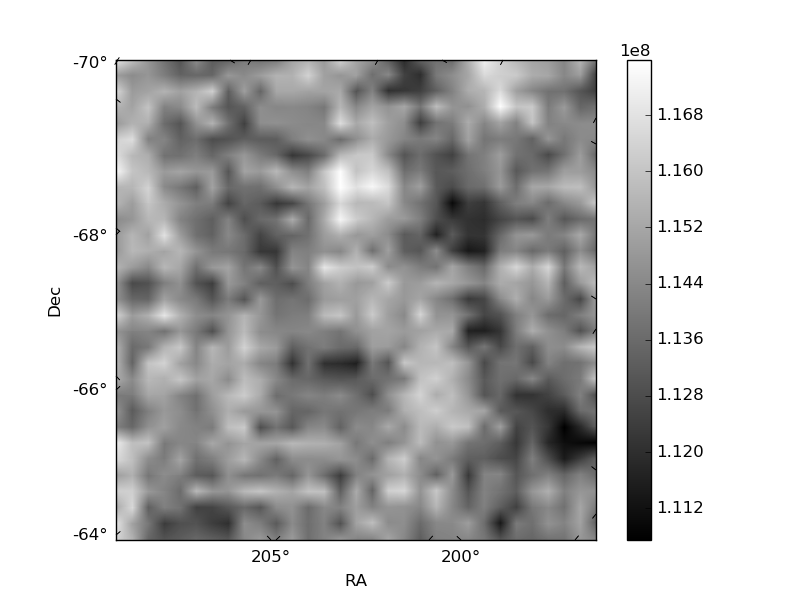
Quadrant B |
|---|---|---|---|
| Quadrant D | 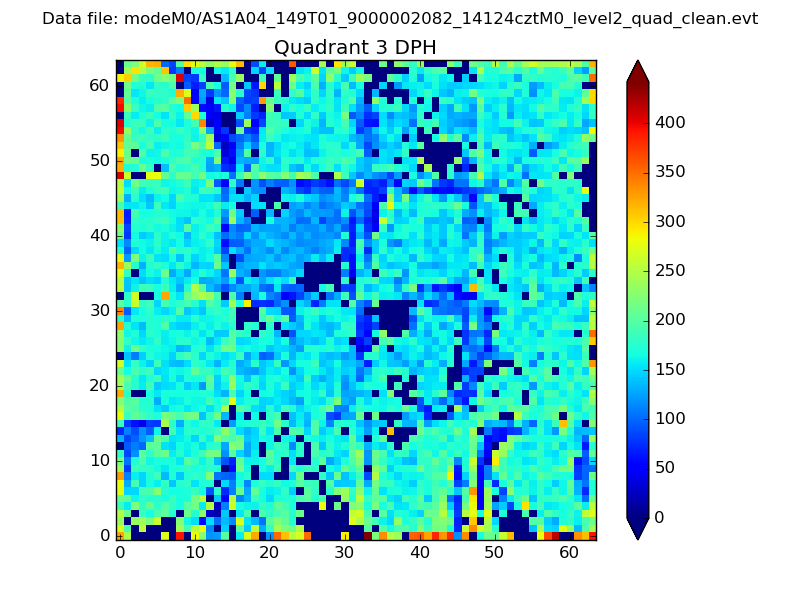 |
 |
Quadrant C |
| Plot type | Count rate plots | Images |
|---|---|---|
| Comparison with Poisson distribution Blue bars denote a histogram of data divided into 1 sec bins. Red curve is a Poisson curve with rate = median count rate of data. |
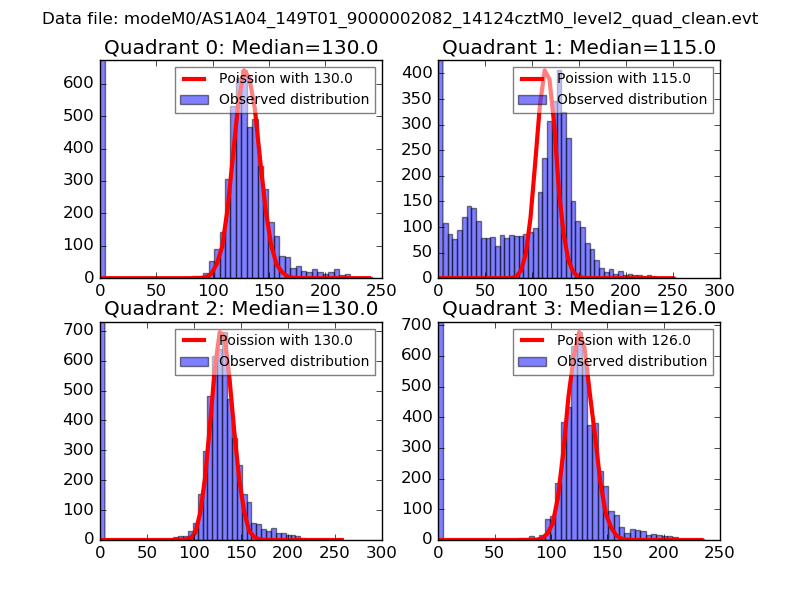 |
 |
| Quadrant-wise count rates Data is divided into 100 sec bins |
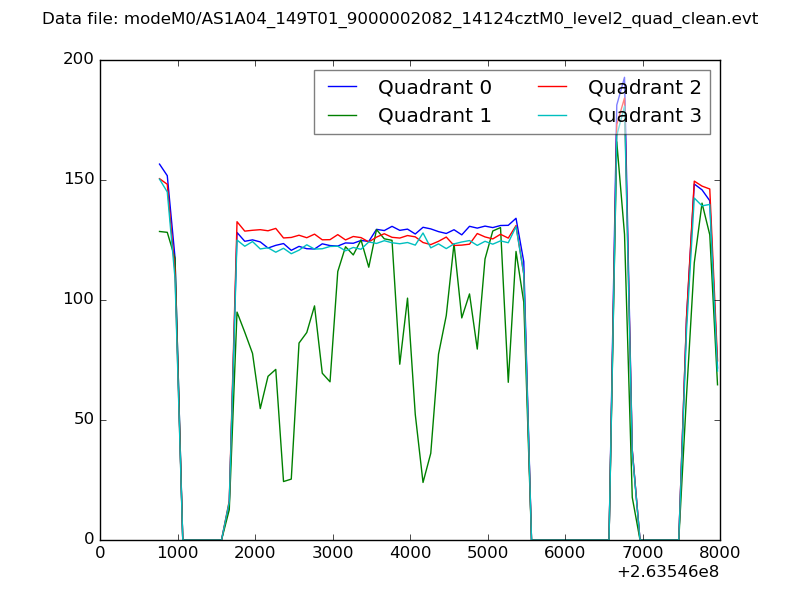 |
|
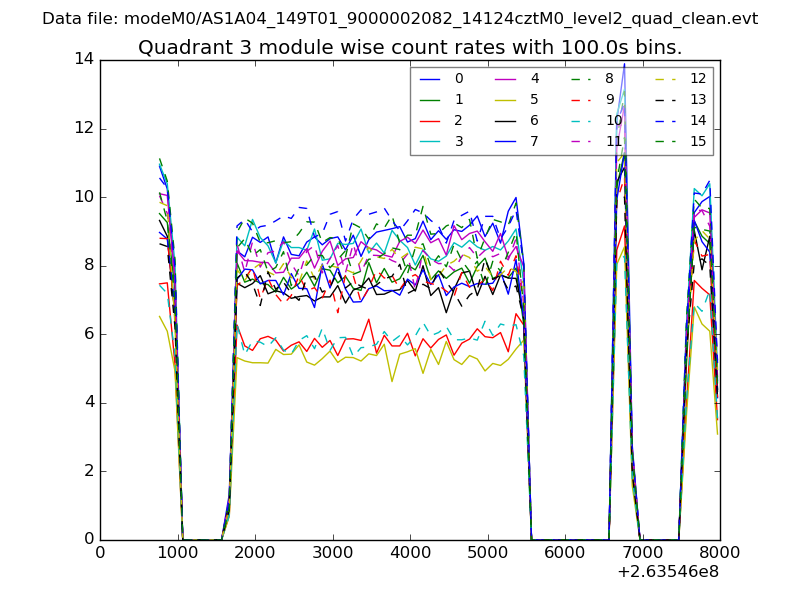
| Module-wise count rates for Quadrant A Data is divided into 100 sec bins |
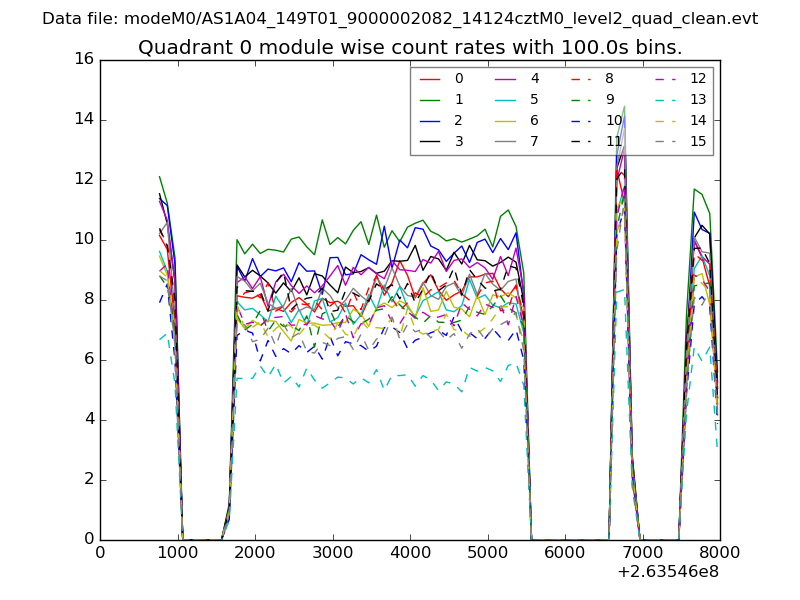 |
 |
| Module-wise count rates for Quadrant B Data is divided into 100 sec bins |
 |
 |
| Module-wise count rates for Quadrant C Data is divided into 100 sec bins |
 |
 |
| Module-wise count rates for Quadrant D Data is divided into 100 sec bins |
 |
 |
| Parameter | Plot |
|---|---|
| CZT HV Monitor | 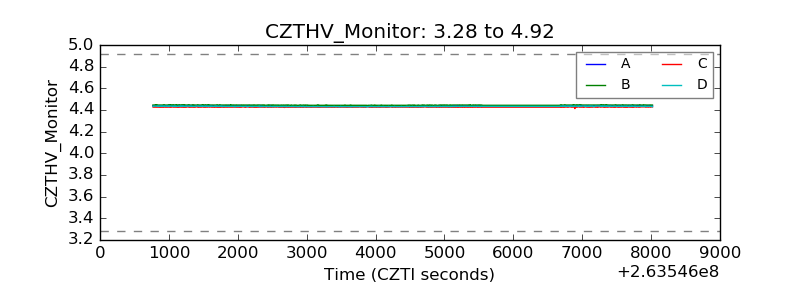 |
| D_VDD | 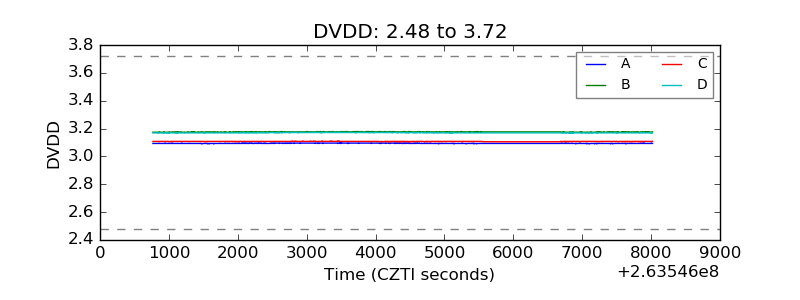 |
| Temperature 1 | 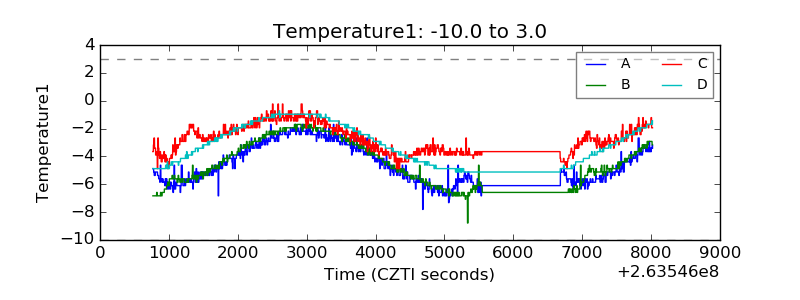 |
| Veto HV Monitor | 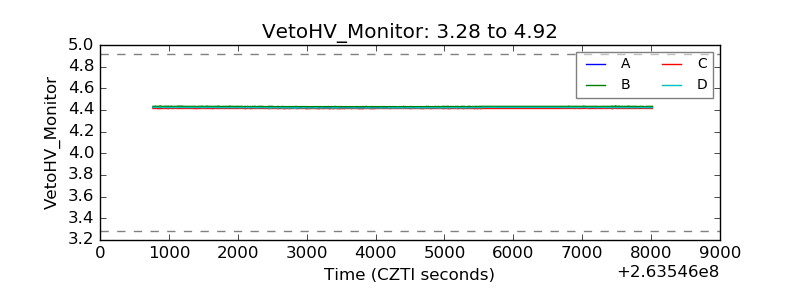 |
| Veto LLD | 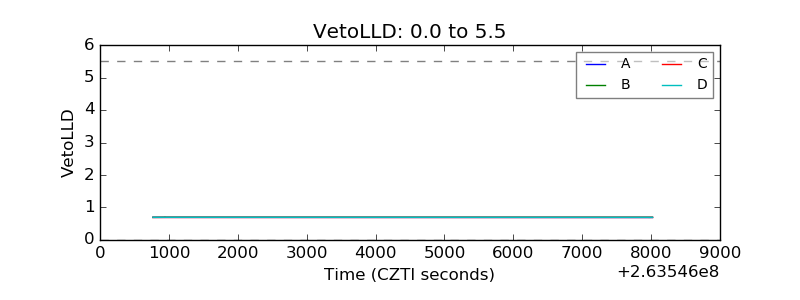 |
| Alpha Counter | 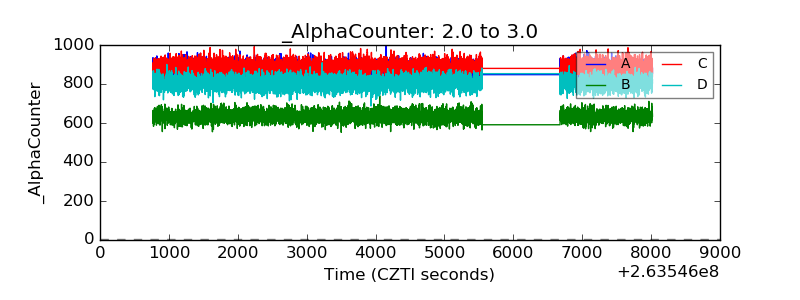 |
| _CPM_Rate | 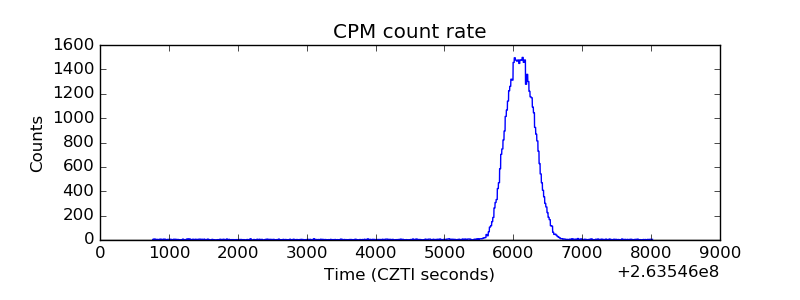 |
| CZT Counter | 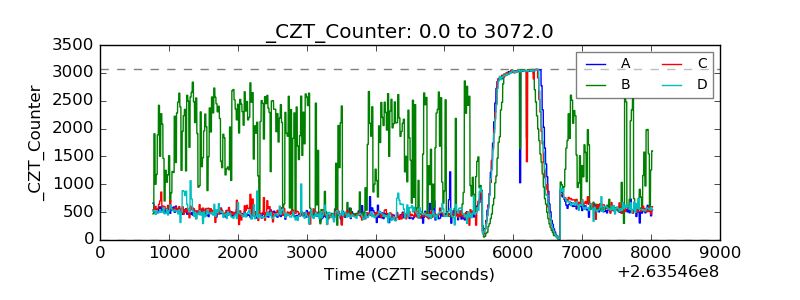 |
| +2.5 Volts monitor |  |
| +5 Volts monitor | 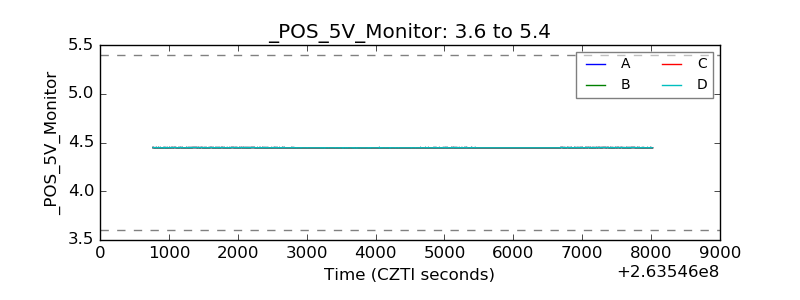 |
| _ROLL_ROT | 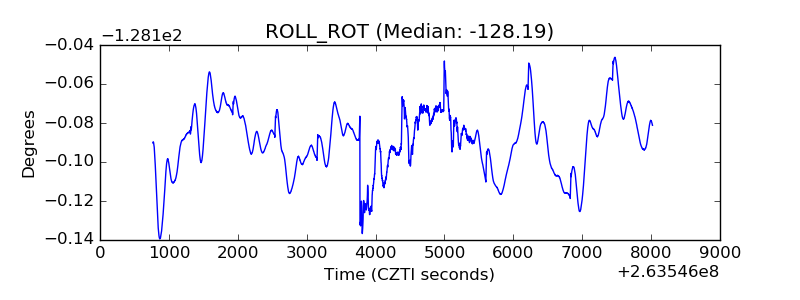 |
| _Roll_DEC | 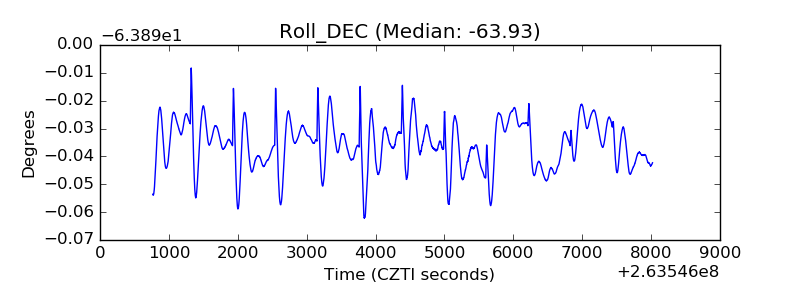 |
| _Roll_RA | 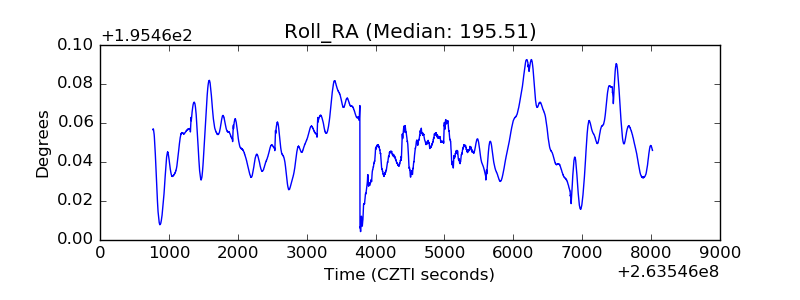 |
| Veto Counter | 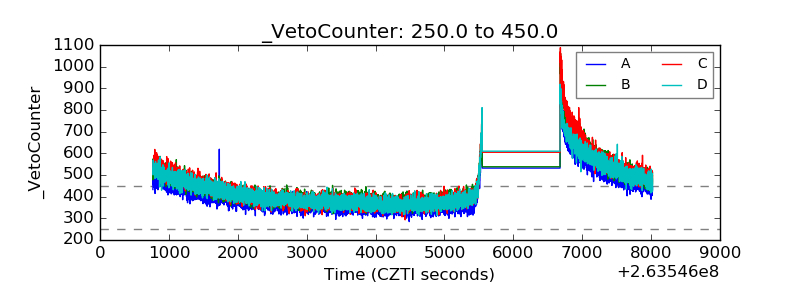 |