| Param | Original file | Final file |
|---|---|---|
| Filename | modeM0/AS1A04_149T01_9000002082_14125cztM0_level2.evt | modeM0/AS1A04_149T01_9000002082_14125cztM0_level2_quad_clean.evt |
| Size (bytes) | 561,850,560 | 107,225,280 |
| Size | 535.8 MB | 102.3 MB |
| Events in quadrant A | 3,316,315 | 729,312 |
| Events in quadrant B | 6,131,932 | 654,588 |
| Events in quadrant C | 3,422,427 | 719,985 |
| Events in quadrant D | 3,713,460 | 699,015 |
| Mode SS | |||
|---|---|---|---|
| Quadrant | BADHDUFLAG | Total packets | Discarded packets |
| A | 0 | 130 | 0 |
| B | 0 | 130 | 0 |
| C | 0 | 130 | 0 |
| D | 0 | 130 | 0 |
| Mode M0 | |||
|---|---|---|---|
| Quadrant | BADHDUFLAG | Total packets | Discarded packets |
| A | 0 | 13975 | 3 |
| B | 0 | 22484 | 2 |
| C | 0 | 14261 | 2 |
| D | 0 | 15100 | 2 |
| Mode M9 | |||
|---|---|---|---|
| Quadrant | BADHDUFLAG | Total packets | Discarded packets |
| A | 0 | 12 | 0 |
| B | 0 | 12 | 0 |
| C | 0 | 12 | 0 |
| D | 0 | 12 | 0 |
| Quadrant | Total seconds | Saturated seconds | Saturation percentage |
|---|---|---|---|
| A | 6362 | 98 | 1.540396% |
| B | 6362 | 1198 | 18.830556% |
| C | 6362 | 88 | 1.383213% |
| D | 6363 | 96 | 1.508722% |
Noise dominated data is calculated using 1-second bins in cleaned event files. If a bin has >2000 counts, and if more than 50% of those come from <1% of pixels, then it is considered to be noise-dominated and hence unusable.
| Quadrant | # 1 sec bins | Bins with >0 counts | Bins with >2000 counts | High rate bins dominated by noise | Noise dominated (total time) | Noise dominated (detector-on time) | Marked lightcurve |
|---|---|---|---|---|---|---|---|
| A | 7583 | 6364 | 2 | 2 | 0.03% | 0.03% | 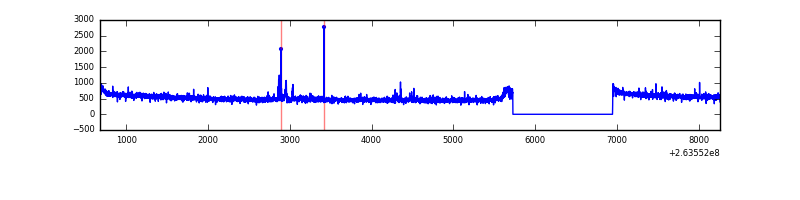 |
| B | 7583 | 6364 | 812 | 812 | 10.71% | 12.76% | 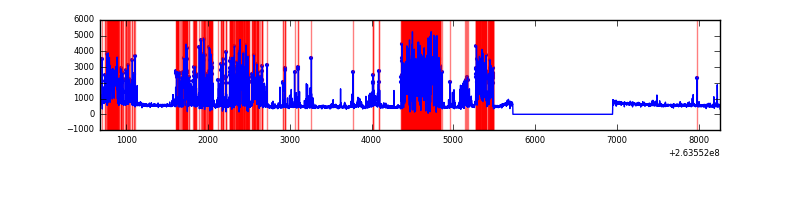 |
| C | 7583 | 6364 | 0 | 0 | 0.00% | 0.00% | 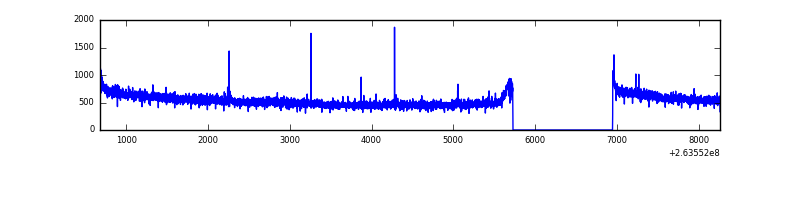 |
| D | 7584 | 6365 | 7 | 7 | 0.09% | 0.11% | 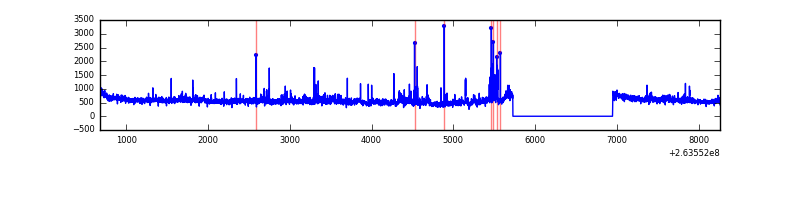 |
Top three noisy pixels from each quadrant. If the there are fewer than three noisy pixels in the level2.evt file, extra rows are filled as -1
| Pixel properties | Quadrant properties | ||||||
|---|---|---|---|---|---|---|---|
| Quadrant | DetID | PixID | Counts | Sigma | Mean | Median | Sigma |
| A | 12 | 189 | 71964 | 424.08 | 839 | 824 | 167.8 |
| A | 13 | 248 | 10057 | 55.04 | 839 | 824 | 167.8 |
| A | 0 | 226 | 7769 | 41.4 | 839 | 824 | 167.8 |
| B | 0 | 85 | 2968122 | 20930.46 | 771 | 753 | 141.8 |
| B | 0 | 189 | 50816 | 353.12 | 771 | 753 | 141.8 |
| B | 3 | 209 | 35923 | 248.07 | 771 | 753 | 141.8 |
| C | 3 | 233 | 250732 | 1363.74 | 808 | 815 | 183.3 |
| C | 10 | 22 | 11534 | 58.49 | 808 | 815 | 183.3 |
| C | 0 | 207 | 6217 | 29.47 | 808 | 815 | 183.3 |
| D | 8 | 195 | 351133 | 1837.47 | 812 | 794 | 190.7 |
| D | 2 | 152 | 84756 | 440.37 | 812 | 794 | 190.7 |
| D | 10 | 157 | 66116 | 342.6 | 812 | 794 | 190.7 |
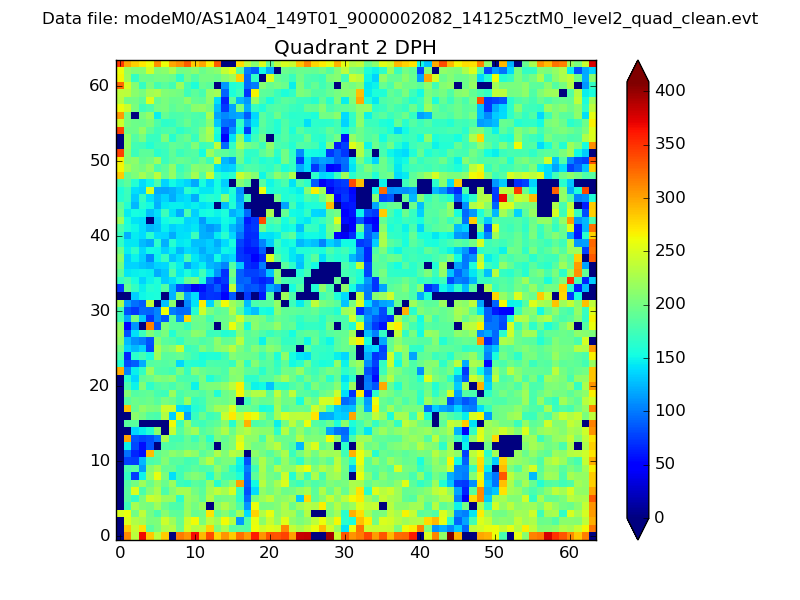
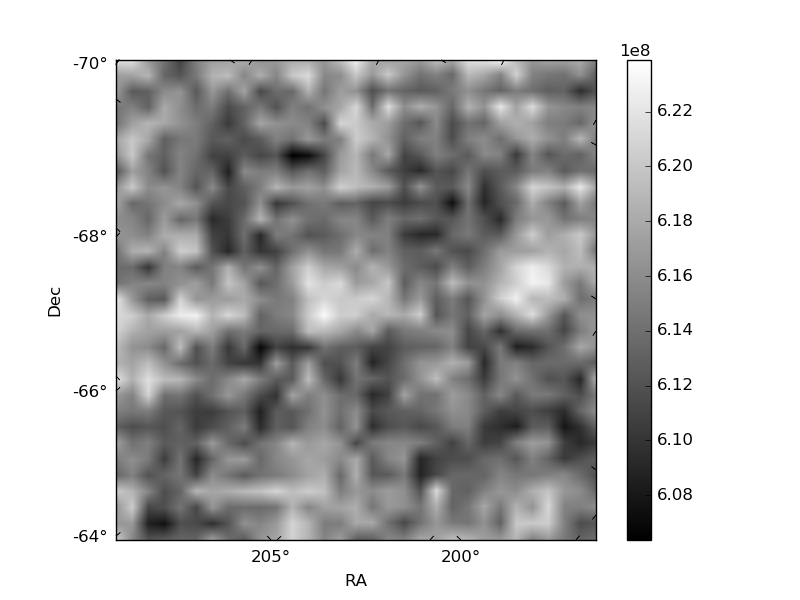
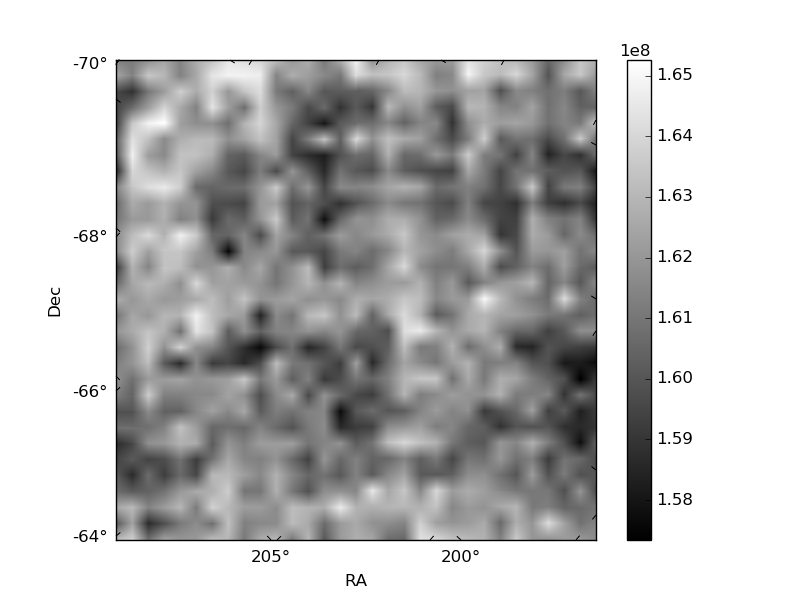
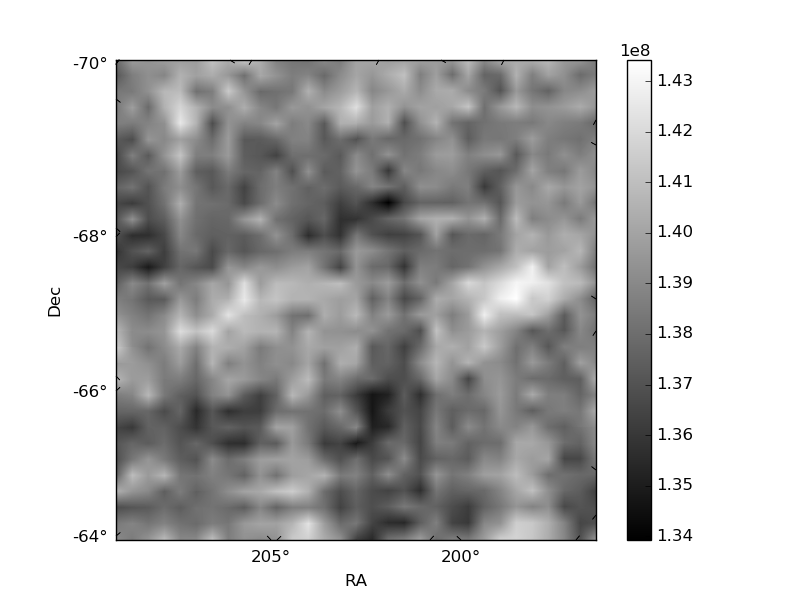
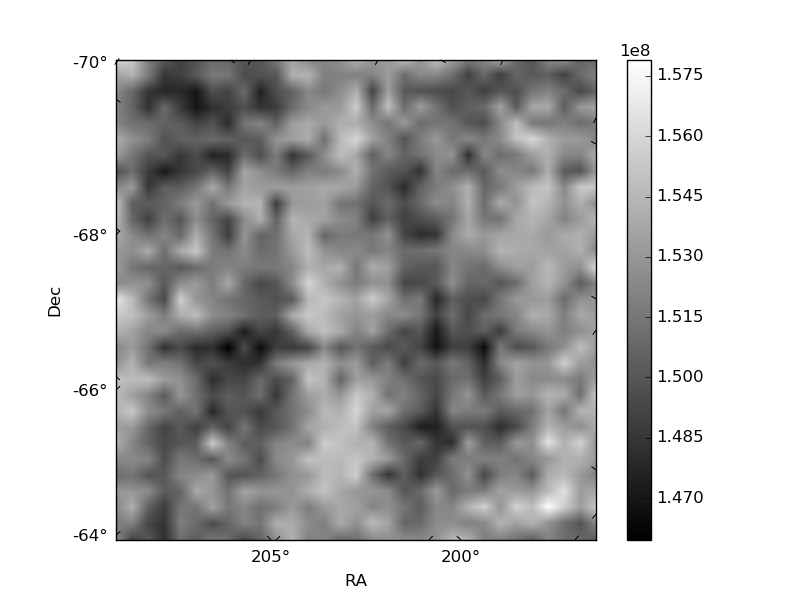
Histogram calculated using DETX and DETY for each event in the final _common_clean file
| Quadrant A | 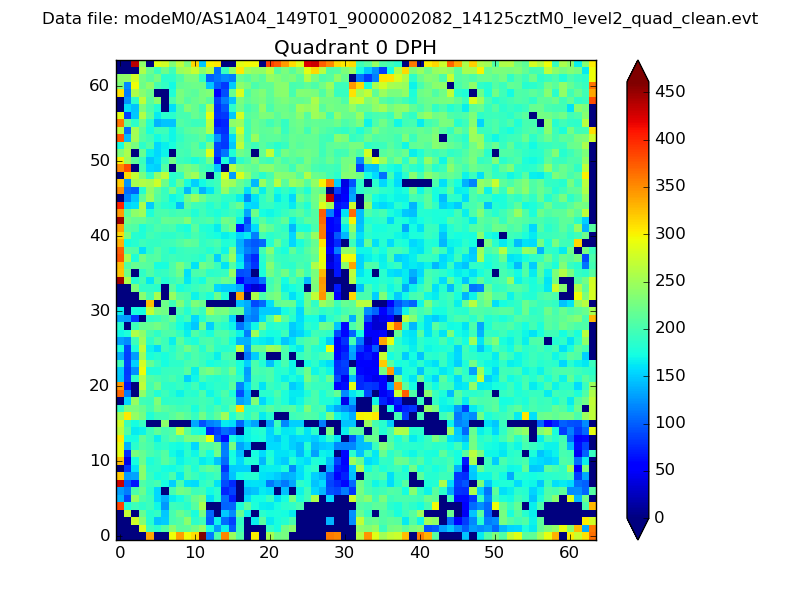 |
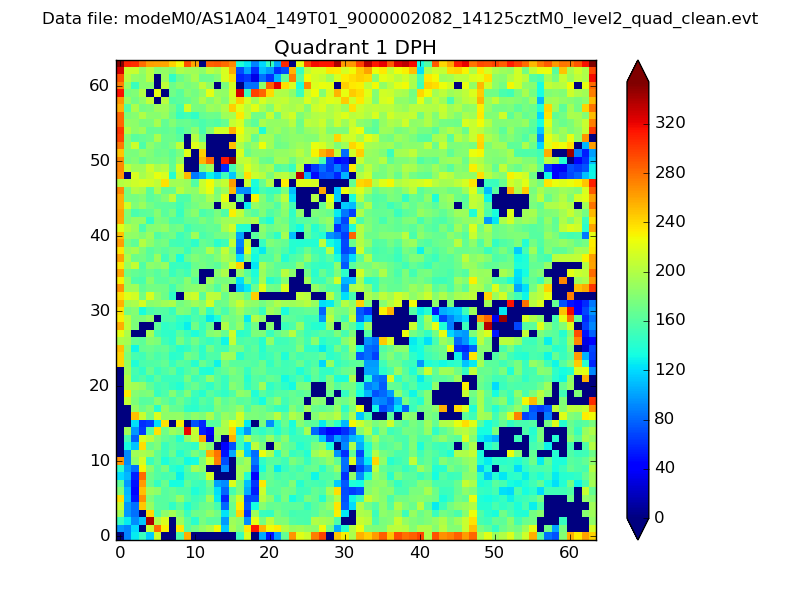 |
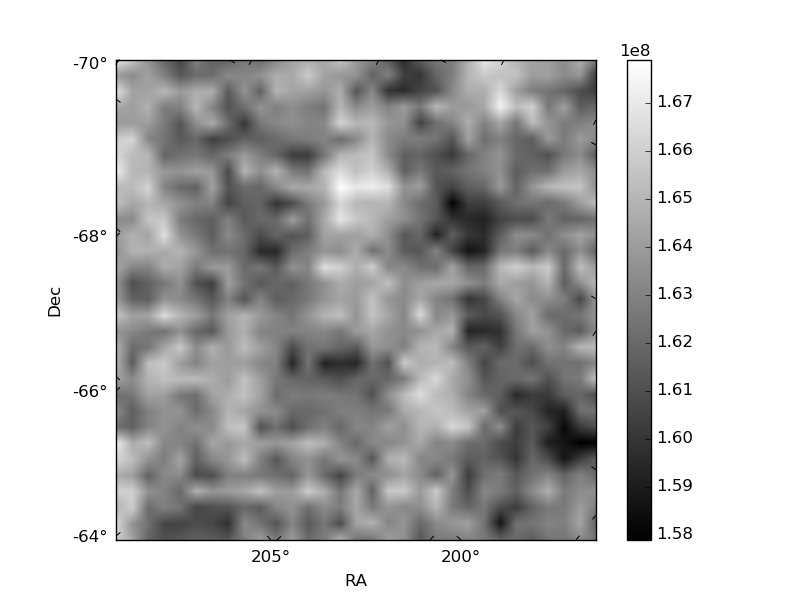
Quadrant B |
|---|---|---|---|
| Quadrant D | 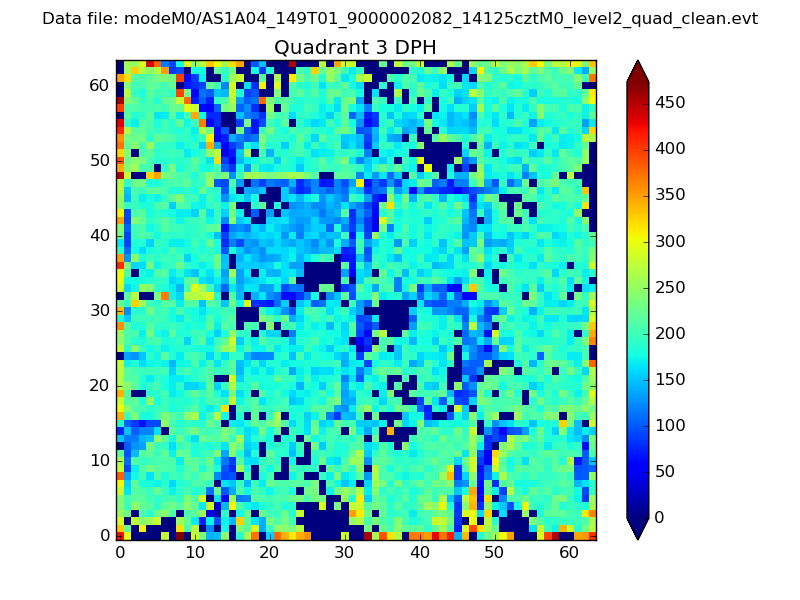 |
 |
Quadrant C |
| Plot type | Count rate plots | Images |
|---|---|---|
| Comparison with Poisson distribution Blue bars denote a histogram of data divided into 1 sec bins. Red curve is a Poisson curve with rate = median count rate of data. |
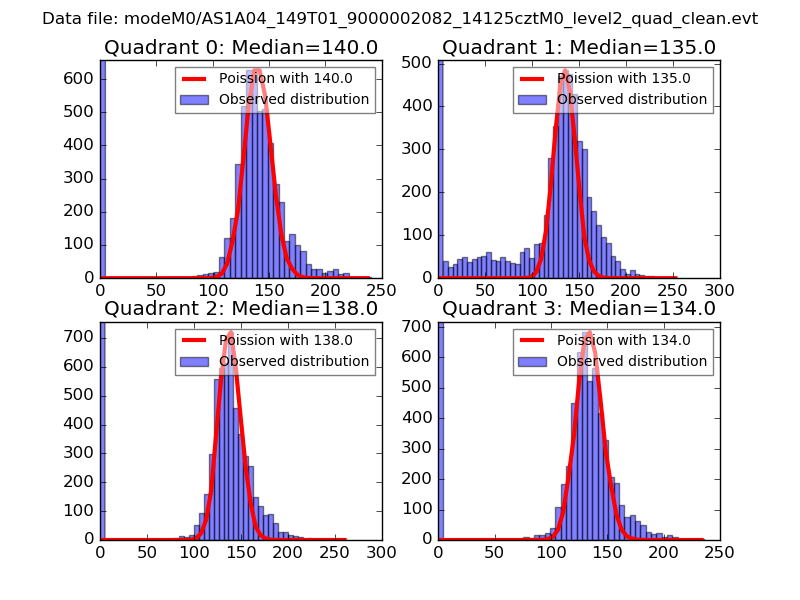 |
 |
| Quadrant-wise count rates Data is divided into 100 sec bins |
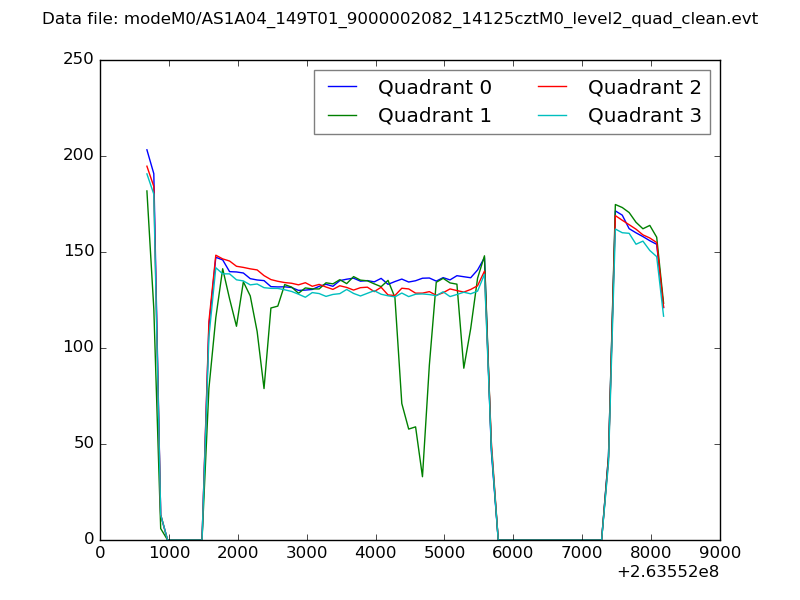 |
|
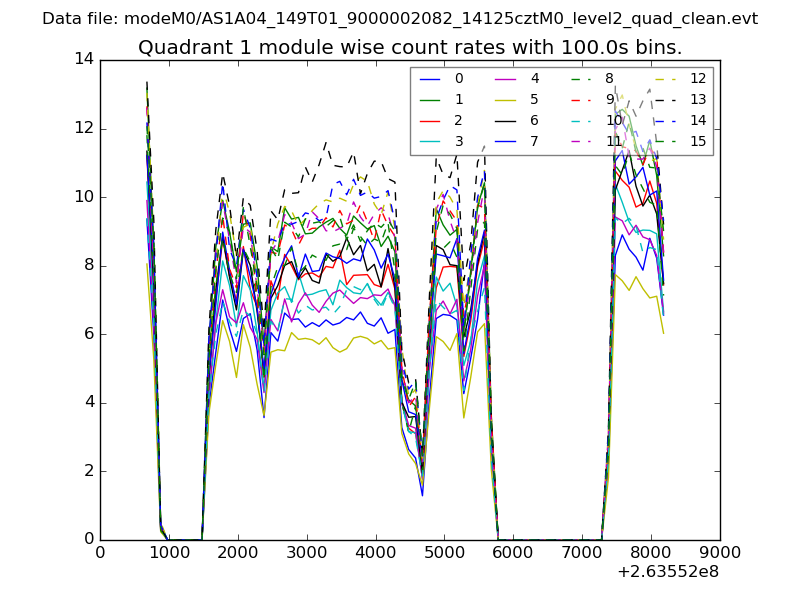
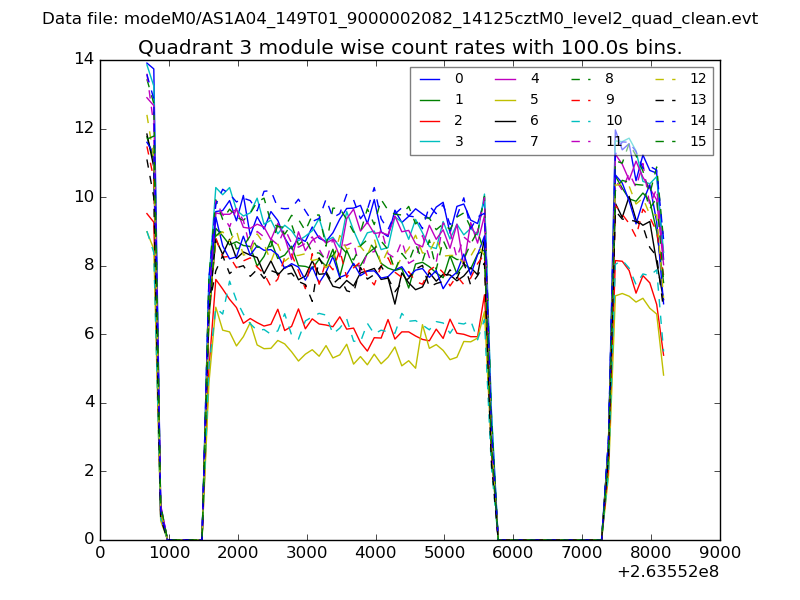
| Module-wise count rates for Quadrant A Data is divided into 100 sec bins |
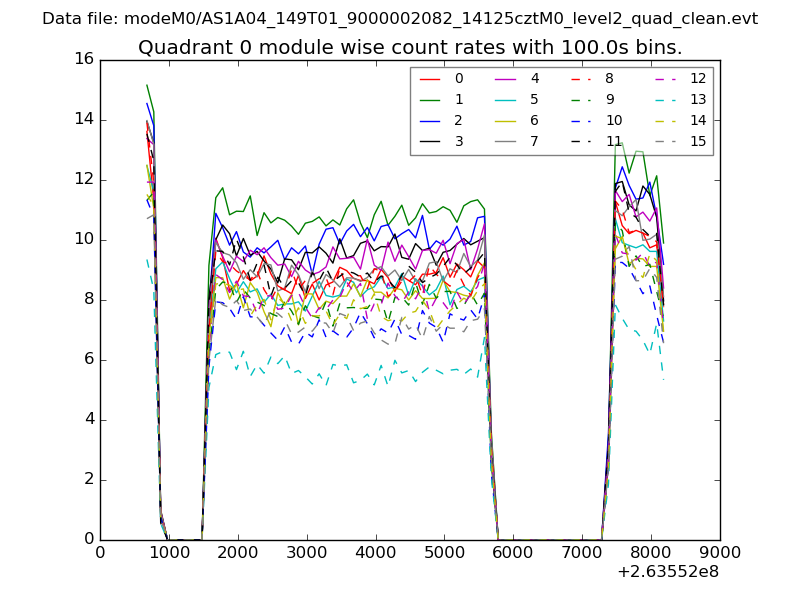 |
 |
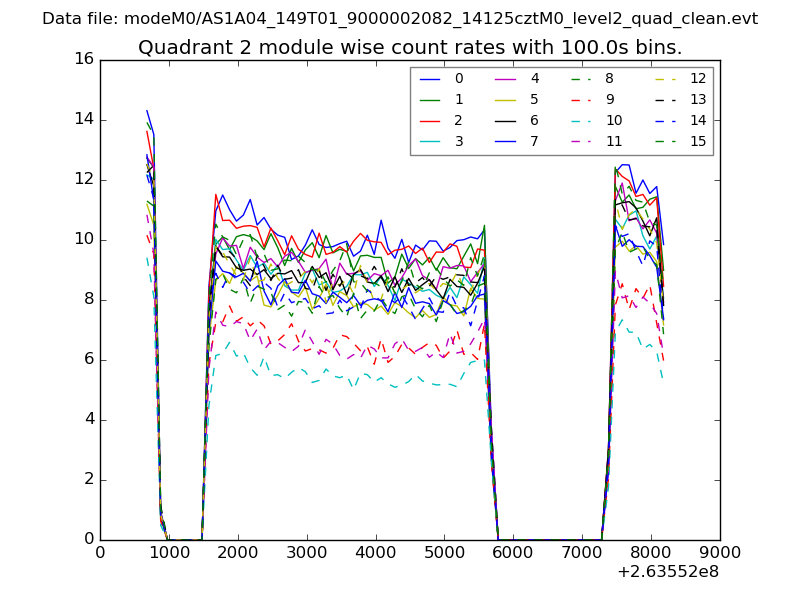
| Module-wise count rates for Quadrant B Data is divided into 100 sec bins |
 |
 |
| Module-wise count rates for Quadrant C Data is divided into 100 sec bins |
 |
 |
| Module-wise count rates for Quadrant D Data is divided into 100 sec bins |
 |
 |
| Parameter | Plot |
|---|---|
| CZT HV Monitor | 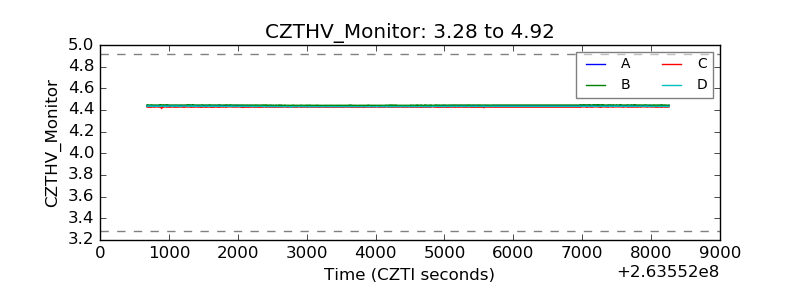 |
| D_VDD | 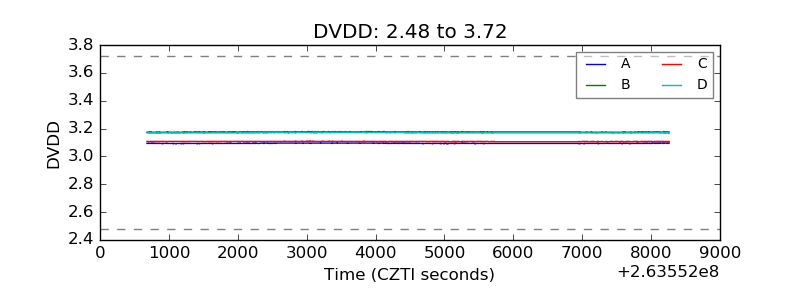 |
| Temperature 1 | 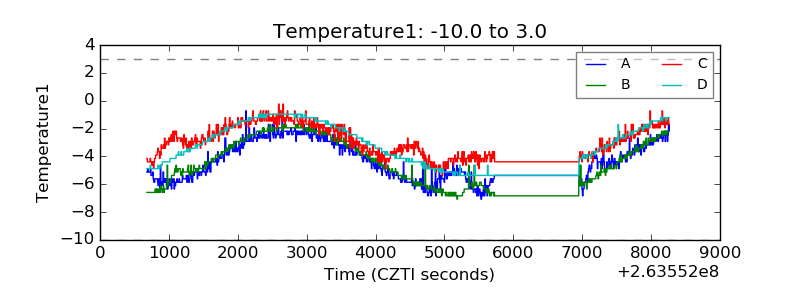 |
| Veto HV Monitor |  |
| Veto LLD |  |
| Alpha Counter |  |
| _CPM_Rate |  |
| CZT Counter | 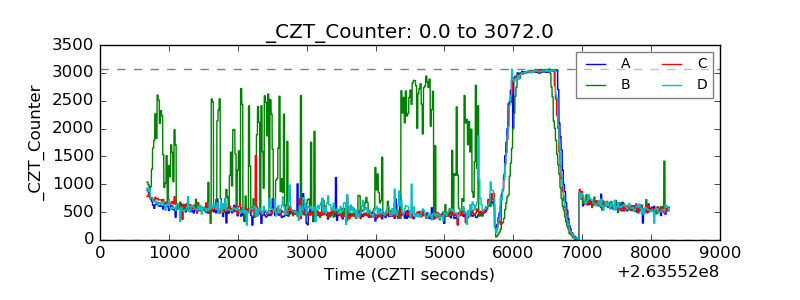 |
| +2.5 Volts monitor |  |
| +5 Volts monitor |  |
| _ROLL_ROT | 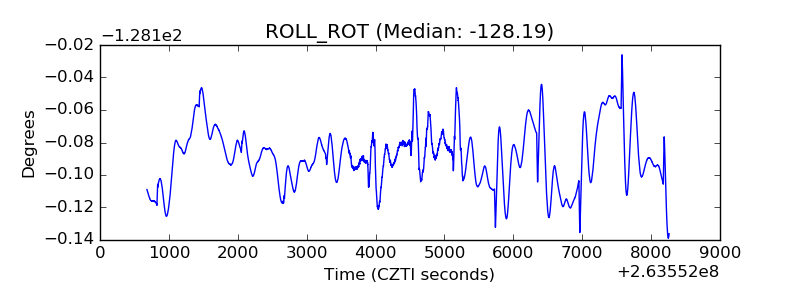 |
| _Roll_DEC | 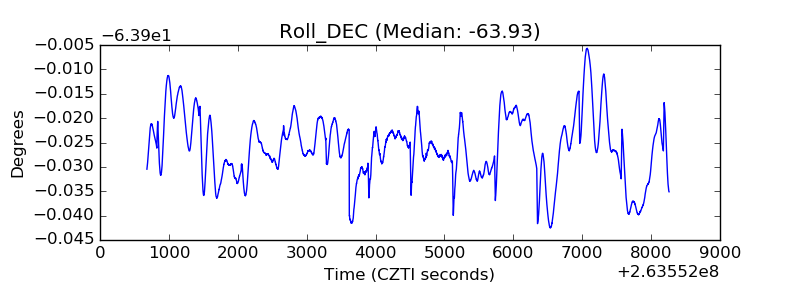 |
| _Roll_RA | 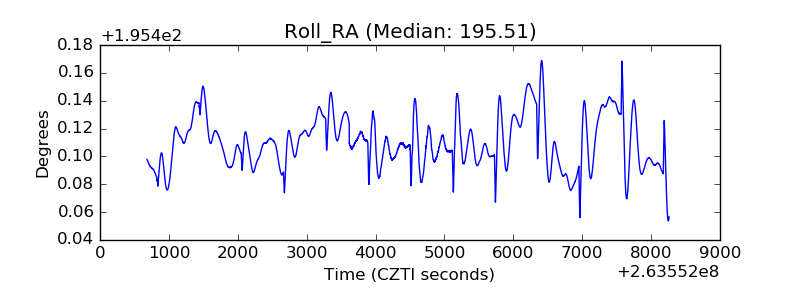 |
| Veto Counter | 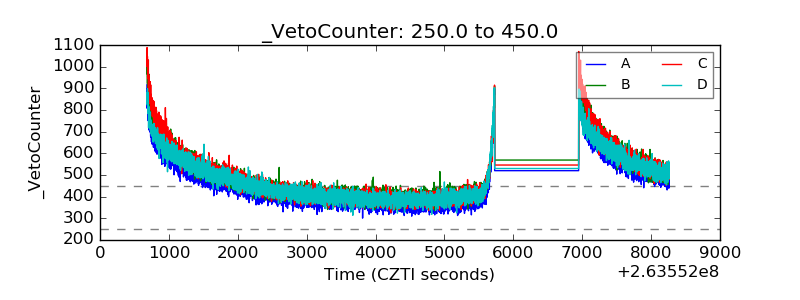 |