| Param | Original file | Final file |
|---|---|---|
| Filename | modeM0/AS1A04_149T01_9000002082_14127cztM0_level2.evt | modeM0/AS1A04_149T01_9000002082_14127cztM0_level2_quad_clean.evt |
| Size (bytes) | 482,932,800 | 128,088,000 |
| Size | 460.6 MB | 122.2 MB |
| Events in quadrant A | 3,014,947 | 889,102 |
| Events in quadrant B | 3,673,019 | 889,507 |
| Events in quadrant C | 3,020,610 | 861,447 |
| Events in quadrant D | 4,510,564 | 821,095 |
| Mode SS | |||
|---|---|---|---|
| Quadrant | BADHDUFLAG | Total packets | Discarded packets |
| A | 0 | 122 | 0 |
| B | 0 | 122 | 0 |
| C | 0 | 122 | 0 |
| D | 0 | 122 | 0 |
| Mode M0 | |||
|---|---|---|---|
| Quadrant | BADHDUFLAG | Total packets | Discarded packets |
| A | 0 | 12644 | 2 |
| B | 0 | 14831 | 1 |
| C | 0 | 12657 | 1 |
| D | 0 | 17357 | 1 |
| Mode M9 | |||
|---|---|---|---|
| Quadrant | BADHDUFLAG | Total packets | Discarded packets |
| A | 0 | 14 | 0 |
| B | 0 | 14 | 0 |
| C | 0 | 14 | 0 |
| D | 0 | 14 | 0 |
| Quadrant | Total seconds | Saturated seconds | Saturation percentage |
|---|---|---|---|
| A | 5995 | 79 | 1.317765% |
| B | 5995 | 224 | 3.736447% |
| C | 5995 | 66 | 1.100917% |
| D | 5995 | 313 | 5.221018% |
Noise dominated data is calculated using 1-second bins in cleaned event files. If a bin has >2000 counts, and if more than 50% of those come from <1% of pixels, then it is considered to be noise-dominated and hence unusable.
| Quadrant | # 1 sec bins | Bins with >0 counts | Bins with >2000 counts | High rate bins dominated by noise | Noise dominated (total time) | Noise dominated (detector-on time) | Marked lightcurve |
|---|---|---|---|---|---|---|---|
| A | 7321 | 5998 | 2 | 2 | 0.03% | 0.03% | 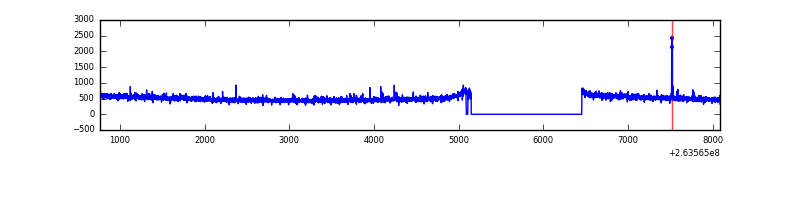 |
| B | 7321 | 5998 | 64 | 64 | 0.87% | 1.07% | 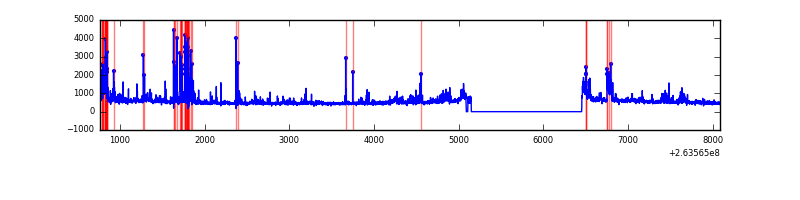 |
| C | 7321 | 5998 | 0 | 0 | 0.00% | 0.00% | 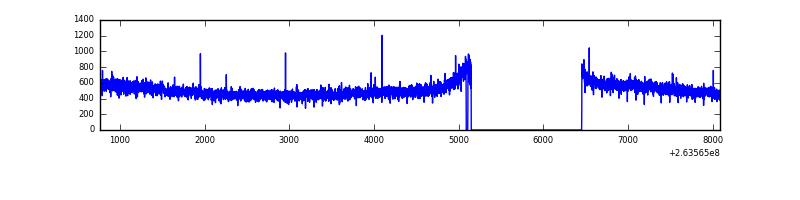 |
| D | 7321 | 5998 | 237 | 237 | 3.24% | 3.95% | 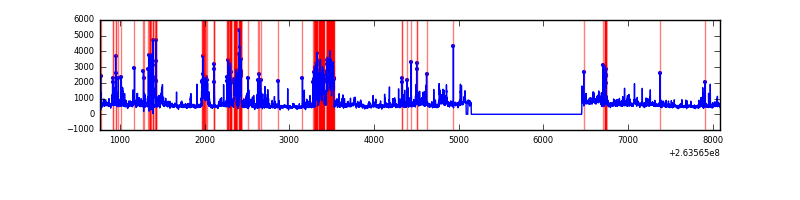 |
Top three noisy pixels from each quadrant. If the there are fewer than three noisy pixels in the level2.evt file, extra rows are filled as -1
| Pixel properties | Quadrant properties | ||||||
|---|---|---|---|---|---|---|---|
| Quadrant | DetID | PixID | Counts | Sigma | Mean | Median | Sigma |
| A | 12 | 189 | 38098 | 243.44 | 770 | 758 | 153.4 |
| A | 13 | 248 | 10470 | 63.32 | 770 | 758 | 153.4 |
| A | 0 | 226 | 6896 | 40.02 | 770 | 758 | 153.4 |
| B | 0 | 85 | 588138 | 4217.26 | 757 | 741 | 139.3 |
| B | 3 | 209 | 41034 | 289.28 | 757 | 741 | 139.3 |
| B | 0 | 189 | 38047 | 267.84 | 757 | 741 | 139.3 |
| C | 3 | 233 | 174087 | 1042.92 | 729 | 734 | 166.2 |
| C | 13 | 61 | 5296 | 27.45 | 729 | 734 | 166.2 |
| C | 0 | 207 | 2911 | 13.1 | 729 | 734 | 166.2 |
| D | 1 | 52 | 1101931 | 6485.49 | 722 | 704 | 169.8 |
| D | 10 | 157 | 233478 | 1370.88 | 722 | 704 | 169.8 |
| D | 8 | 195 | 203681 | 1195.4 | 722 | 704 | 169.8 |
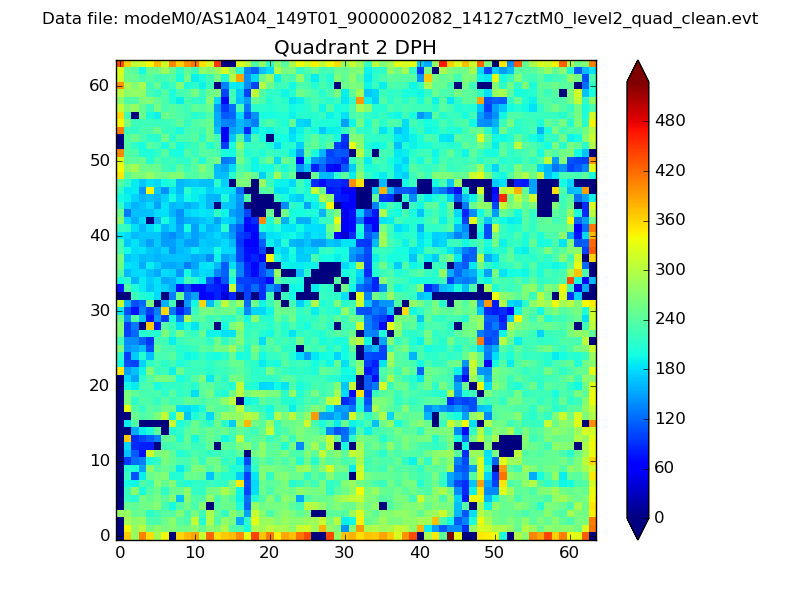
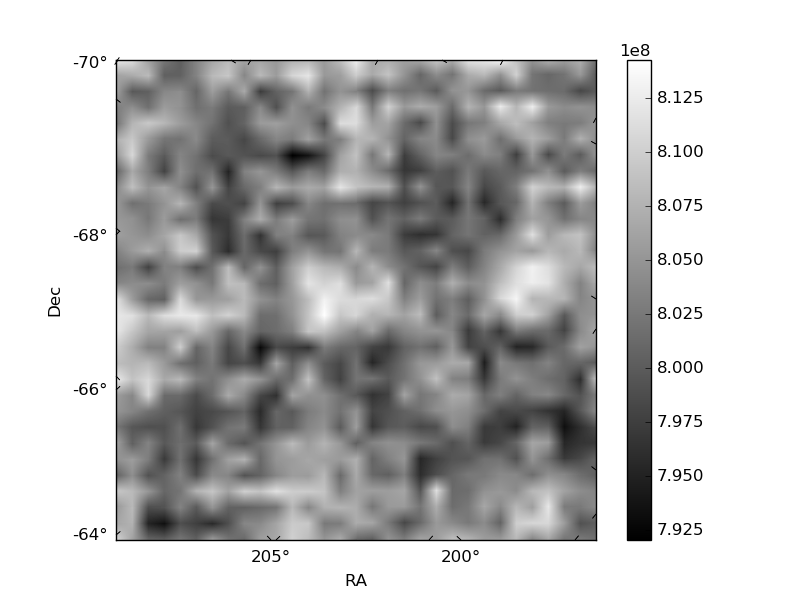
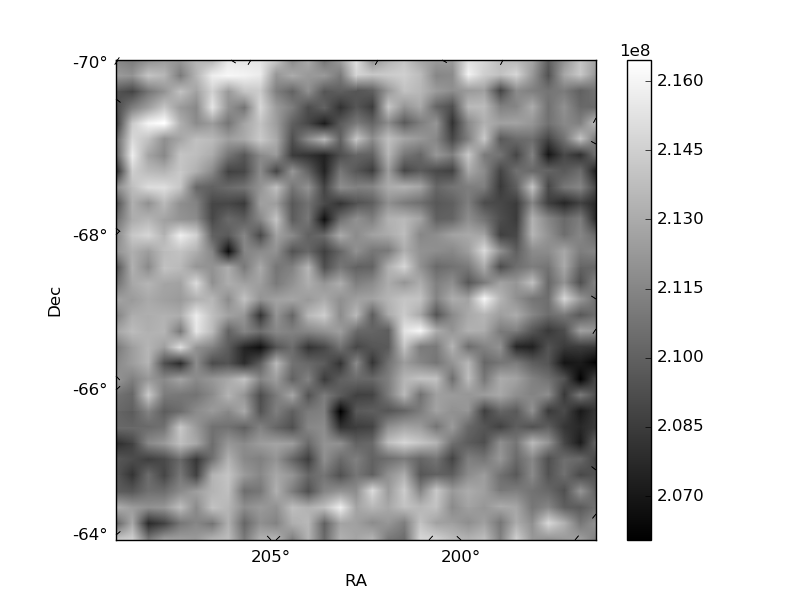
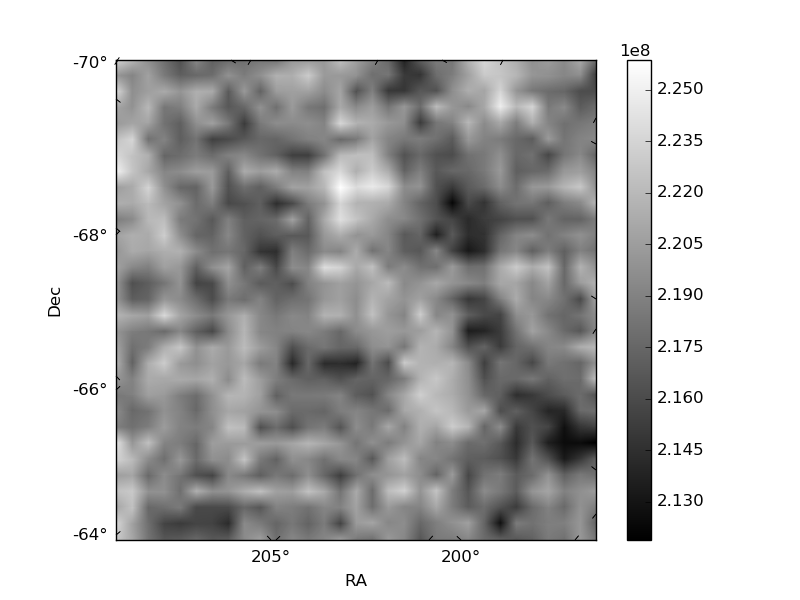
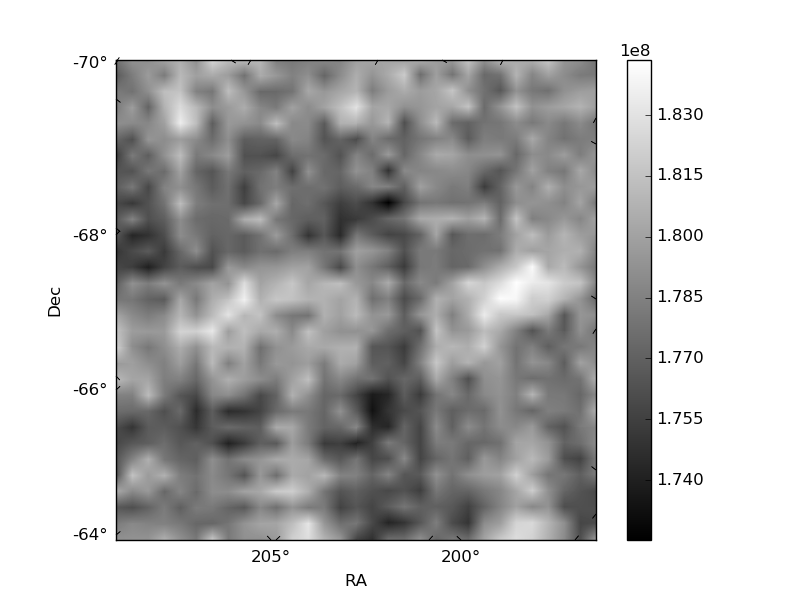
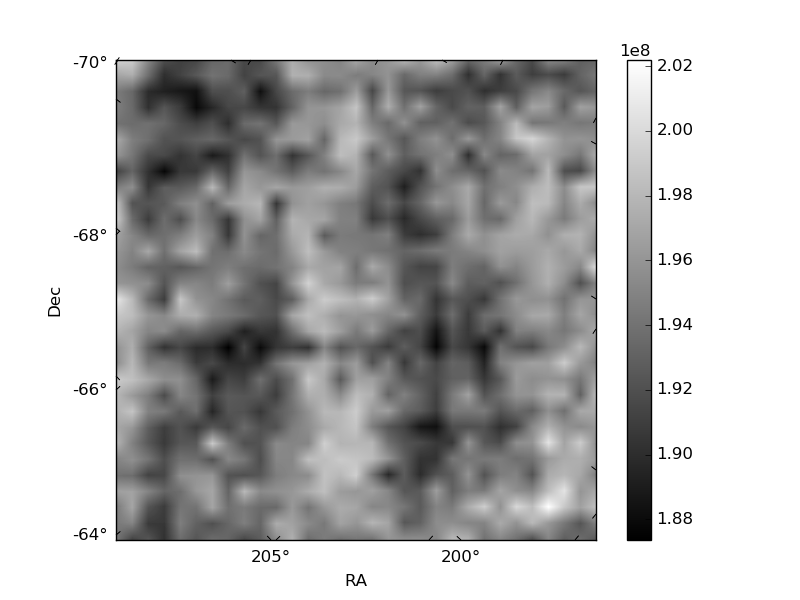
Histogram calculated using DETX and DETY for each event in the final _common_clean file
| Quadrant A | 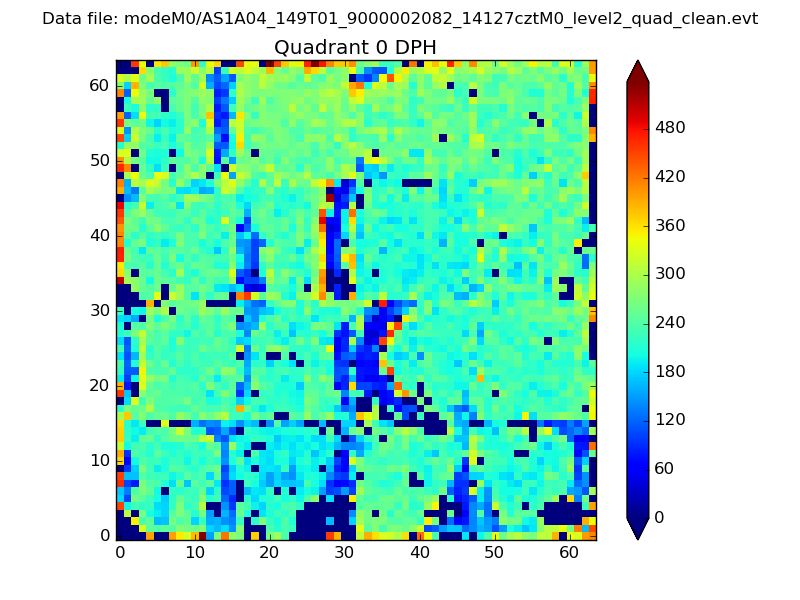 |
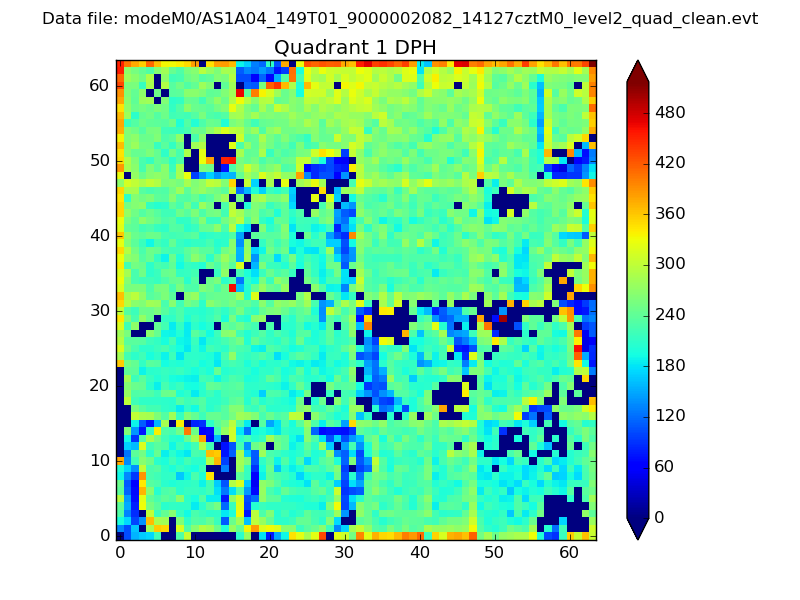 |
Quadrant B |
|---|---|---|---|
| Quadrant D | 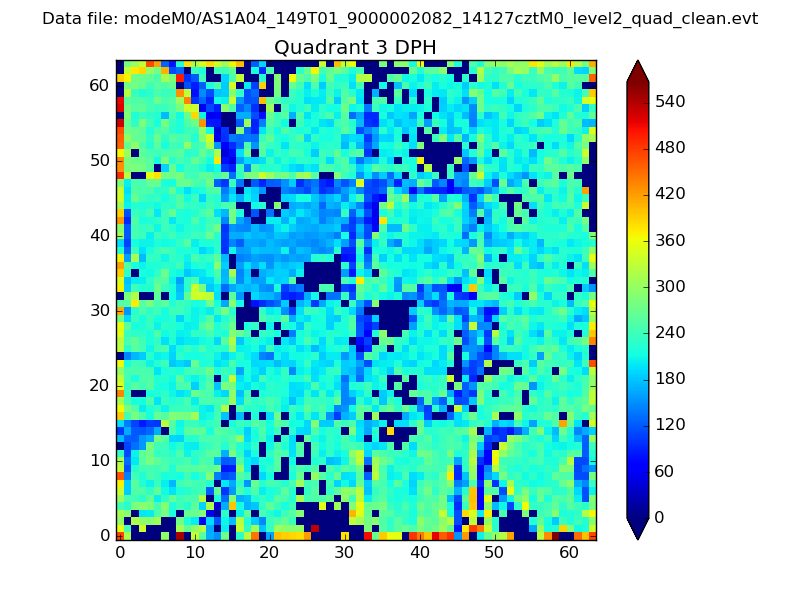 |
 |
Quadrant C |
| Plot type | Count rate plots | Images |
|---|---|---|
| Comparison with Poisson distribution Blue bars denote a histogram of data divided into 1 sec bins. Red curve is a Poisson curve with rate = median count rate of data. |
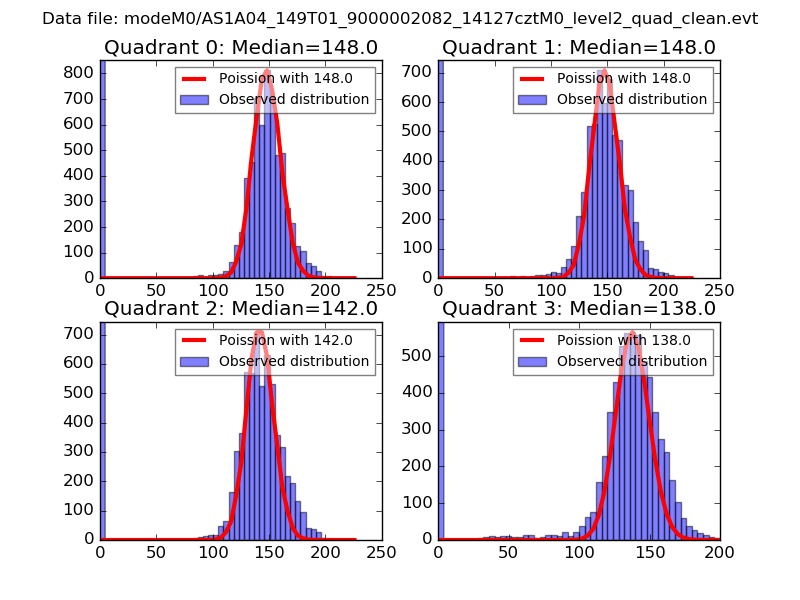 |
 |
| Quadrant-wise count rates Data is divided into 100 sec bins |
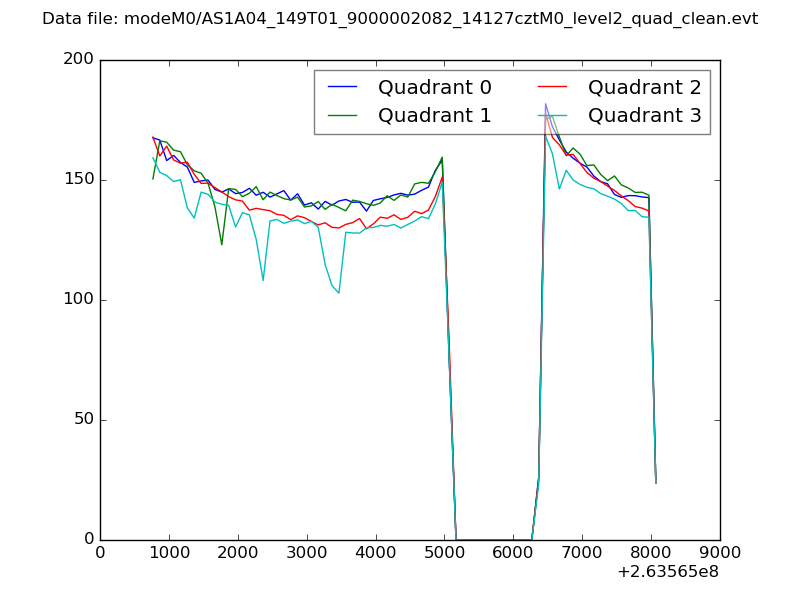 |
|
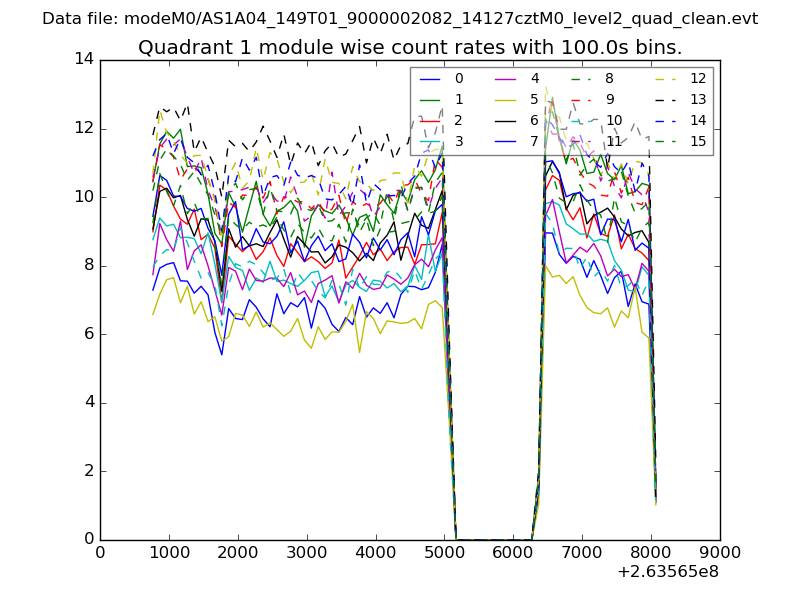
| Module-wise count rates for Quadrant A Data is divided into 100 sec bins |
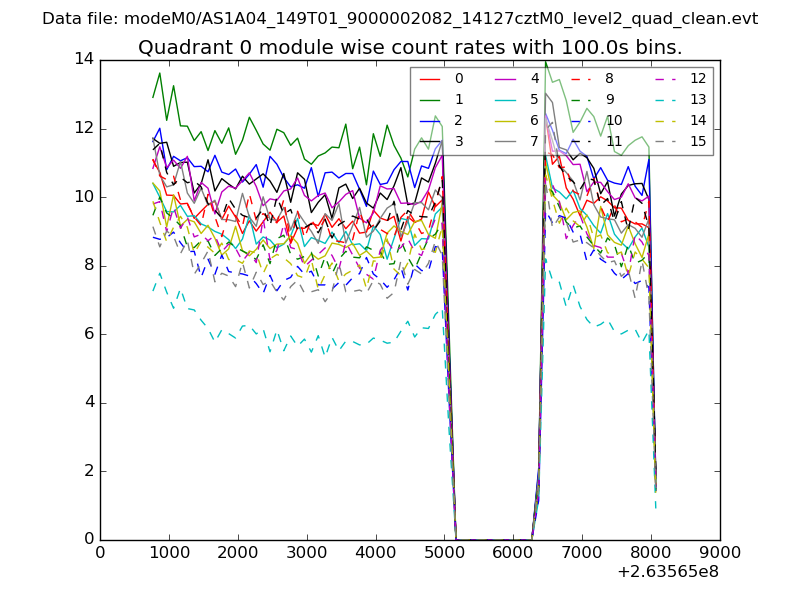 |
 |
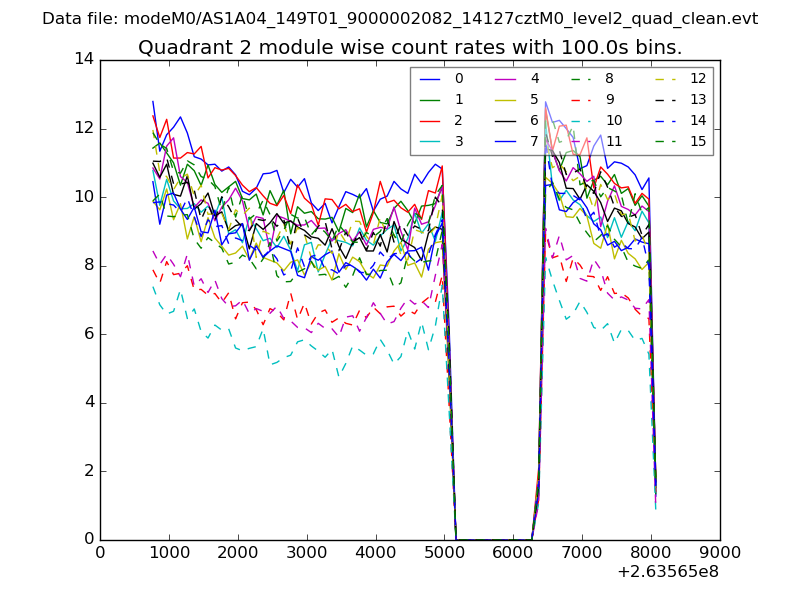
| Module-wise count rates for Quadrant B Data is divided into 100 sec bins |
 |
 |
| Module-wise count rates for Quadrant C Data is divided into 100 sec bins |
 |
 |
| Module-wise count rates for Quadrant D Data is divided into 100 sec bins |
 |
 |
| Parameter | Plot |
|---|---|
| CZT HV Monitor | 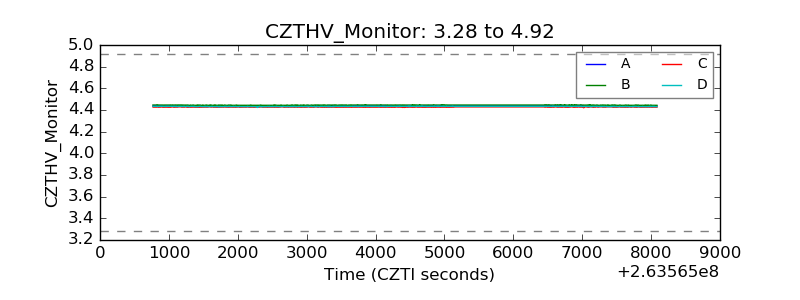 |
| D_VDD | 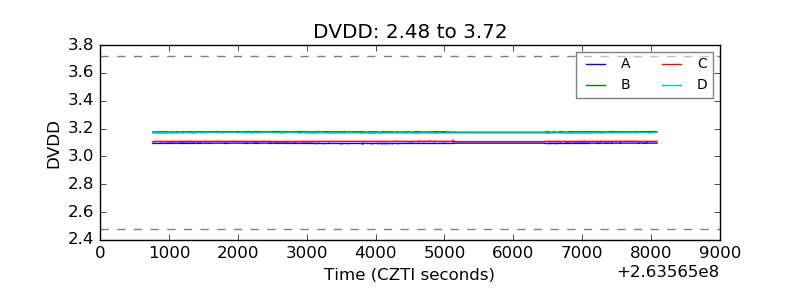 |
| Temperature 1 | 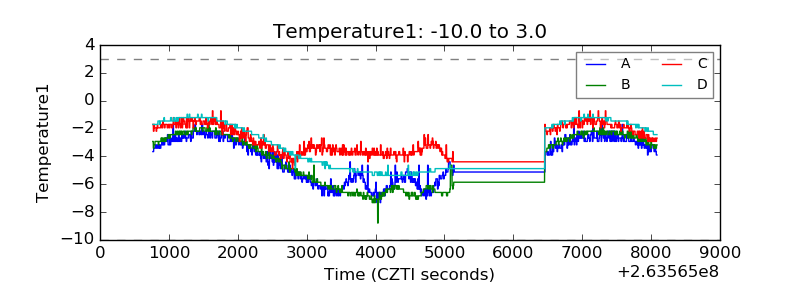 |
| Veto HV Monitor | 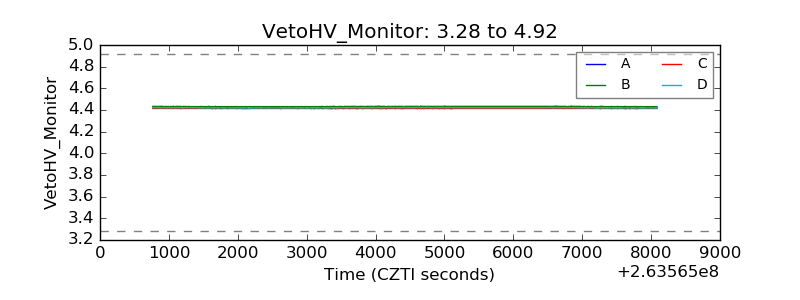 |
| Veto LLD | 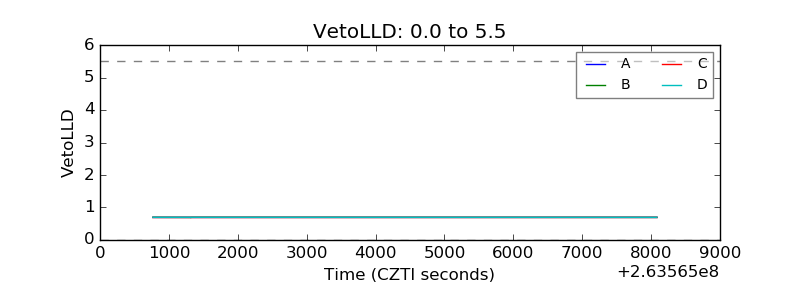 |
| Alpha Counter | 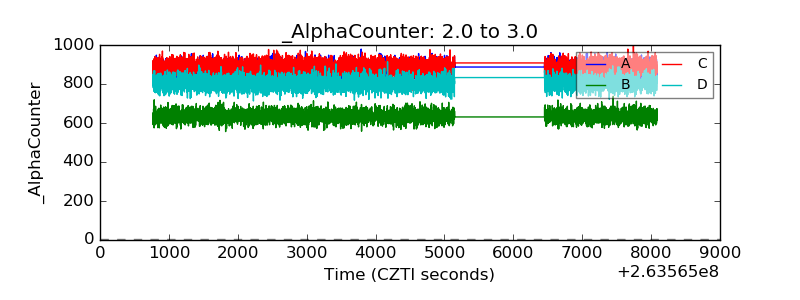 |
| _CPM_Rate | 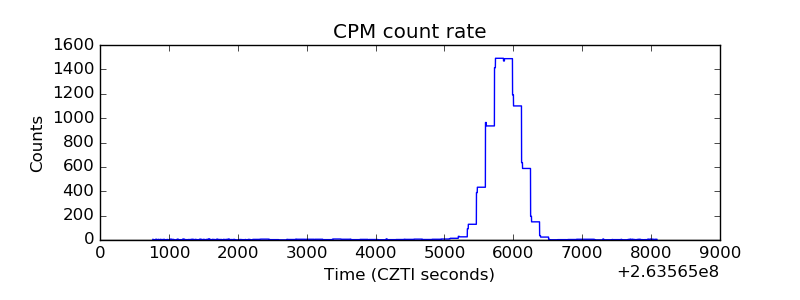 |
| CZT Counter | 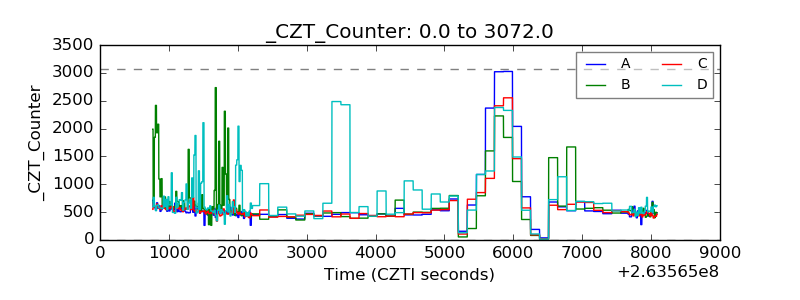 |
| +2.5 Volts monitor |  |
| +5 Volts monitor | 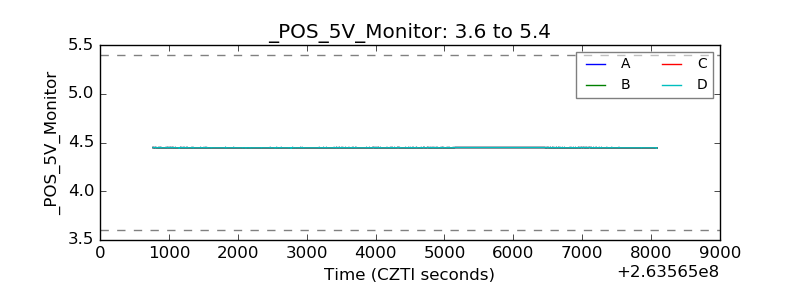 |
| _ROLL_ROT | 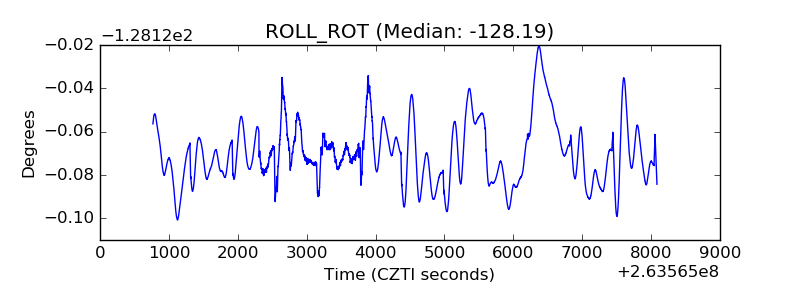 |
| _Roll_DEC | 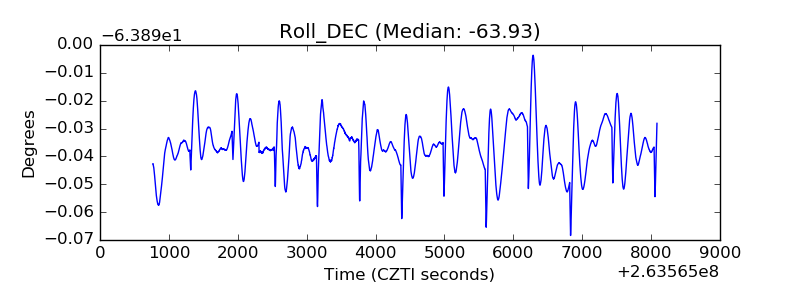 |
| _Roll_RA | 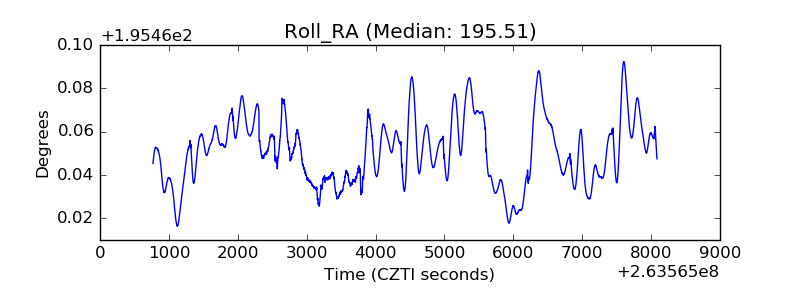 |
| Veto Counter | 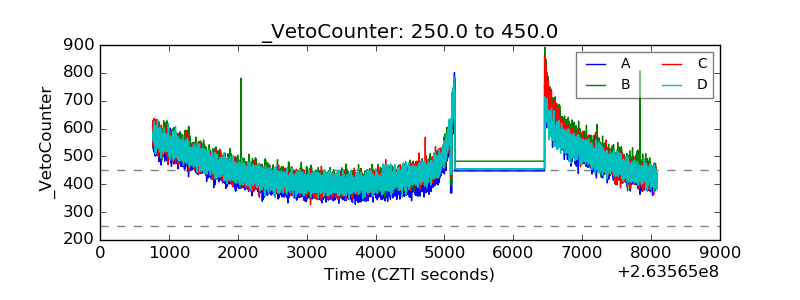 |