| Param | Original file | Final file |
|---|---|---|
| Filename | modeM0/AS1A04_149T01_9000002082_14128cztM0_level2.evt | modeM0/AS1A04_149T01_9000002082_14128cztM0_level2_quad_clean.evt |
| Size (bytes) | 101,545,920 | 27,892,800 |
| Size | 96.8 MB | 26.6 MB |
| Events in quadrant A | 650,154 | 190,358 |
| Events in quadrant B | 692,257 | 193,472 |
| Events in quadrant C | 641,591 | 186,229 |
| Events in quadrant D | 998,747 | 175,374 |
| Mode SS | |||
|---|---|---|---|
| Quadrant | BADHDUFLAG | Total packets | Discarded packets |
| A | 0 | 26 | 0 |
| B | 0 | 26 | 0 |
| C | 0 | 26 | 0 |
| D | 0 | 26 | 0 |
| Mode M0 | |||
|---|---|---|---|
| Quadrant | BADHDUFLAG | Total packets | Discarded packets |
| A | 0 | 2704 | 0 |
| B | 0 | 2857 | 0 |
| C | 0 | 2679 | 0 |
| D | 0 | 3773 | 0 |
| Quadrant | Total seconds | Saturated seconds | Saturation percentage |
|---|---|---|---|
| A | 1321 | 5 | 0.378501% |
| B | 1321 | 0 | 0.000000% |
| C | 1321 | 0 | 0.000000% |
| D | 1321 | 89 | 6.737320% |
Noise dominated data is calculated using 1-second bins in cleaned event files. If a bin has >2000 counts, and if more than 50% of those come from <1% of pixels, then it is considered to be noise-dominated and hence unusable.
| Quadrant | # 1 sec bins | Bins with >0 counts | Bins with >2000 counts | High rate bins dominated by noise | Noise dominated (total time) | Noise dominated (detector-on time) | Marked lightcurve |
|---|---|---|---|---|---|---|---|
| A | 1322 | 1322 | 2 | 2 | 0.15% | 0.15% | 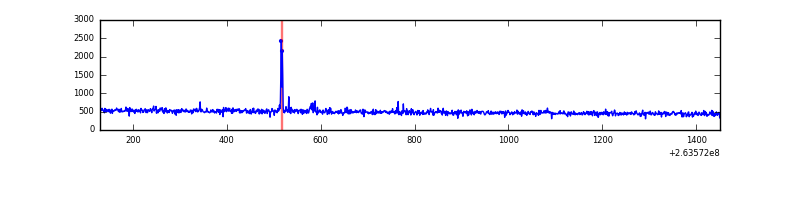 |
| B | 1322 | 1322 | 0 | 0 | 0.00% | 0.00% | 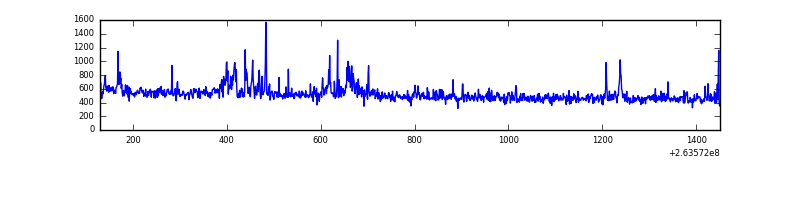 |
| C | 1322 | 1322 | 0 | 0 | 0.00% | 0.00% | 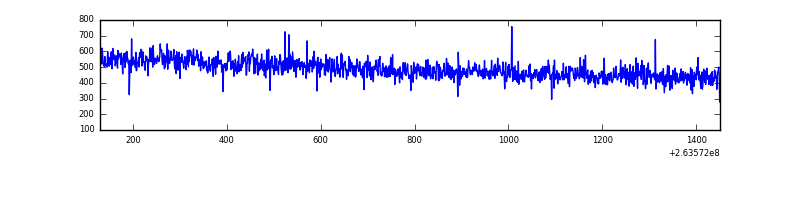 |
| D | 1322 | 1322 | 83 | 83 | 6.28% | 6.28% | 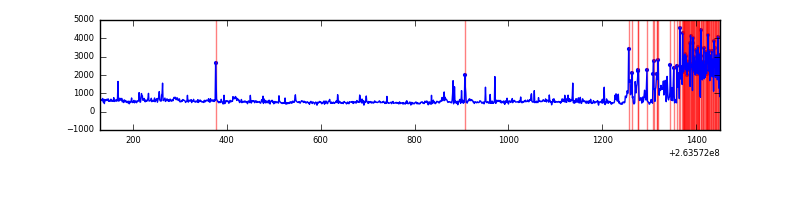 |
Top three noisy pixels from each quadrant. If the there are fewer than three noisy pixels in the level2.evt file, extra rows are filled as -1
| Pixel properties | Quadrant properties | ||||||
|---|---|---|---|---|---|---|---|
| Quadrant | DetID | PixID | Counts | Sigma | Mean | Median | Sigma |
| A | 13 | 248 | 9989 | 280.57 | 165 | 162 | 35.0 |
| A | 0 | 226 | 1548 | 39.57 | 165 | 162 | 35.0 |
| A | 12 | 194 | 1313 | 32.86 | 165 | 162 | 35.0 |
| B | 0 | 85 | 27672 | 848.14 | 162 | 159 | 32.4 |
| B | 3 | 209 | 14569 | 444.22 | 162 | 159 | 32.4 |
| B | 4 | 142 | 6377 | 191.68 | 162 | 159 | 32.4 |
| C | 3 | 233 | 43922 | 1193.52 | 153 | 153 | 36.7 |
| C | 13 | 61 | 1105 | 25.96 | 153 | 153 | 36.7 |
| C | 3 | 202 | 372 | 5.97 | 153 | 153 | 36.7 |
| D | 1 | 52 | 328564 | 8407.85 | 151 | 147 | 39.1 |
| D | 8 | 195 | 68211 | 1742.52 | 151 | 147 | 39.1 |
| D | 2 | 14 | 12075 | 305.37 | 151 | 147 | 39.1 |
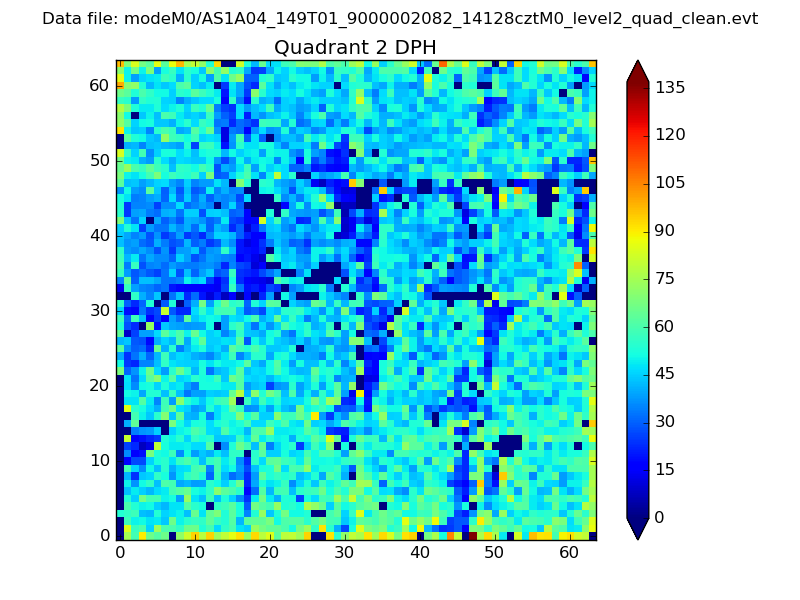
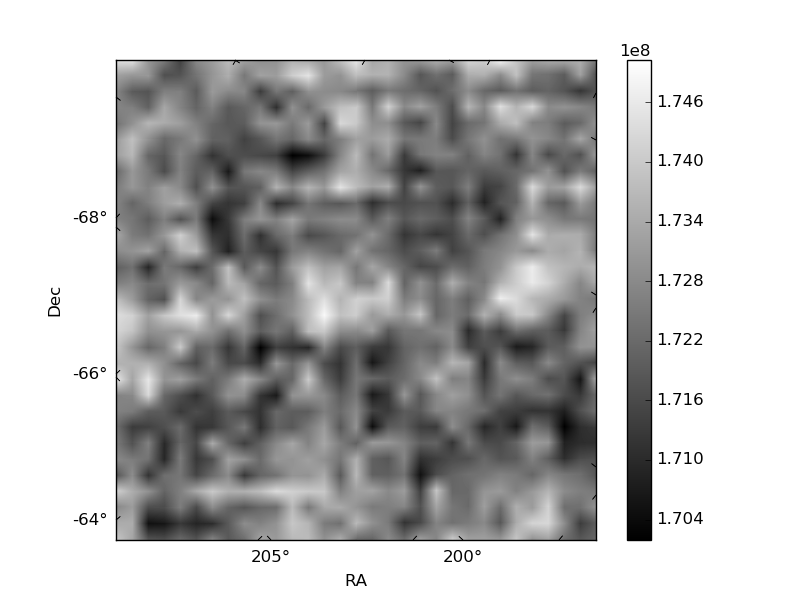
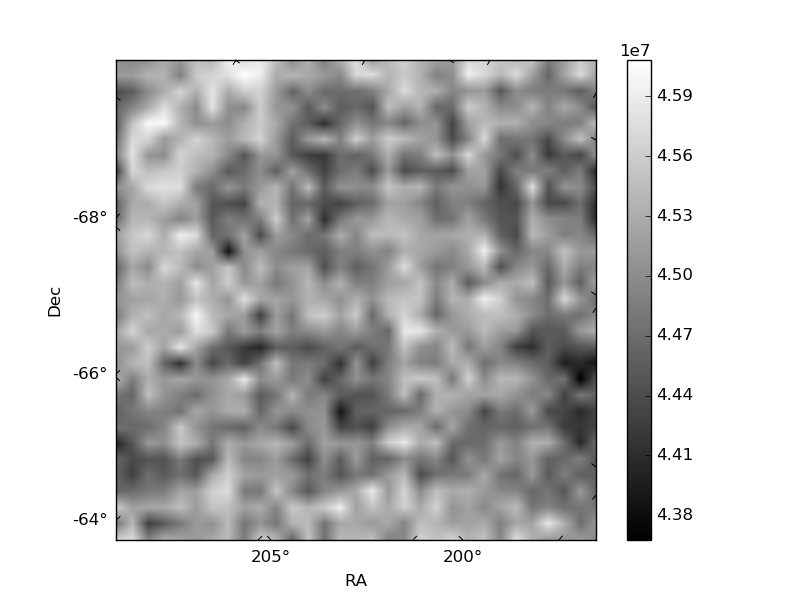
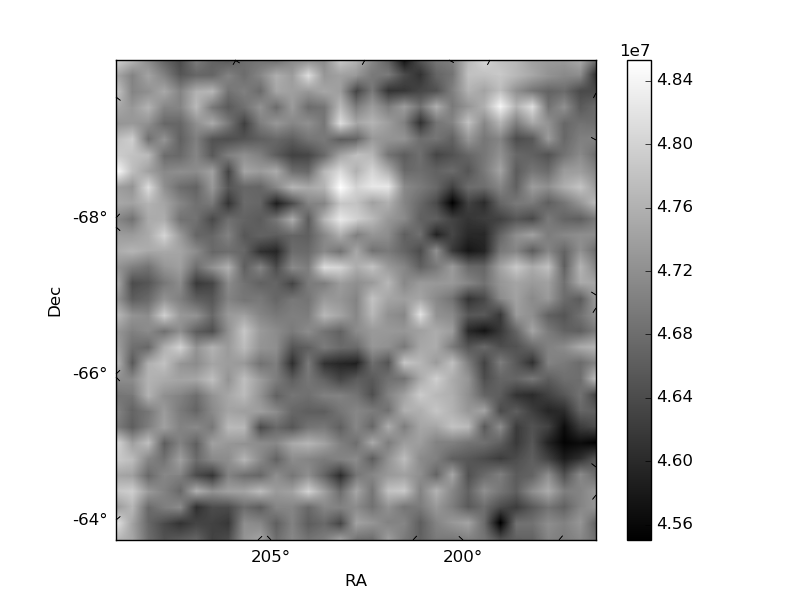
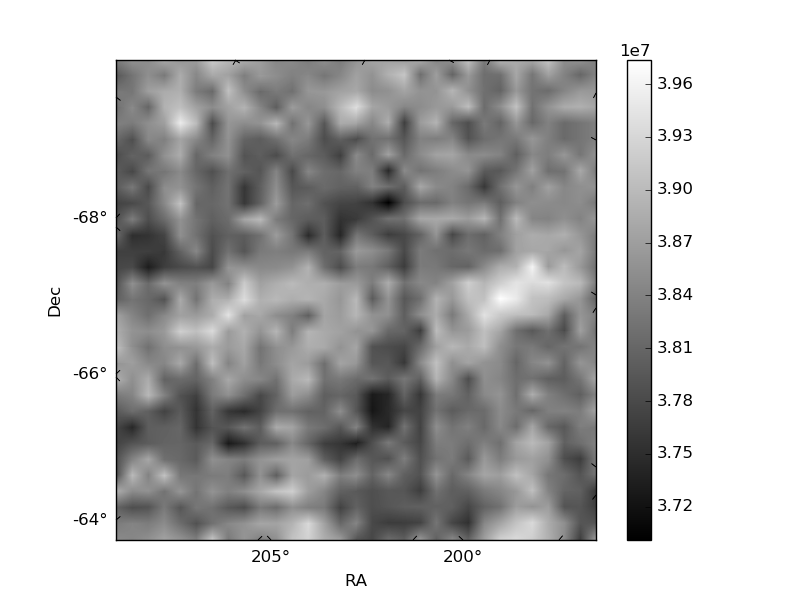
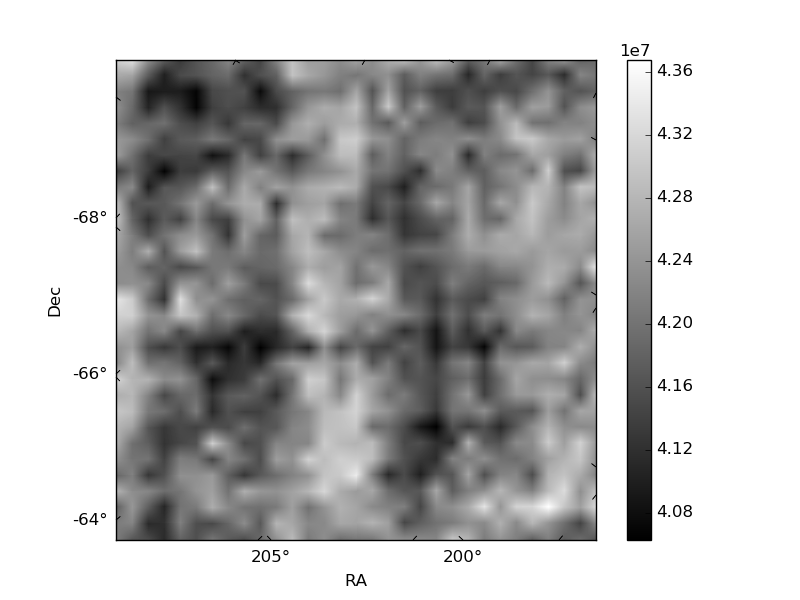
Histogram calculated using DETX and DETY for each event in the final _common_clean file
| Quadrant A | 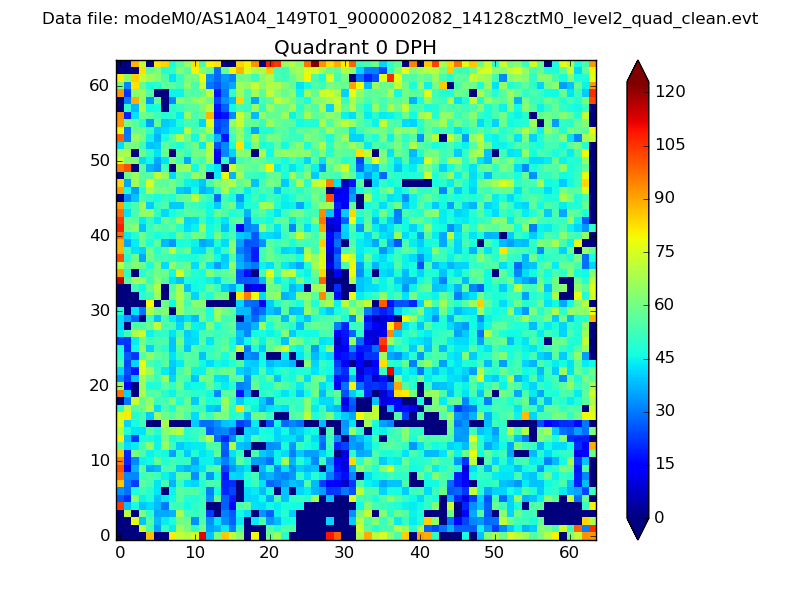 |
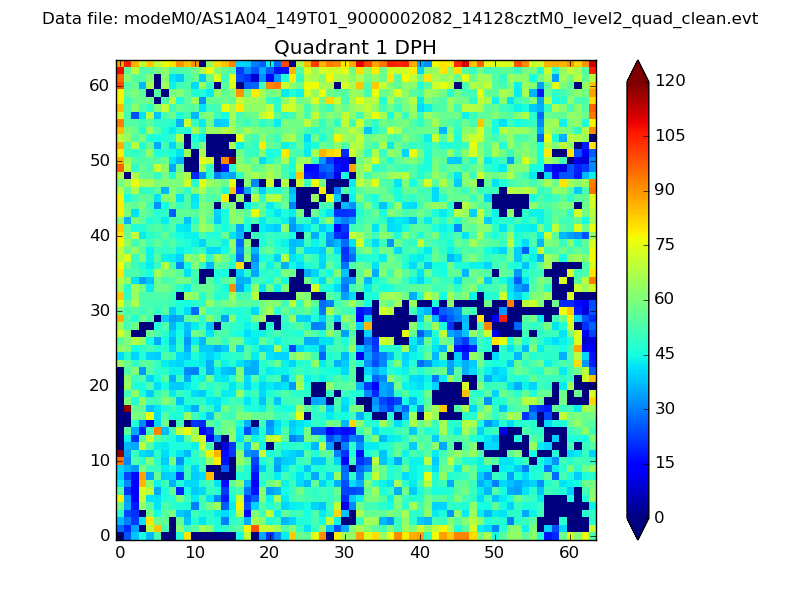 |
Quadrant B |
|---|---|---|---|
| Quadrant D | 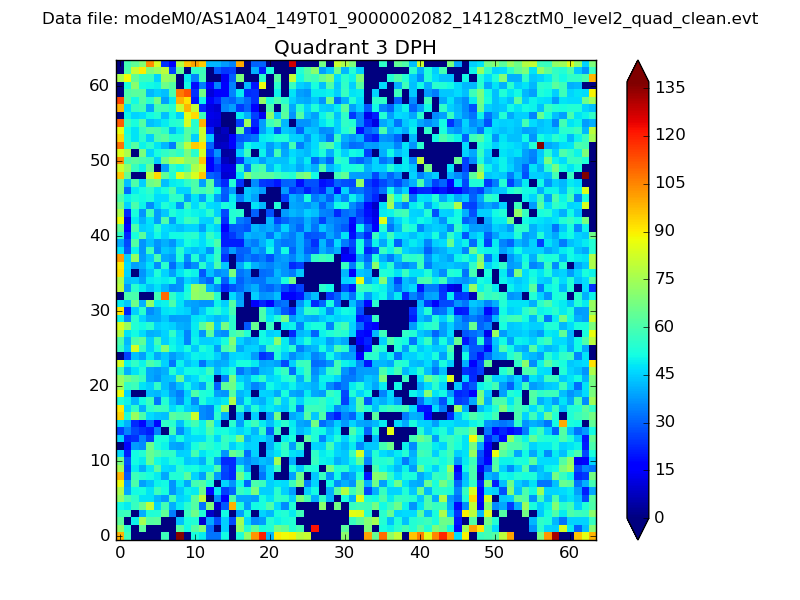 |
 |
Quadrant C |
| Plot type | Count rate plots | Images |
|---|---|---|
| Comparison with Poisson distribution Blue bars denote a histogram of data divided into 1 sec bins. Red curve is a Poisson curve with rate = median count rate of data. |
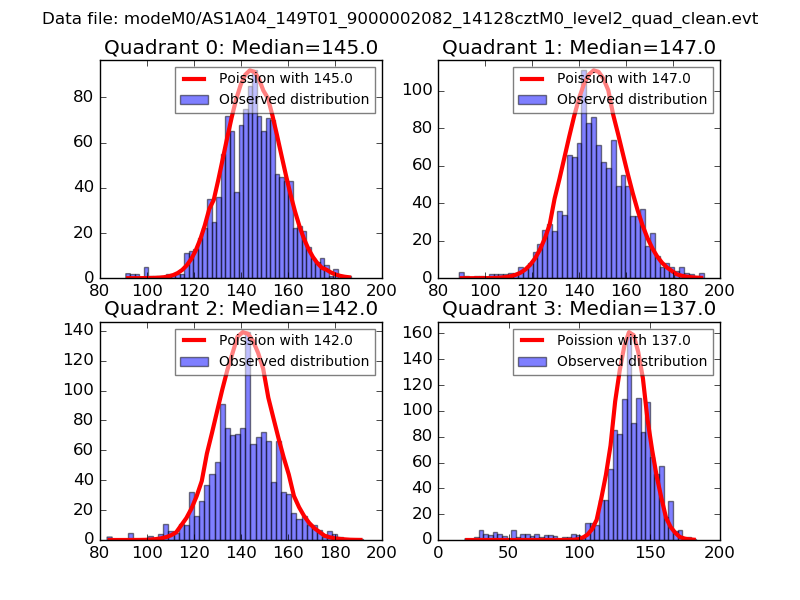 |
 |
| Quadrant-wise count rates Data is divided into 100 sec bins |
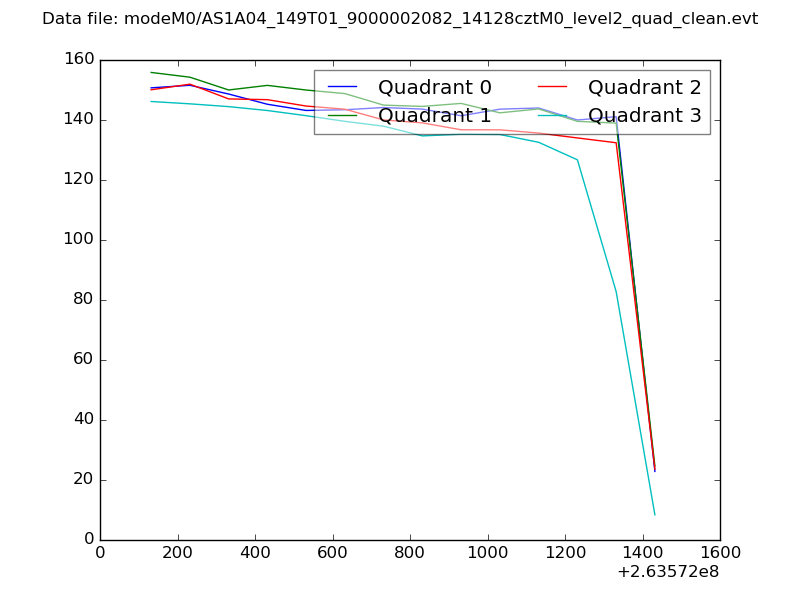 |
|
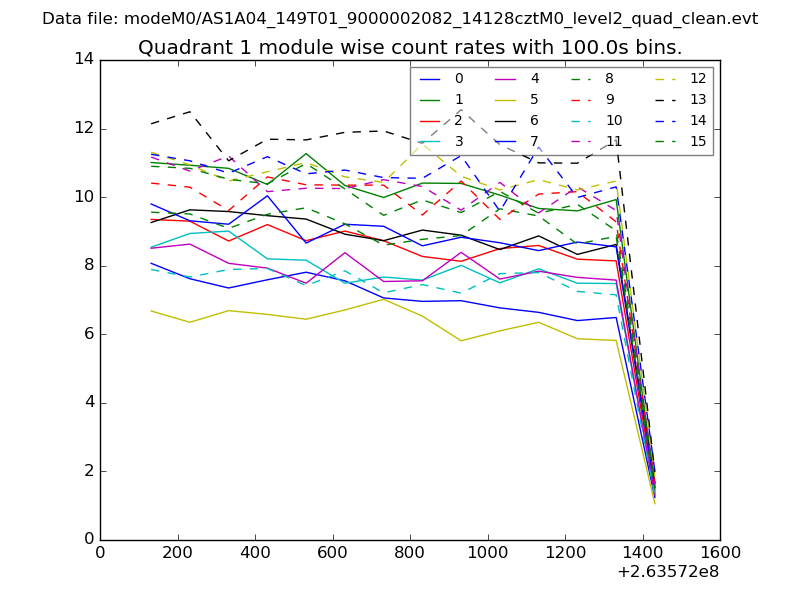
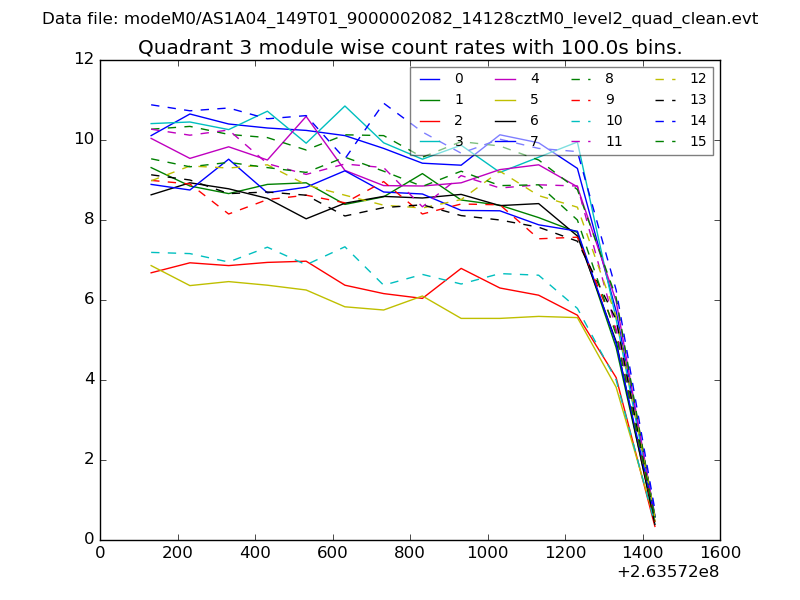
| Module-wise count rates for Quadrant A Data is divided into 100 sec bins |
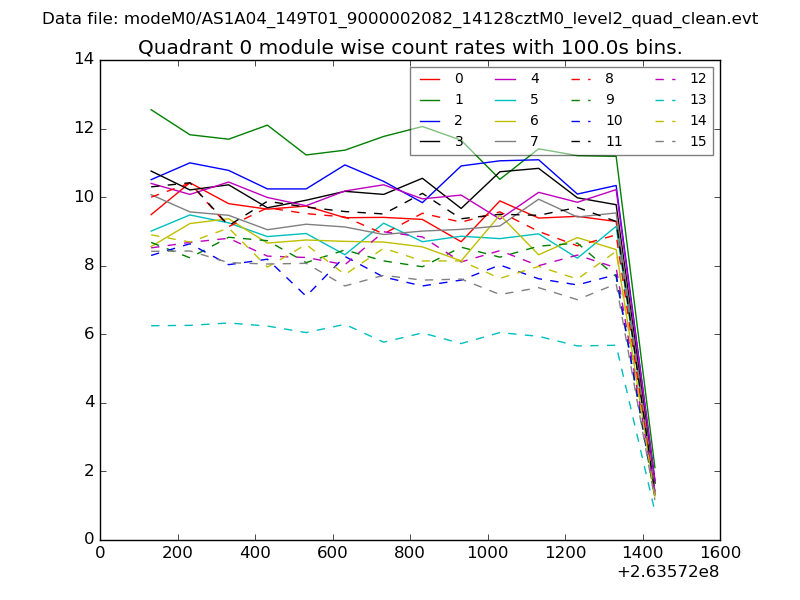 |
 |
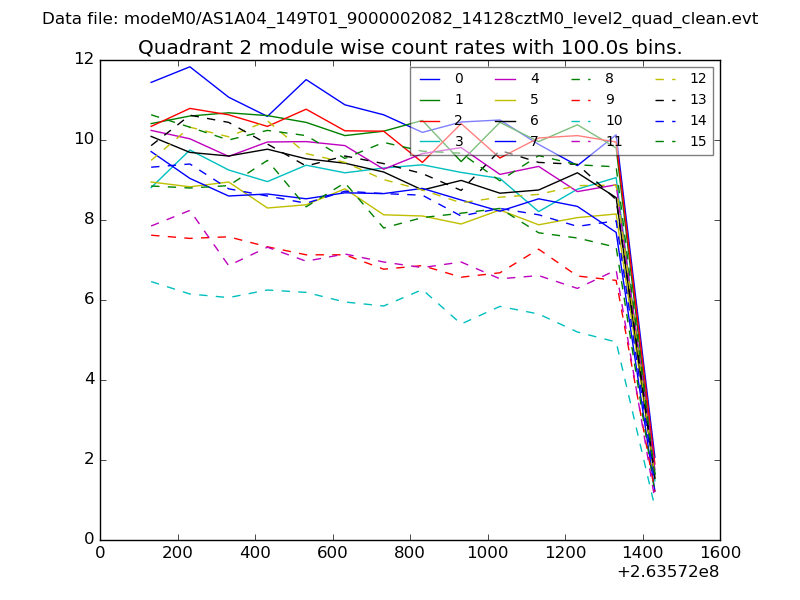
| Module-wise count rates for Quadrant B Data is divided into 100 sec bins |
 |
 |
| Module-wise count rates for Quadrant C Data is divided into 100 sec bins |
 |
 |
| Module-wise count rates for Quadrant D Data is divided into 100 sec bins |
 |
 |
| Parameter | Plot |
|---|---|
| CZT HV Monitor | 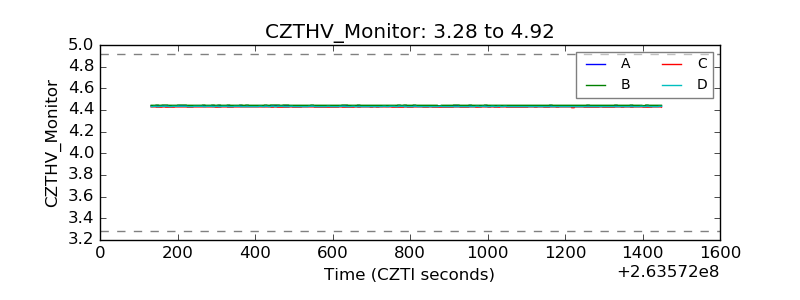 |
| D_VDD | 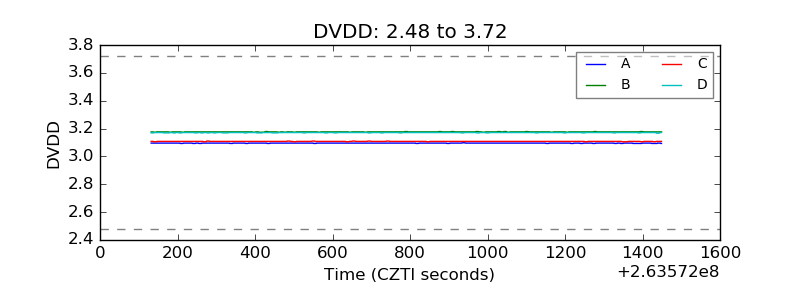 |
| Temperature 1 | 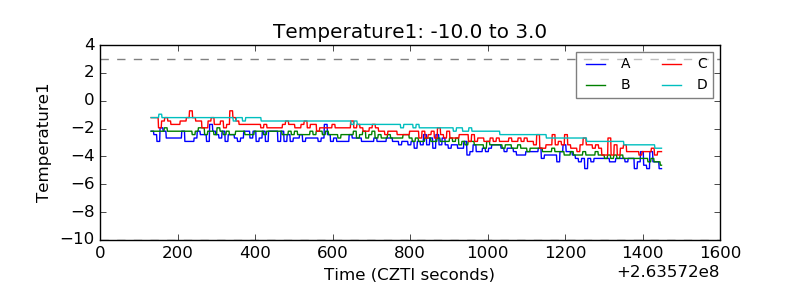 |
| Veto HV Monitor |  |
| Veto LLD | 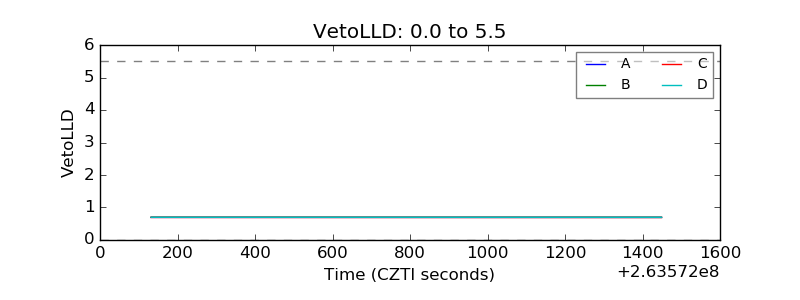 |
| Alpha Counter | 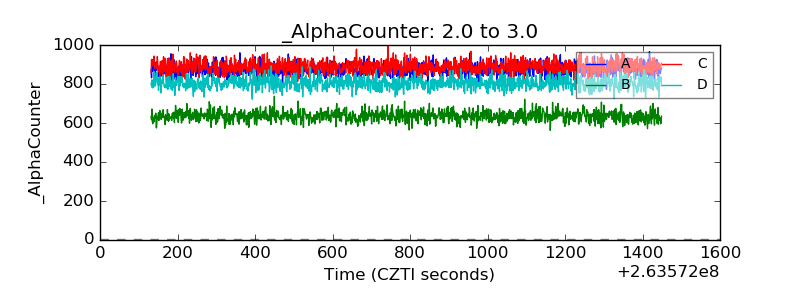 |
| _CPM_Rate | 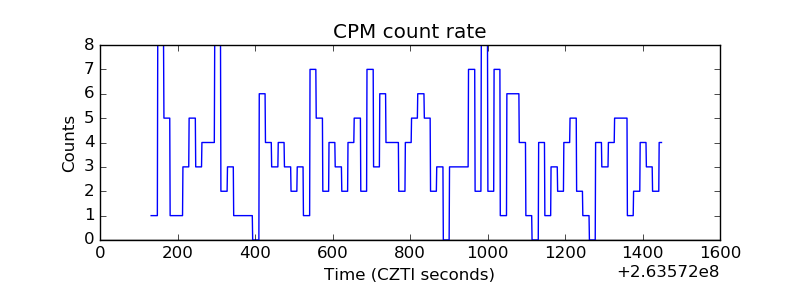 |
| CZT Counter | 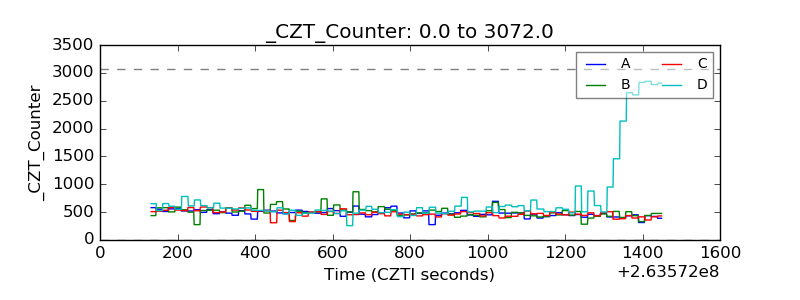 |
| +2.5 Volts monitor | 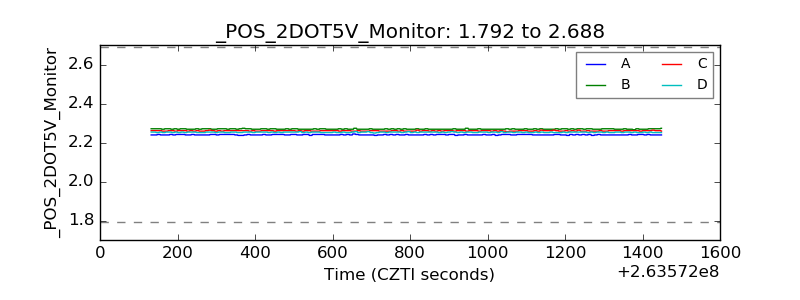 |
| +5 Volts monitor |  |
| _ROLL_ROT | 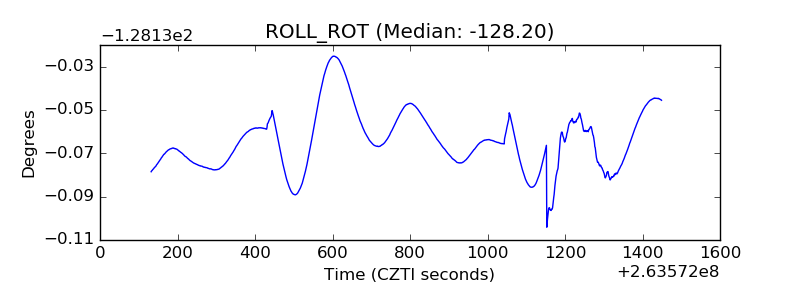 |
| _Roll_DEC | 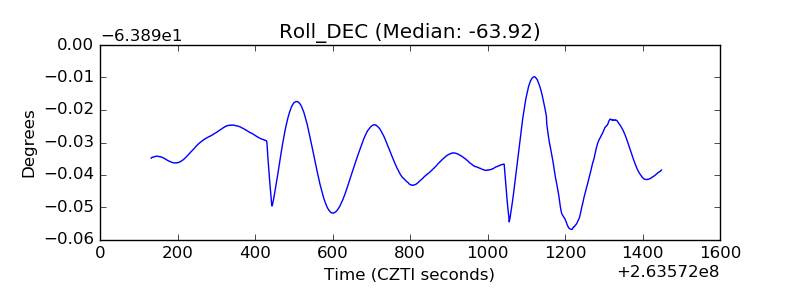 |
| _Roll_RA | 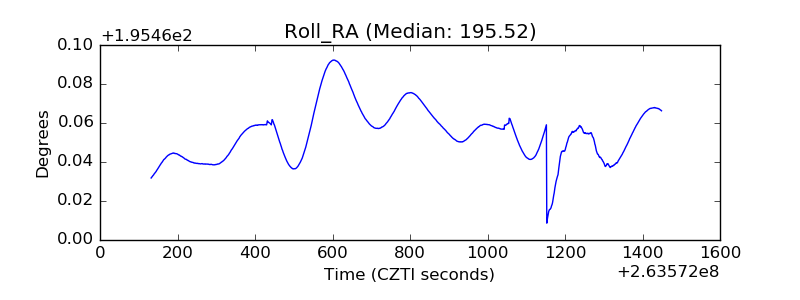 |
| Veto Counter | 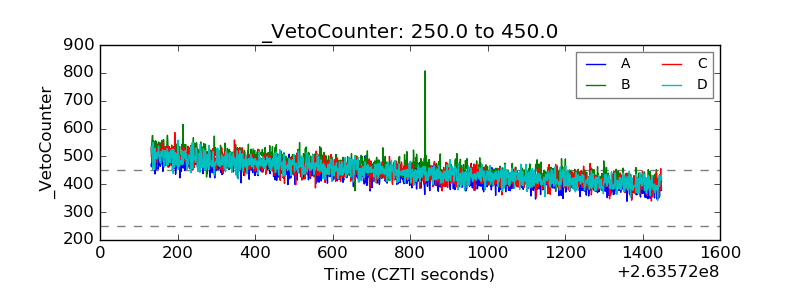 |