| Param | Original file | Final file |
|---|---|---|
| Filename | modeM0/AS1G08_028T01_9000002080cztM0_level2.fits | modeM0/AS1G08_028T01_9000002080cztM0_level2_quad_clean.evt |
| Size (bytes) | 382,936,320 | 306,999,360 |
| Size | 365.2 MB | 292.8 MB |
| Events in quadrant A | 2,402,702 | 1,780,515 |
| Events in quadrant B | 2,276,566 | 1,749,579 |
| Events in quadrant C | 2,340,382 | 1,674,858 |
| Events in quadrant D | 2,043,556 | 1,556,637 |
| Mode M0 | |||
|---|---|---|---|
| Quadrant | BADHDUFLAG | Total packets | Discarded packets |
| A | 0 | 78116 | 0 |
| B | 0 | 82579 | 0 |
| C | 0 | 78195 | 0 |
| D | 0 | 87585 | 0 |
| Mode M9 | |||
|---|---|---|---|
| Quadrant | BADHDUFLAG | Total packets | Discarded packets |
| A | 0 | 85 | 0 |
| B | 0 | 85 | 0 |
| C | 0 | 85 | 0 |
| D | 0 | 85 | 0 |
| Mode SS | |||
|---|---|---|---|
| Quadrant | BADHDUFLAG | Total packets | Discarded packets |
| A | 0 | 750 | 0 |
| B | 0 | 750 | 0 |
| C | 0 | 750 | 0 |
| D | 0 | 750 | 0 |
| Quadrant | Total seconds | Saturated seconds | Saturation percentage |
|---|---|---|---|
| A | 36913 | 449 | 1.216374% |
| B | 36913 | 679 | 1.839460% |
| C | 36913 | 316 | 0.856067% |
| D | 36913 | 765 | 2.072441% |
Noise dominated data is calculated using 1-second bins in cleaned event files. If a bin has >2000 counts, and if more than 50% of those come from <1% of pixels, then it is considered to be noise-dominated and hence unusable.
| Quadrant | # 1 sec bins | Bins with >0 counts | Bins with >2000 counts | High rate bins dominated by noise | Noise dominated (total time) | Noise dominated (detector-on time) | Marked lightcurve |
|---|---|---|---|---|---|---|---|
| A | 45177 | 36912 | 0 | 0 | 0.00% | 0.00% | 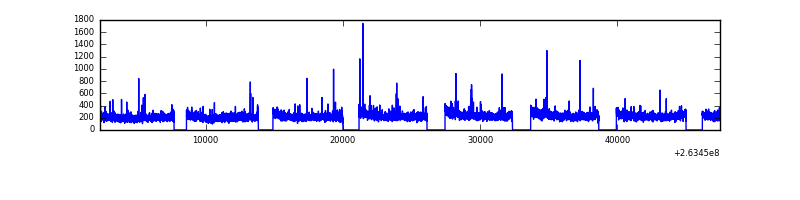 |
| B | 45177 | 36912 | 0 | 0 | 0.00% | 0.00% | 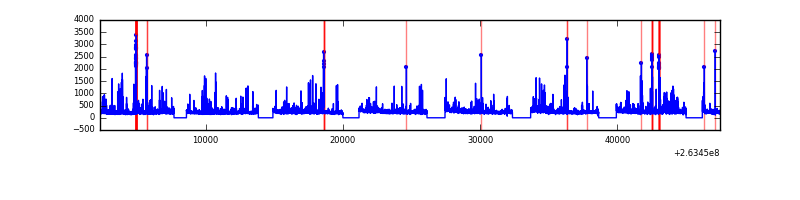 |
| C | 45177 | 36912 | 0 | 0 | 0.00% | 0.00% | 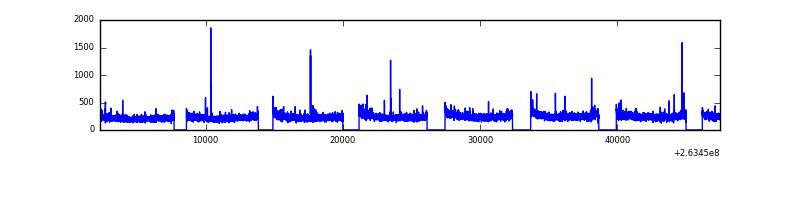 |
| D | 45177 | 36901 | 0 | 0 | 0.00% | 0.00% | 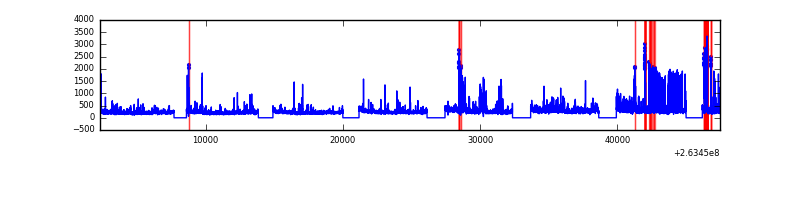 |
Top three noisy pixels from each quadrant. If the there are fewer than three noisy pixels in the level2.evt file, extra rows are filled as -1
| Pixel properties | Quadrant properties | ||||||
|---|---|---|---|---|---|---|---|
| Quadrant | DetID | PixID | Counts | Sigma | Mean | Median | Sigma |
| A | 0 | 29 | 2259 | 10.99 | 625 | 588 | 152.1 |
| A | 7 | 110 | 1898 | 8.61 | 625 | 588 | 152.1 |
| A | 9 | 19 | 1722 | 7.46 | 625 | 588 | 152.1 |
| B | 2 | 9 | 1923 | 11.42 | 601 | 576 | 117.9 |
| B | 5 | 128 | 1496 | 7.8 | 601 | 576 | 117.9 |
| B | 3 | 17 | 1491 | 7.76 | 601 | 576 | 117.9 |
| C | 1 | 80 | 1764 | 7.35 | 618 | 579 | 161.2 |
| C | 1 | 81 | 1698 | 6.94 | 618 | 579 | 161.2 |
| C | 12 | 241 | 1621 | 6.46 | 618 | 579 | 161.2 |
| D | 3 | 14 | 1467 | 6.0 | 583 | 533 | 155.7 |
| D | 6 | 231 | 1463 | 5.97 | 583 | 533 | 155.7 |
| D | 7 | 5 | 1404 | 5.59 | 583 | 533 | 155.7 |
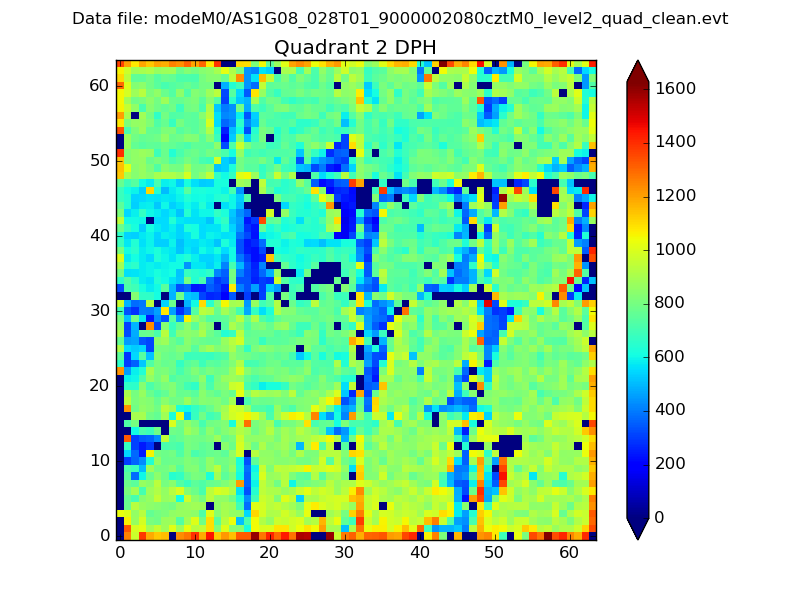
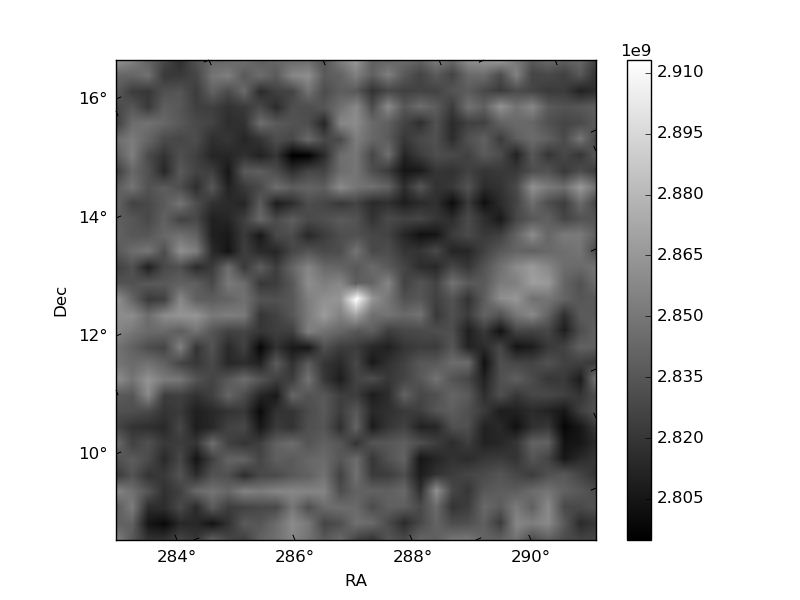
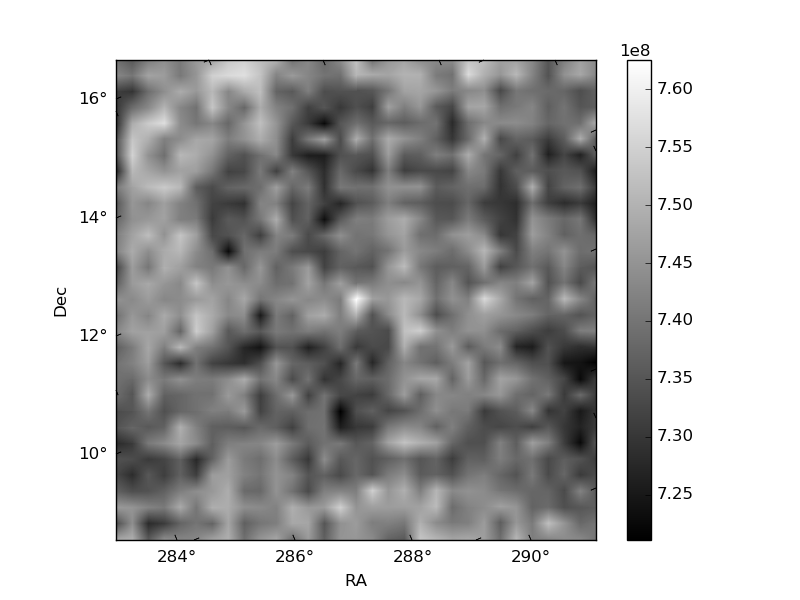
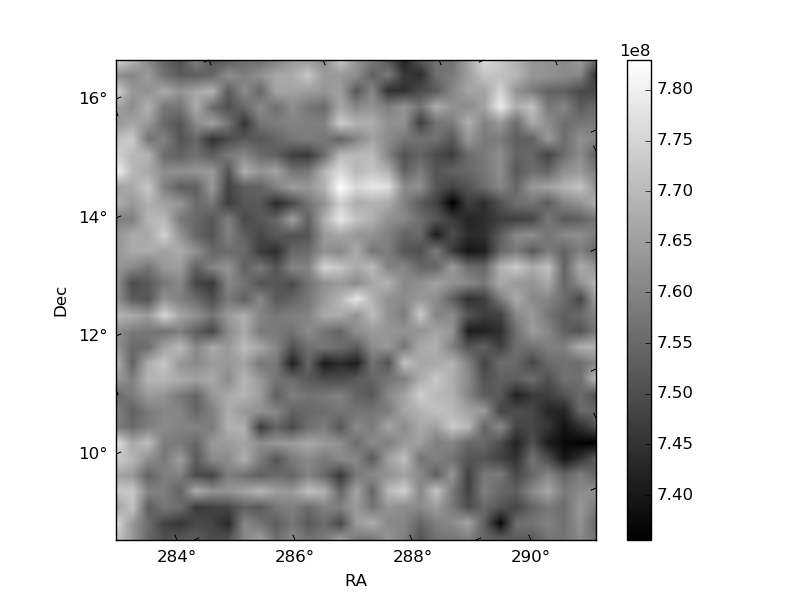
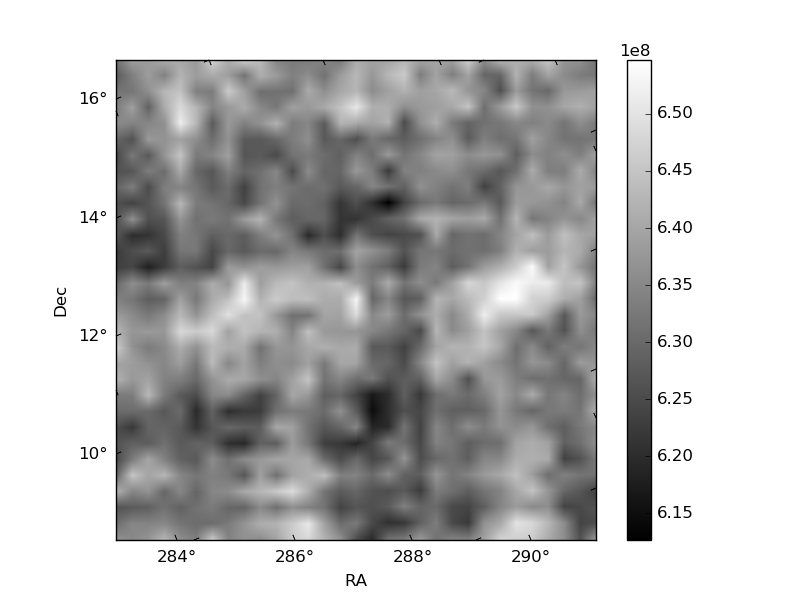
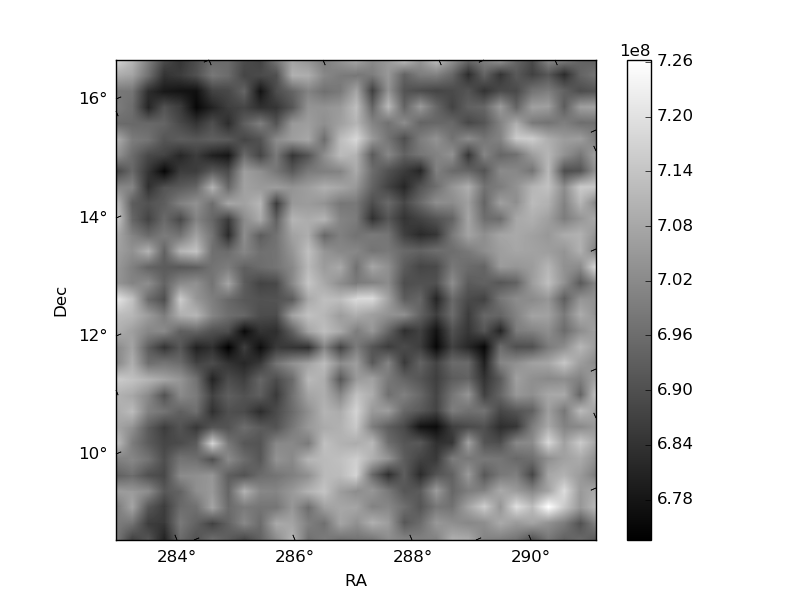
Histogram calculated using DETX and DETY for each event in the final _common_clean file
| Quadrant A | 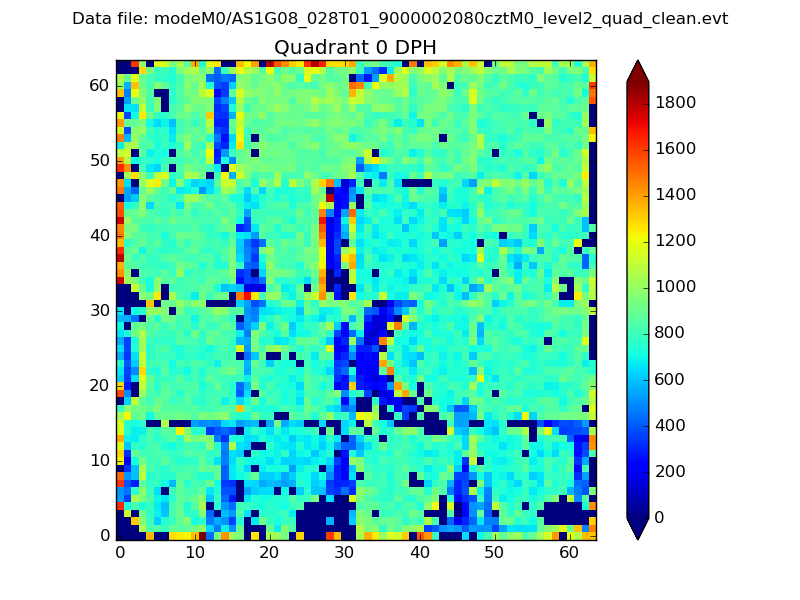 |
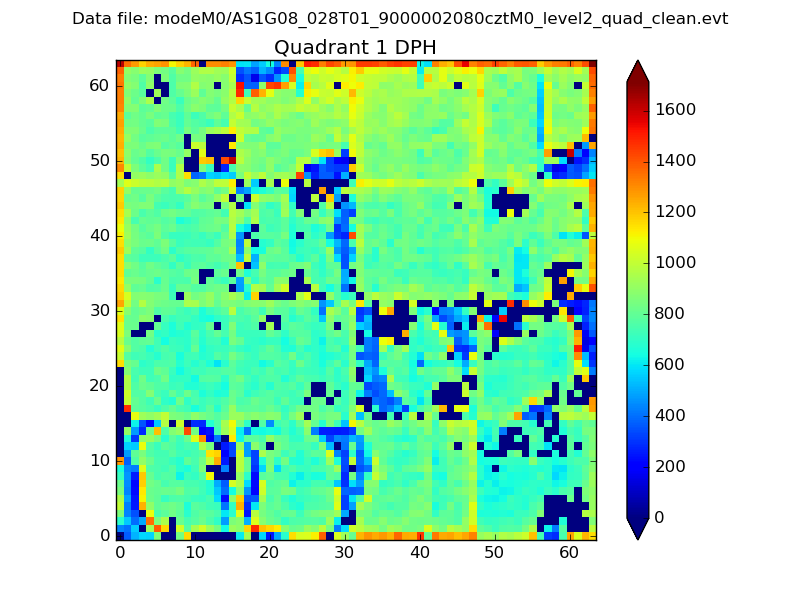 |
Quadrant B |
|---|---|---|---|
| Quadrant D | 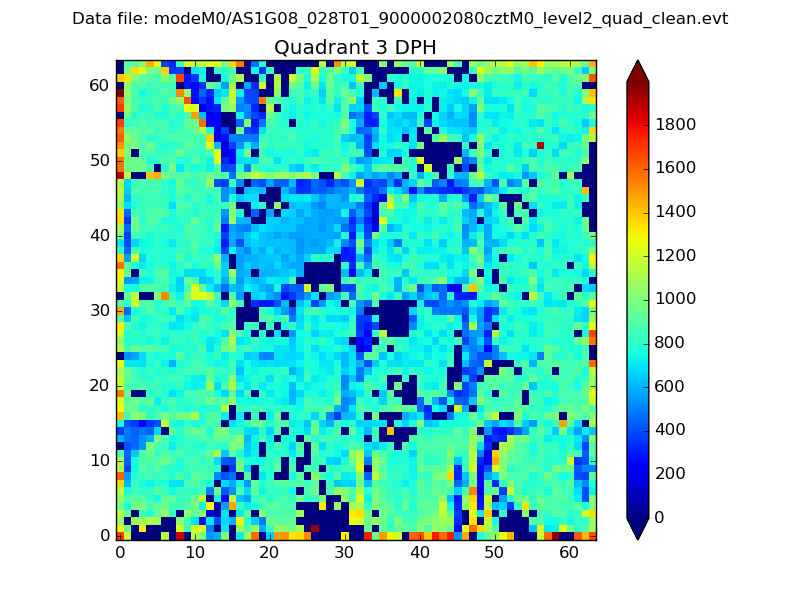 |
 |
Quadrant C |
| Plot type | Count rate plots | Images |
|---|---|---|
| Comparison with Poisson distribution Blue bars denote a histogram of data divided into 1 sec bins. Red curve is a Poisson curve with rate = median count rate of data. |
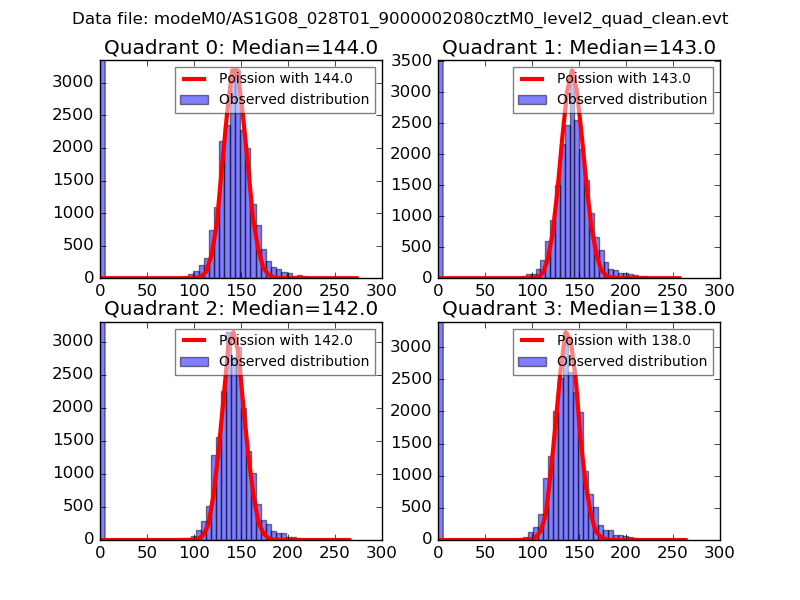 |
 |
| Quadrant-wise count rates Data is divided into 100 sec bins |
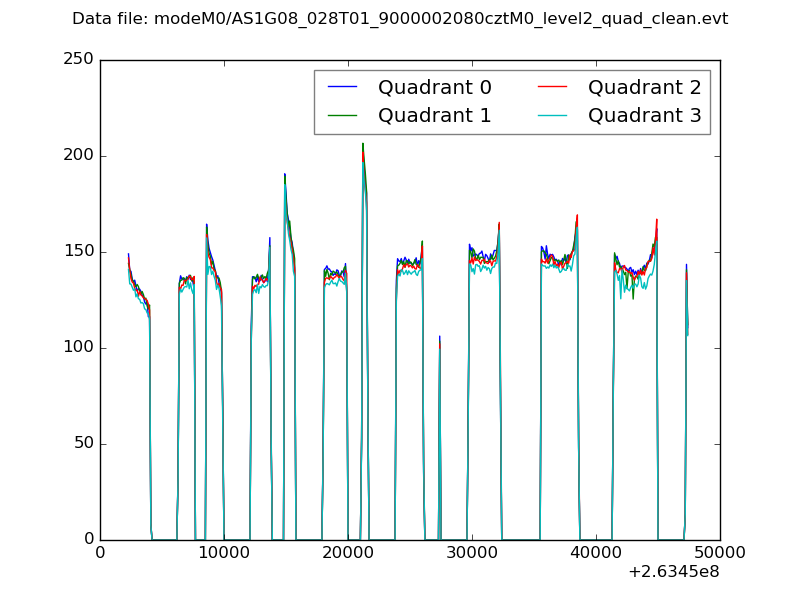 |
|
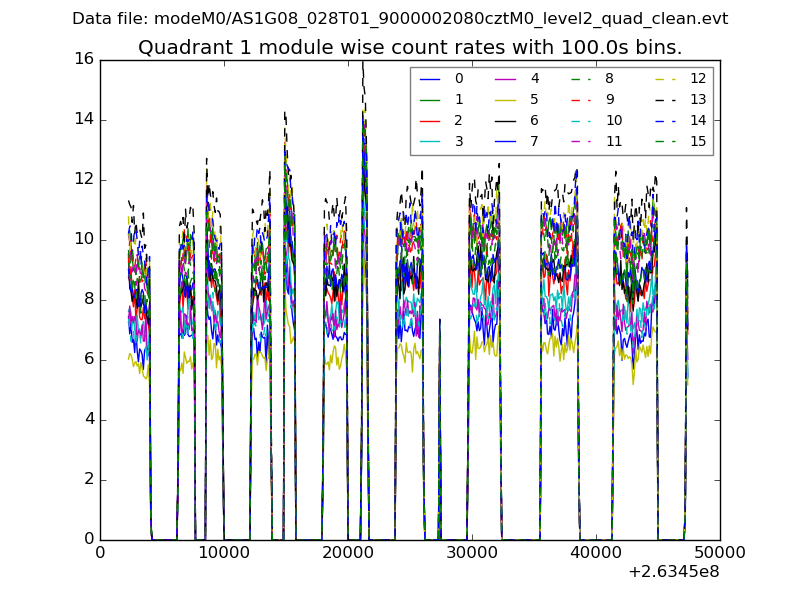
| Module-wise count rates for Quadrant A Data is divided into 100 sec bins |
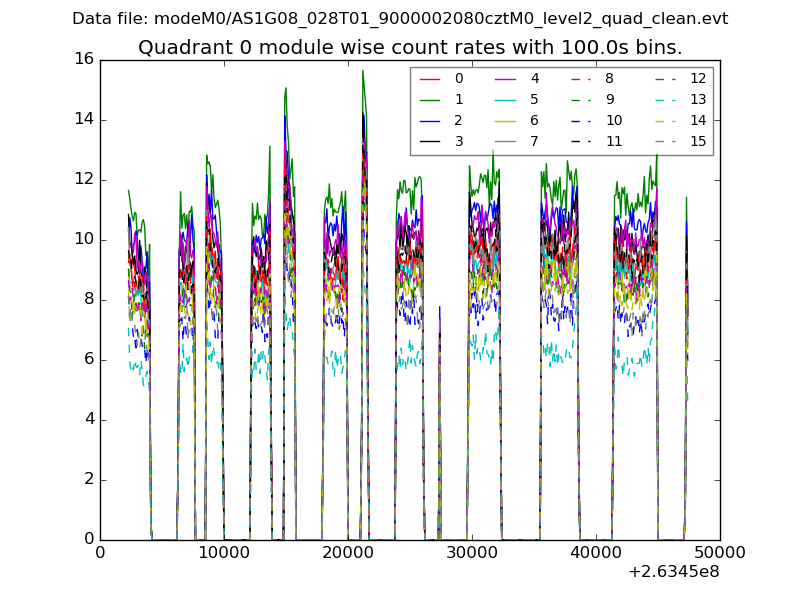 |
 |
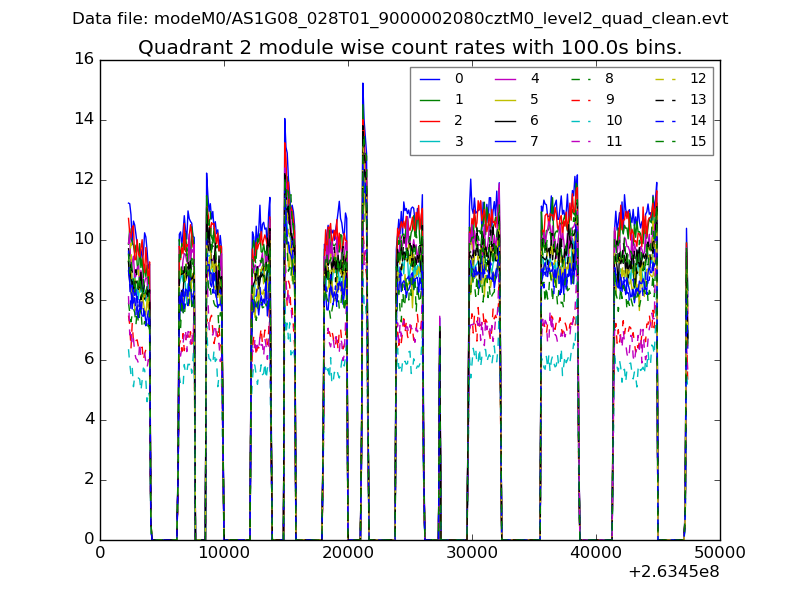
| Module-wise count rates for Quadrant B Data is divided into 100 sec bins |
 |
 |
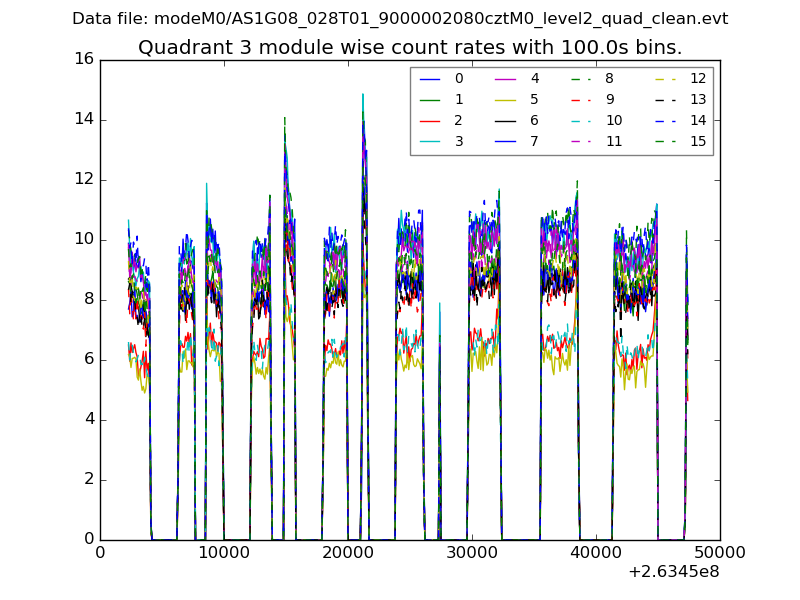
| Module-wise count rates for Quadrant C Data is divided into 100 sec bins |
 |
 |
| Module-wise count rates for Quadrant D Data is divided into 100 sec bins |
 |
 |
| Parameter | Plot |
|---|---|
| CZT HV Monitor | 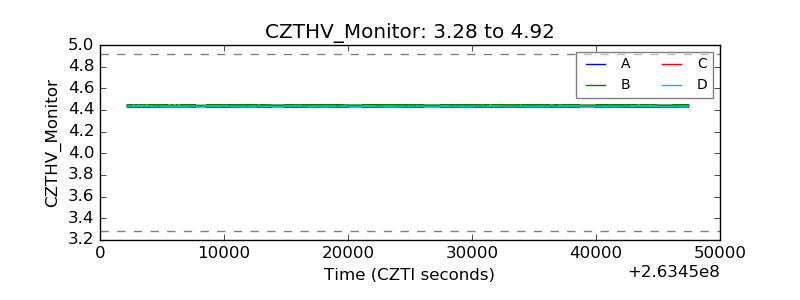 |
| D_VDD | 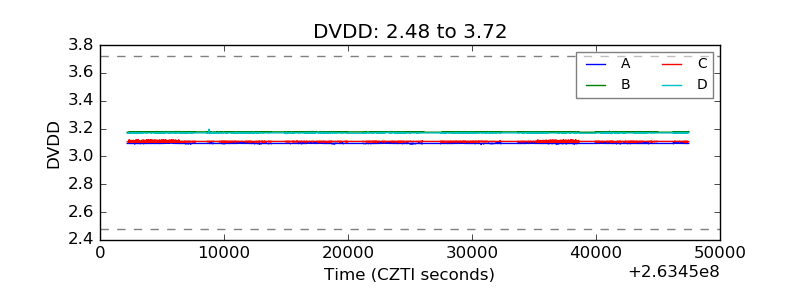 |
| Temperature 1 | 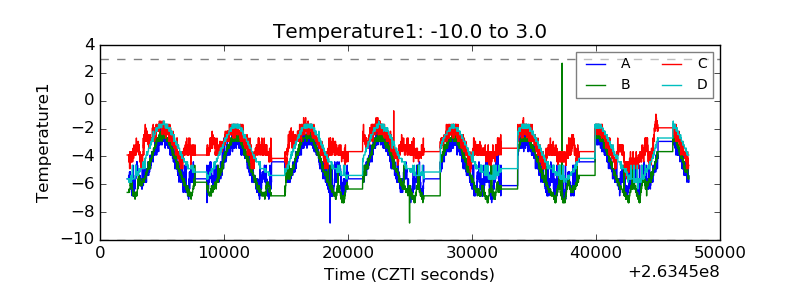 |
| Veto HV Monitor | 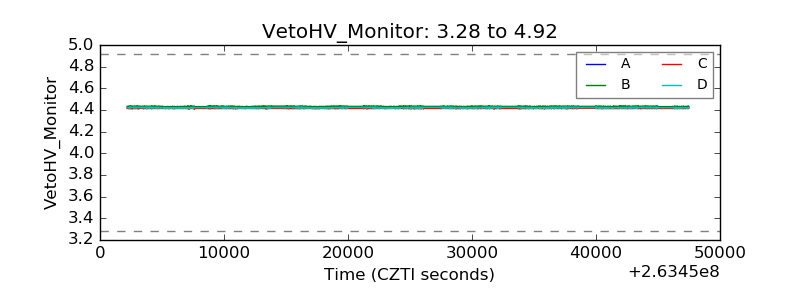 |
| Veto LLD | 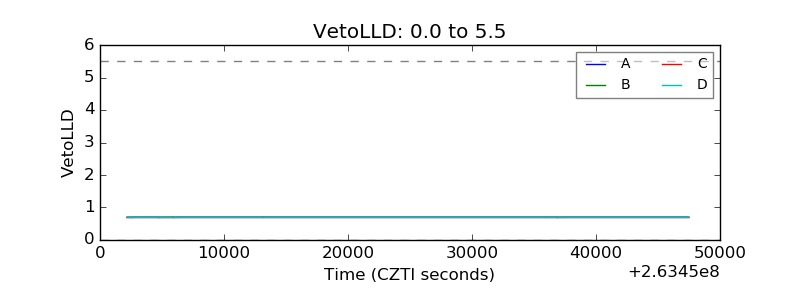 |
| Alpha Counter | 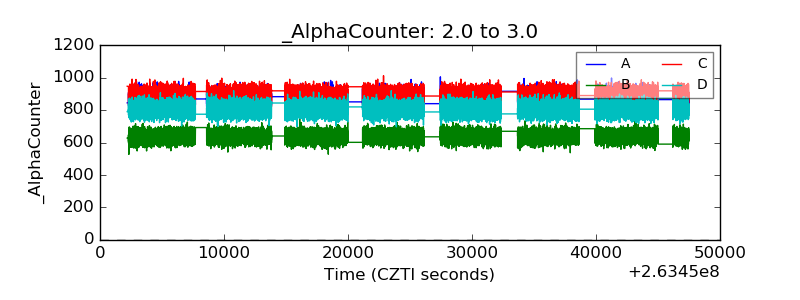 |
| _CPM_Rate | 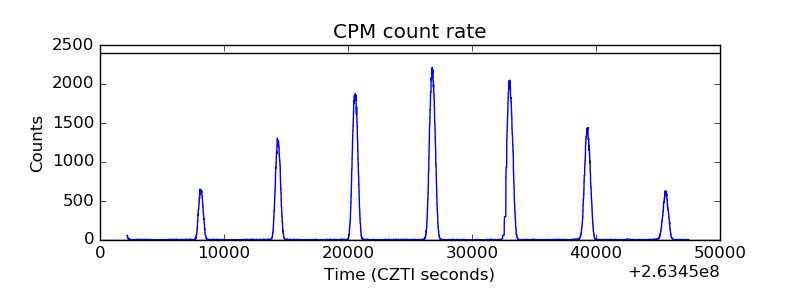 |
| CZT Counter | 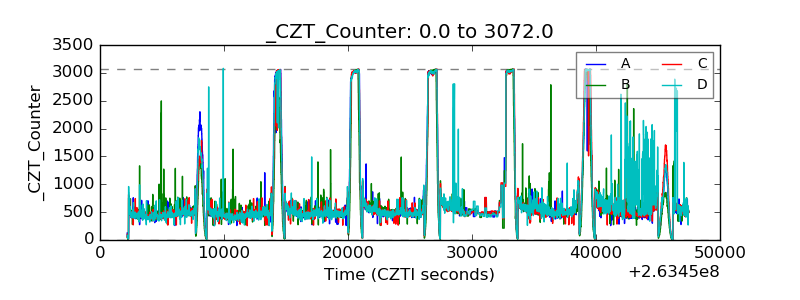 |
| +2.5 Volts monitor | 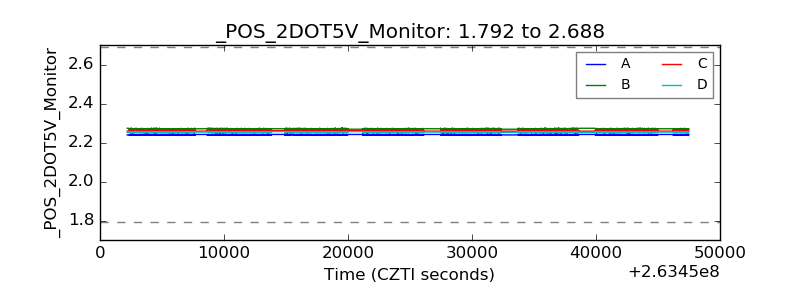 |
| +5 Volts monitor | 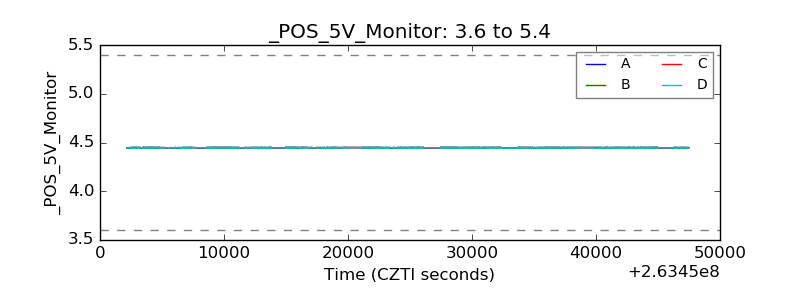 |
| _ROLL_ROT | 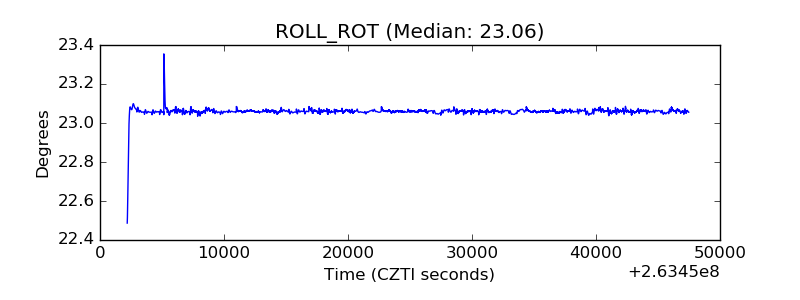 |
| _Roll_DEC | 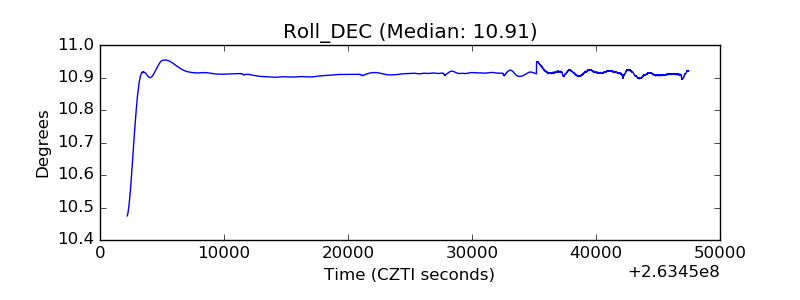 |
| _Roll_RA | 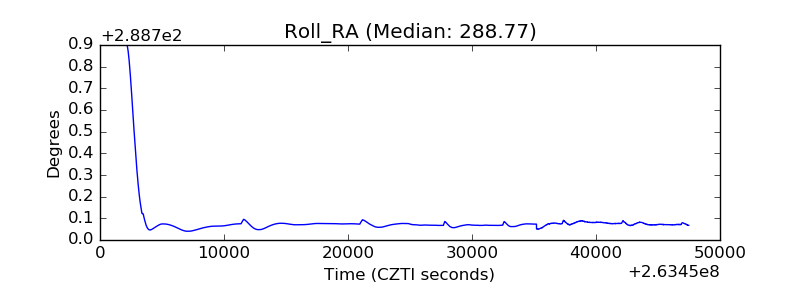 |
| Veto Counter | 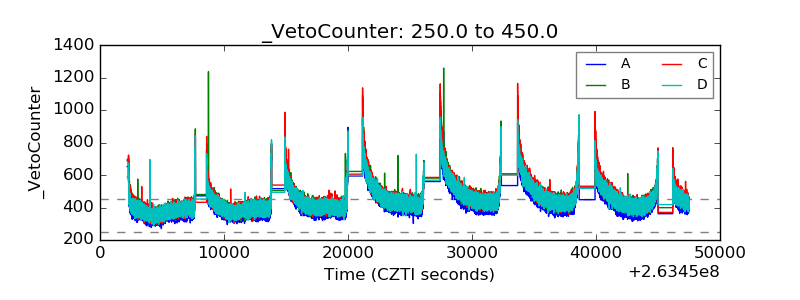 |