| Param | Original file | Final file |
|---|---|---|
| Filename | modeM0/AS1G08_028T01_9000002080_14106cztM0_level2.evt | modeM0/AS1G08_028T01_9000002080_14106cztM0_level2_quad_clean.evt |
| Size (bytes) | 99,489,600 | 30,133,440 |
| Size | 94.9 MB | 28.7 MB |
| Events in quadrant A | 706,811 | 202,139 |
| Events in quadrant B | 769,132 | 202,508 |
| Events in quadrant C | 718,505 | 200,283 |
| Events in quadrant D | 712,266 | 194,546 |
| Mode M0 | |||
|---|---|---|---|
| Quadrant | BADHDUFLAG | Total packets | Discarded packets |
| A | 0 | 3104 | 2 |
| B | 0 | 3243 | 1 |
| C | 0 | 3105 | 1 |
| D | 0 | 3180 | 1 |
| Mode M9 | |||
|---|---|---|---|
| Quadrant | BADHDUFLAG | Total packets | Discarded packets |
| A | 0 | 2 | 0 |
| B | 0 | 2 | 0 |
| C | 0 | 2 | 0 |
| D | 0 | 2 | 0 |
| Mode SS | |||
|---|---|---|---|
| Quadrant | BADHDUFLAG | Total packets | Discarded packets |
| A | 0 | 30 | 0 |
| B | 0 | 30 | 0 |
| C | 0 | 30 | 0 |
| D | 0 | 30 | 0 |
| Quadrant | Total seconds | Saturated seconds | Saturation percentage |
|---|---|---|---|
| A | 1523 | 8 | 0.525279% |
| B | 1523 | 18 | 1.181878% |
| C | 1523 | 1 | 0.065660% |
| D | 1523 | 7 | 0.459619% |
Noise dominated data is calculated using 1-second bins in cleaned event files. If a bin has >2000 counts, and if more than 50% of those come from <1% of pixels, then it is considered to be noise-dominated and hence unusable.
| Quadrant | # 1 sec bins | Bins with >0 counts | Bins with >2000 counts | High rate bins dominated by noise | Noise dominated (total time) | Noise dominated (detector-on time) | Marked lightcurve |
|---|---|---|---|---|---|---|---|
| A | 1524 | 1524 | 0 | 0 | 0.00% | 0.00% | 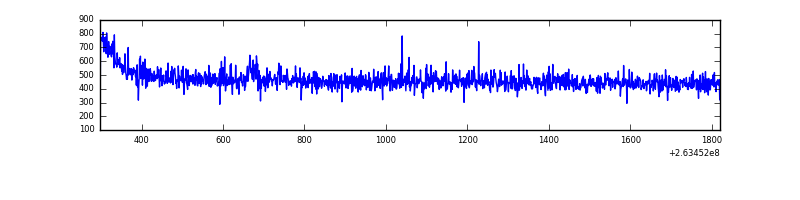 |
| B | 1524 | 1524 | 4 | 4 | 0.26% | 0.26% | 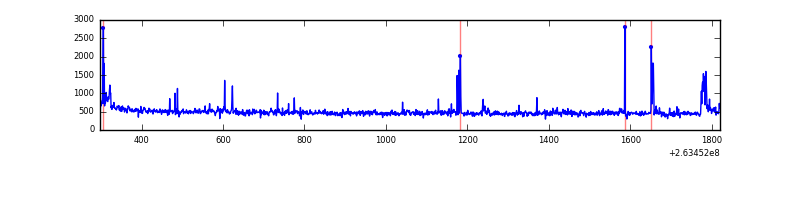 |
| C | 1524 | 1524 | 0 | 0 | 0.00% | 0.00% | 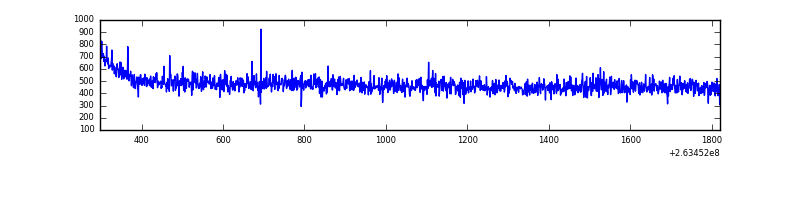 |
| D | 1524 | 1524 | 1 | 1 | 0.07% | 0.07% | 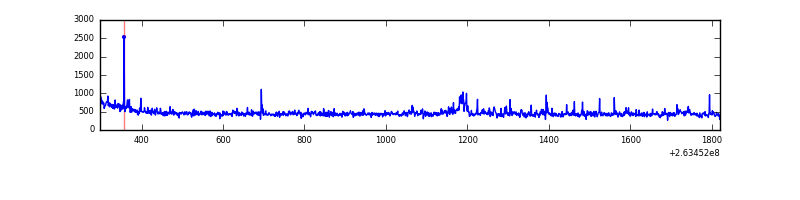 |
Top three noisy pixels from each quadrant. If the there are fewer than three noisy pixels in the level2.evt file, extra rows are filled as -1
| Pixel properties | Quadrant properties | ||||||
|---|---|---|---|---|---|---|---|
| Quadrant | DetID | PixID | Counts | Sigma | Mean | Median | Sigma |
| A | 11 | 47 | 2847 | 68.93 | 182 | 178 | 38.7 |
| A | 0 | 226 | 1634 | 37.61 | 182 | 178 | 38.7 |
| A | 8 | 15 | 1543 | 35.26 | 182 | 178 | 38.7 |
| B | 10 | 16 | 45399 | 1222.64 | 182 | 177 | 37.0 |
| B | 4 | 48 | 8064 | 213.24 | 182 | 177 | 37.0 |
| B | 4 | 80 | 4359 | 113.07 | 182 | 177 | 37.0 |
| C | 3 | 233 | 23215 | 541.79 | 176 | 177 | 42.5 |
| C | 8 | 128 | 4332 | 97.71 | 176 | 177 | 42.5 |
| C | 8 | 112 | 2012 | 43.15 | 176 | 177 | 42.5 |
| D | 10 | 70 | 17814 | 393.8 | 174 | 169 | 44.8 |
| D | 2 | 152 | 16880 | 372.96 | 174 | 169 | 44.8 |
| D | 10 | 172 | 9464 | 207.45 | 174 | 169 | 44.8 |
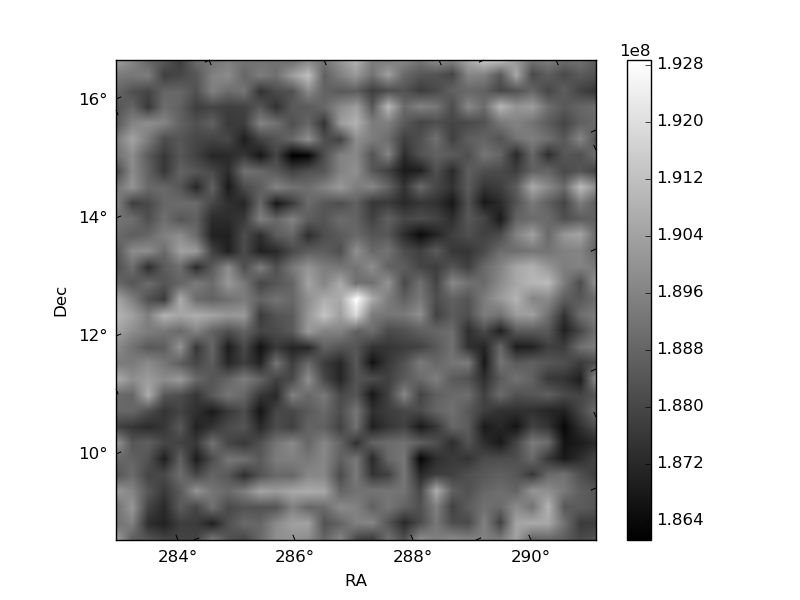
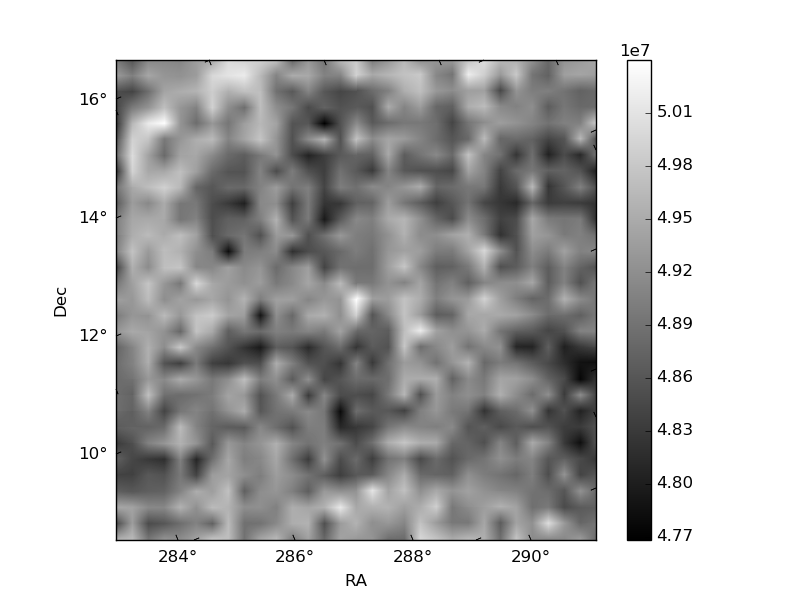
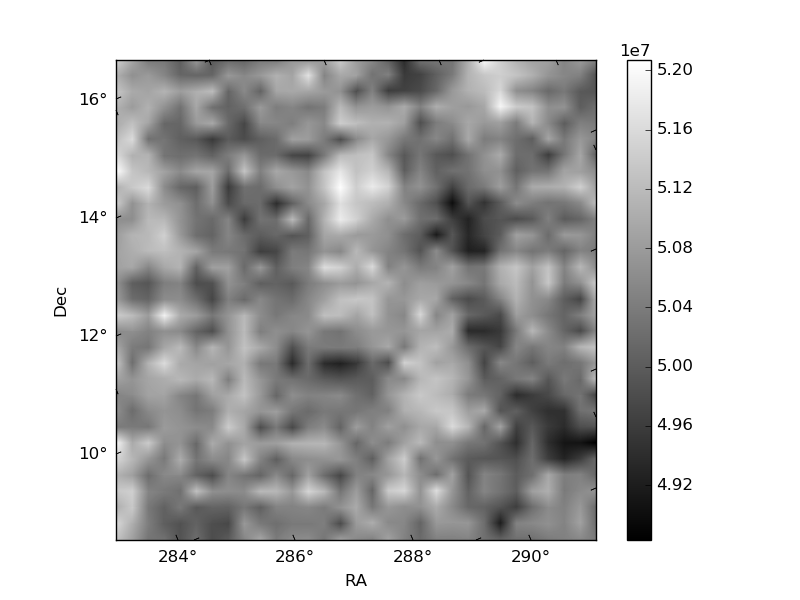
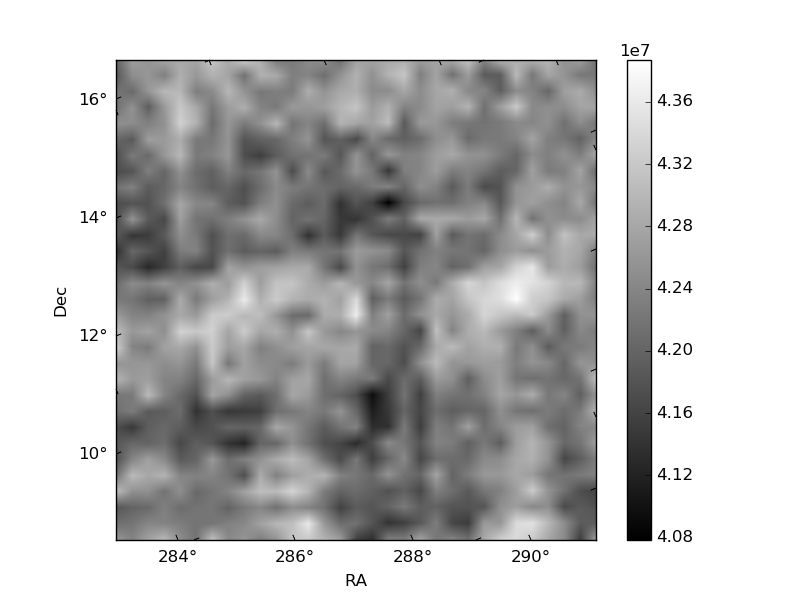
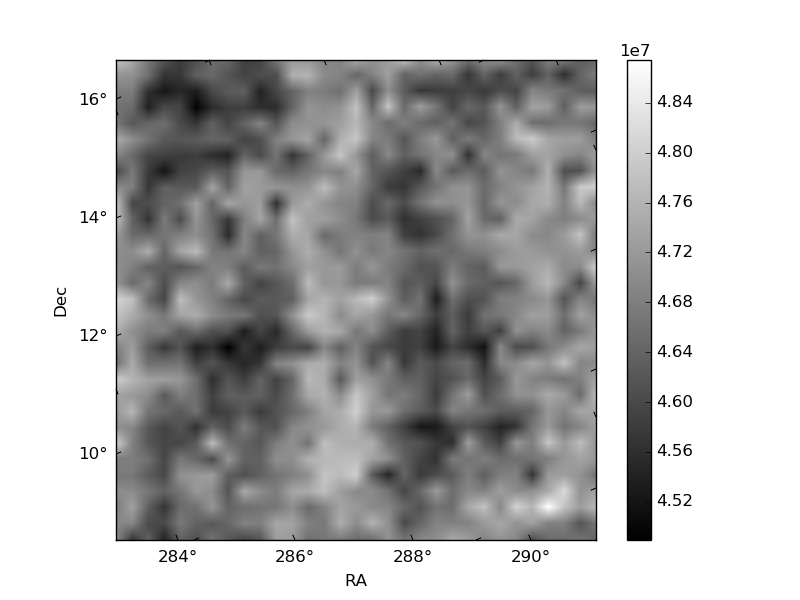
Histogram calculated using DETX and DETY for each event in the final _common_clean file
| Quadrant A |  |
 |
Quadrant B |
|---|---|---|---|
| Quadrant D |  |
 |
Quadrant C |
| Plot type | Count rate plots | Images |
|---|---|---|
| Comparison with Poisson distribution Blue bars denote a histogram of data divided into 1 sec bins. Red curve is a Poisson curve with rate = median count rate of data. |
 |
 |
| Quadrant-wise count rates Data is divided into 100 sec bins |
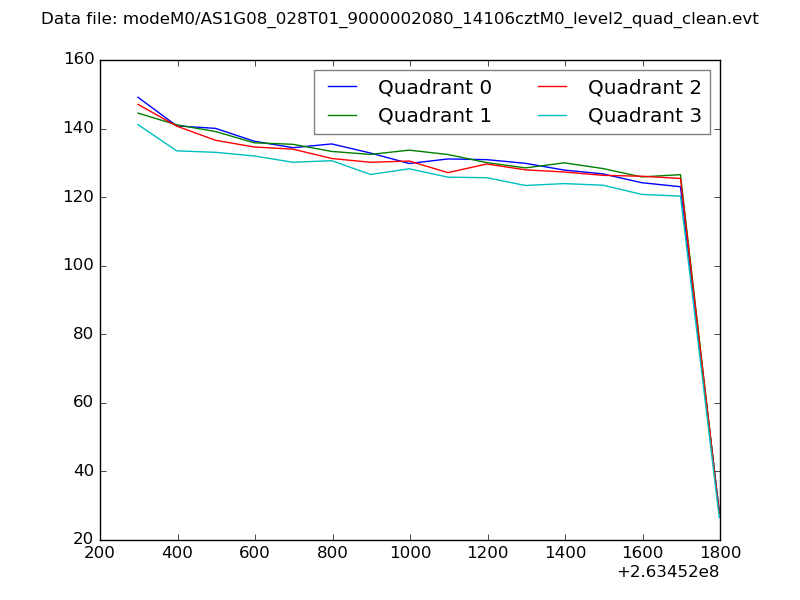 |
|
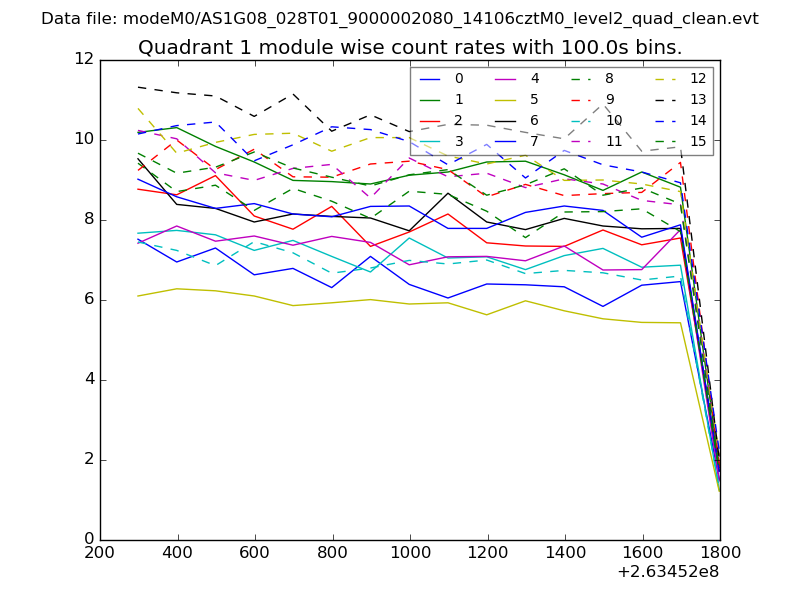
| Module-wise count rates for Quadrant A Data is divided into 100 sec bins |
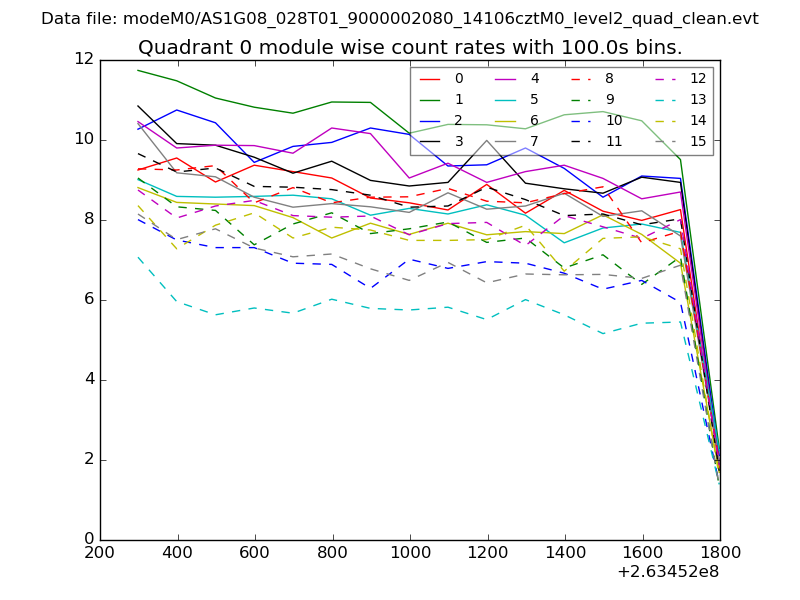 |
 |
| Module-wise count rates for Quadrant B Data is divided into 100 sec bins |
 |
 |
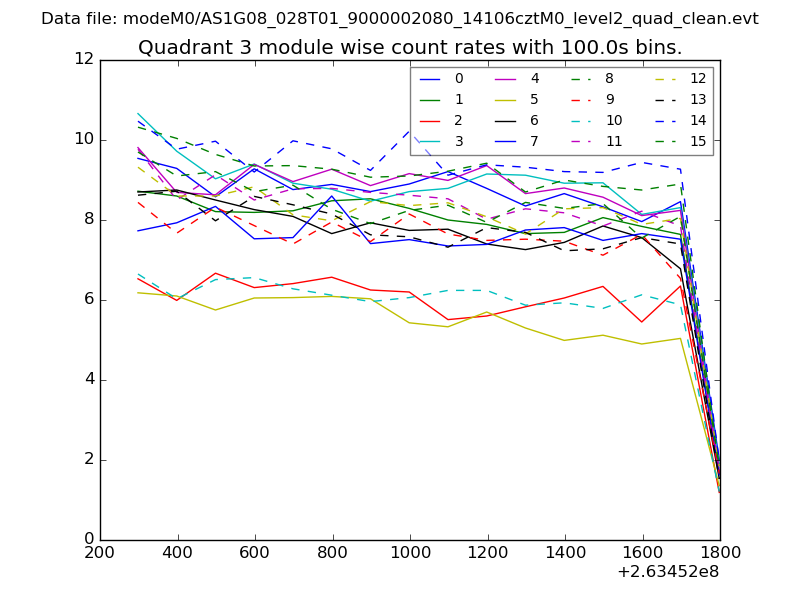
| Module-wise count rates for Quadrant C Data is divided into 100 sec bins |
 |
 |
| Module-wise count rates for Quadrant D Data is divided into 100 sec bins |
 |
 |
| Parameter | Plot |
|---|---|
| CZT HV Monitor |  |
| D_VDD | 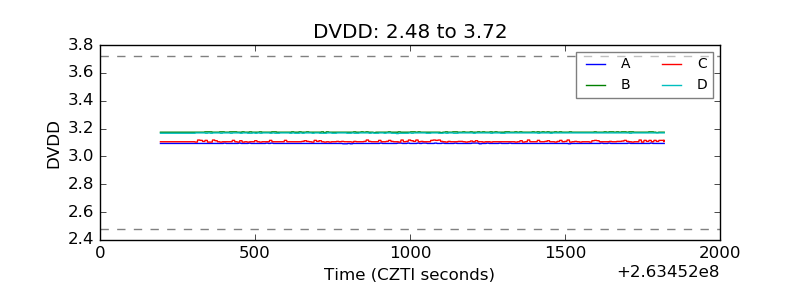 |
| Temperature 1 | 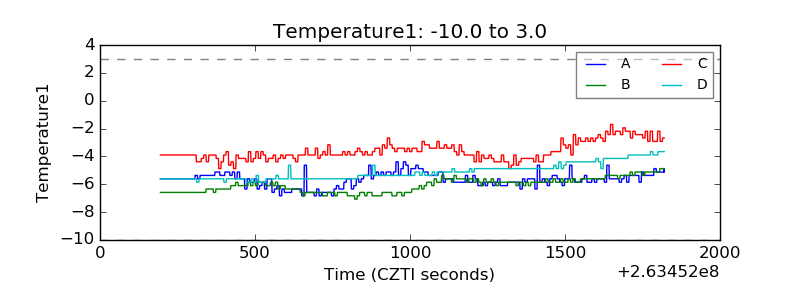 |
| Veto HV Monitor | 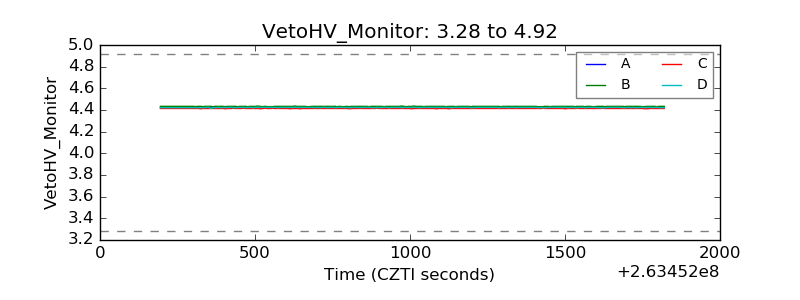 |
| Veto LLD | 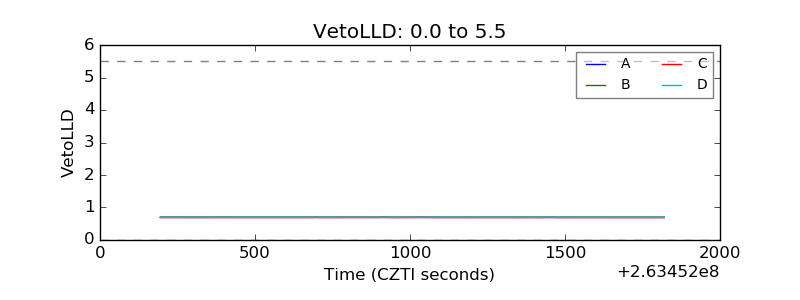 |
| Alpha Counter | 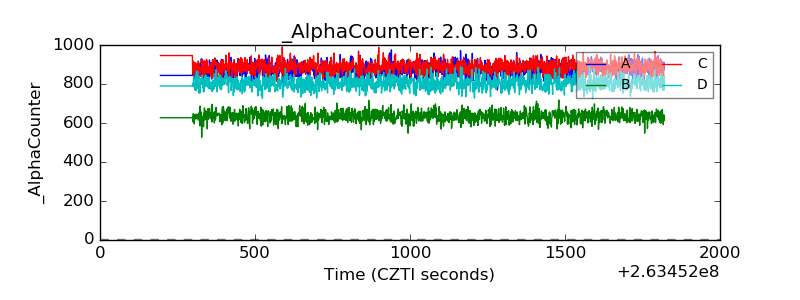 |
| _CPM_Rate | 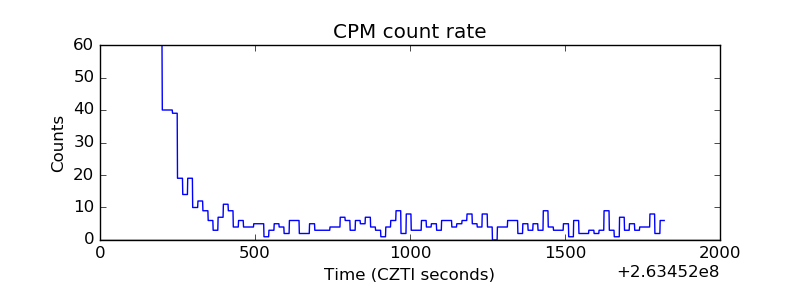 |
| CZT Counter | 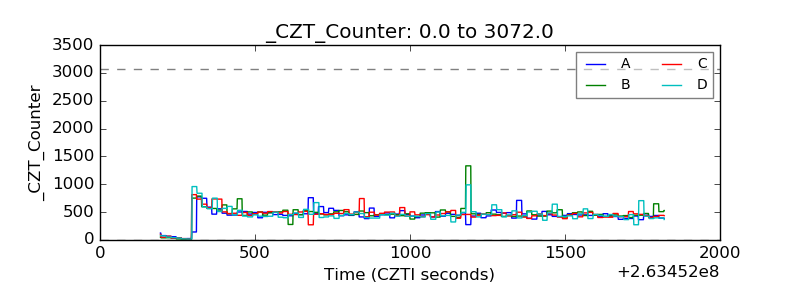 |
| +2.5 Volts monitor |  |
| +5 Volts monitor | 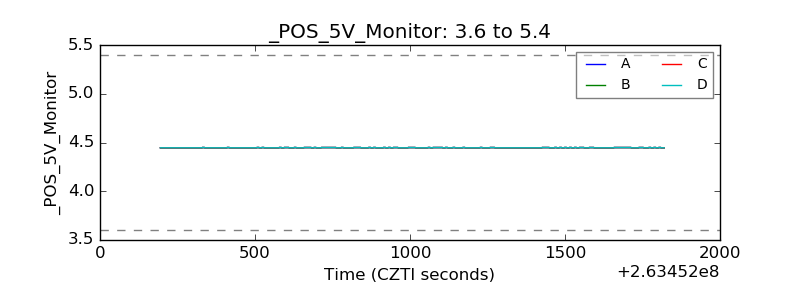 |
| _ROLL_ROT | 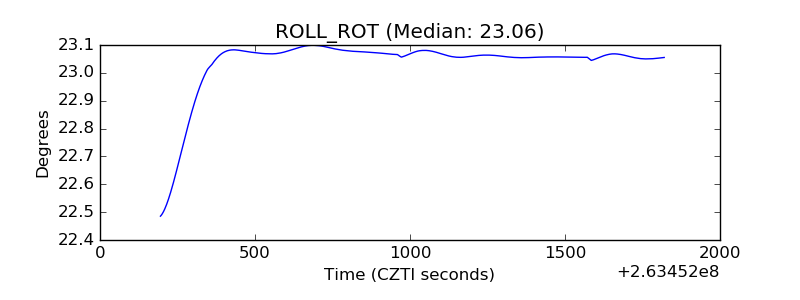 |
| _Roll_DEC | 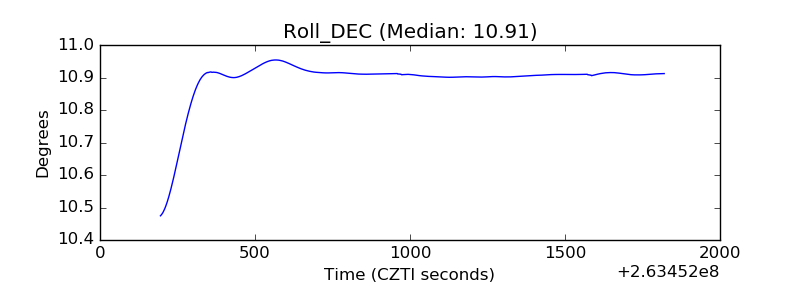 |
| _Roll_RA | 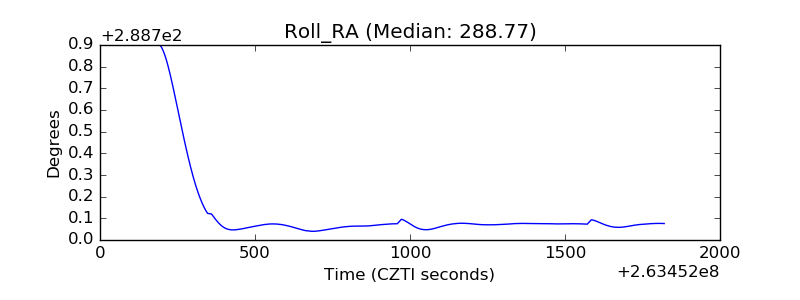 |
| Veto Counter | 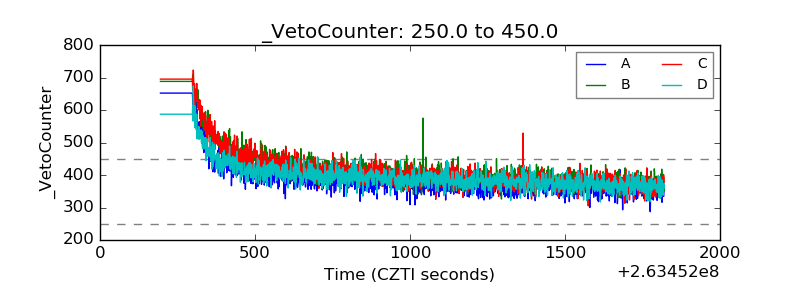 |