| Param | Original file | Final file |
|---|---|---|
| Filename | modeM0/AS1G08_028T01_9000002080_14107cztM0_level2.evt | modeM0/AS1G08_028T01_9000002080_14107cztM0_level2_quad_clean.evt |
| Size (bytes) | 446,088,960 | 90,210,240 |
| Size | 425.4 MB | 86.0 MB |
| Events in quadrant A | 3,141,444 | 573,780 |
| Events in quadrant B | 3,558,135 | 573,818 |
| Events in quadrant C | 3,168,382 | 567,405 |
| Events in quadrant D | 3,188,726 | 552,282 |
| Mode M0 | |||
|---|---|---|---|
| Quadrant | BADHDUFLAG | Total packets | Discarded packets |
| A | 0 | 13544 | 2 |
| B | 0 | 14668 | 1 |
| C | 0 | 13536 | 1 |
| D | 0 | 13854 | 1 |
| Mode M9 | |||
|---|---|---|---|
| Quadrant | BADHDUFLAG | Total packets | Discarded packets |
| A | 0 | 10 | 0 |
| B | 0 | 10 | 0 |
| C | 0 | 10 | 0 |
| D | 0 | 10 | 0 |
| Mode SS | |||
|---|---|---|---|
| Quadrant | BADHDUFLAG | Total packets | Discarded packets |
| A | 0 | 134 | 0 |
| B | 0 | 134 | 0 |
| C | 0 | 134 | 0 |
| D | 0 | 134 | 0 |
| Quadrant | Total seconds | Saturated seconds | Saturation percentage |
|---|---|---|---|
| A | 6668 | 52 | 0.779844% |
| B | 6668 | 129 | 1.934613% |
| C | 6668 | 36 | 0.539892% |
| D | 6668 | 49 | 0.734853% |
Noise dominated data is calculated using 1-second bins in cleaned event files. If a bin has >2000 counts, and if more than 50% of those come from <1% of pixels, then it is considered to be noise-dominated and hence unusable.
| Quadrant | # 1 sec bins | Bins with >0 counts | Bins with >2000 counts | High rate bins dominated by noise | Noise dominated (total time) | Noise dominated (detector-on time) | Marked lightcurve |
|---|---|---|---|---|---|---|---|
| A | 7574 | 6670 | 0 | 0 | 0.00% | 0.00% | 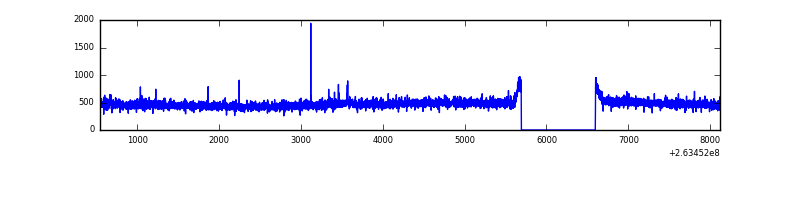 |
| B | 7574 | 6670 | 58 | 58 | 0.77% | 0.87% | 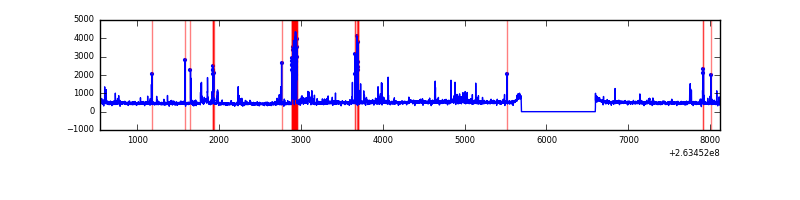 |
| C | 7574 | 6670 | 0 | 0 | 0.00% | 0.00% | 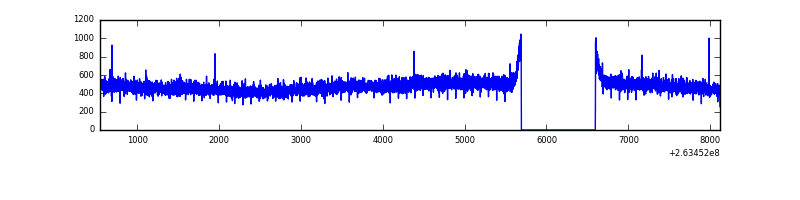 |
| D | 7574 | 6670 | 8 | 8 | 0.11% | 0.12% | 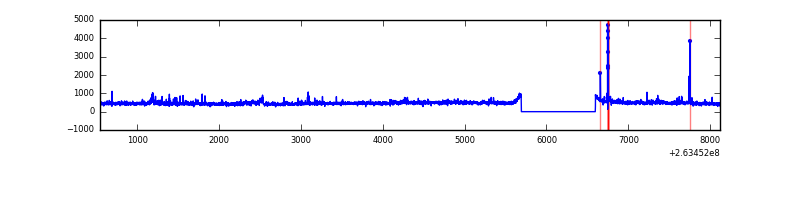 |
Top three noisy pixels from each quadrant. If the there are fewer than three noisy pixels in the level2.evt file, extra rows are filled as -1
| Pixel properties | Quadrant properties | ||||||
|---|---|---|---|---|---|---|---|
| Quadrant | DetID | PixID | Counts | Sigma | Mean | Median | Sigma |
| A | 12 | 96 | 7480 | 40.42 | 812 | 792 | 165.5 |
| A | 0 | 226 | 7169 | 38.54 | 812 | 792 | 165.5 |
| A | 8 | 15 | 7063 | 37.9 | 812 | 792 | 165.5 |
| B | 10 | 16 | 248051 | 1603.65 | 803 | 784 | 154.2 |
| B | 0 | 85 | 61312 | 392.55 | 803 | 784 | 154.2 |
| B | 0 | 189 | 54330 | 347.27 | 803 | 784 | 154.2 |
| C | 3 | 233 | 101521 | 549.82 | 783 | 787 | 183.2 |
| C | 8 | 128 | 9402 | 47.02 | 783 | 787 | 183.2 |
| C | 13 | 61 | 5595 | 26.24 | 783 | 787 | 183.2 |
| D | 10 | 172 | 120465 | 641.58 | 782 | 763 | 186.6 |
| D | 2 | 152 | 48110 | 253.77 | 782 | 763 | 186.6 |
| D | 2 | 234 | 21629 | 111.84 | 782 | 763 | 186.6 |
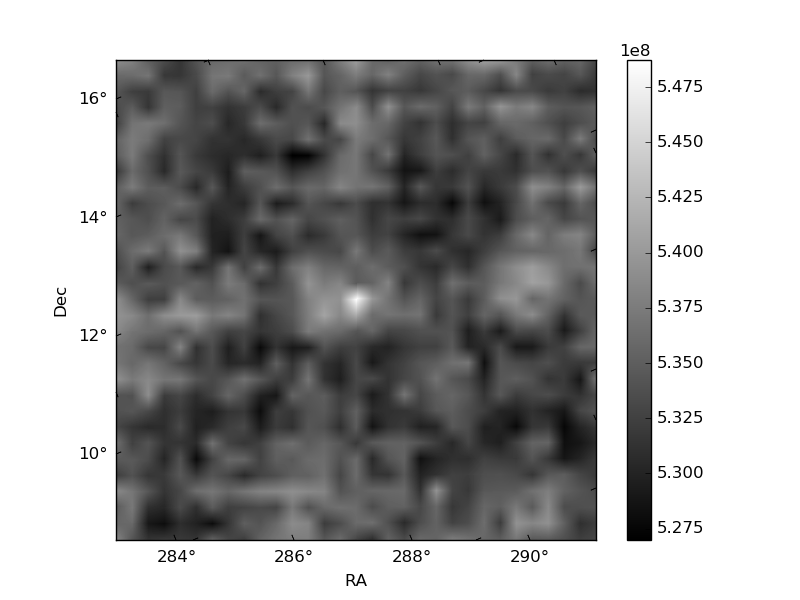
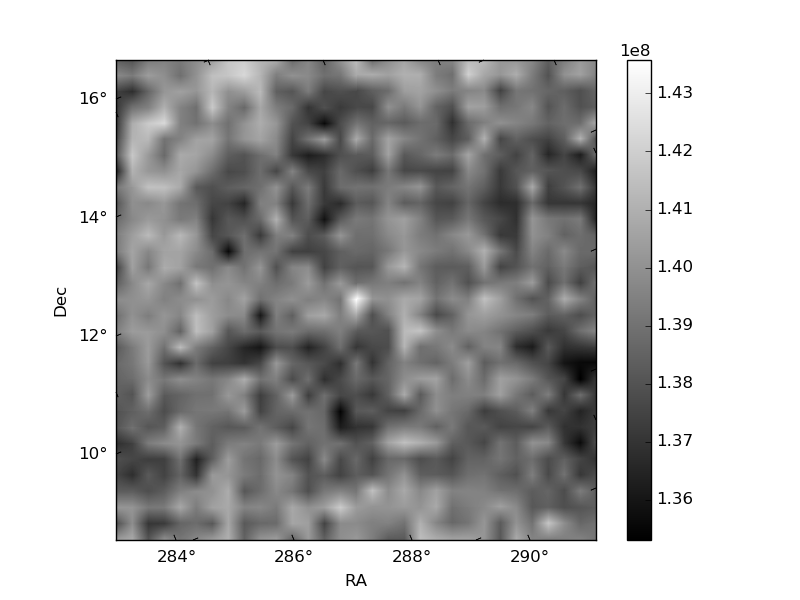
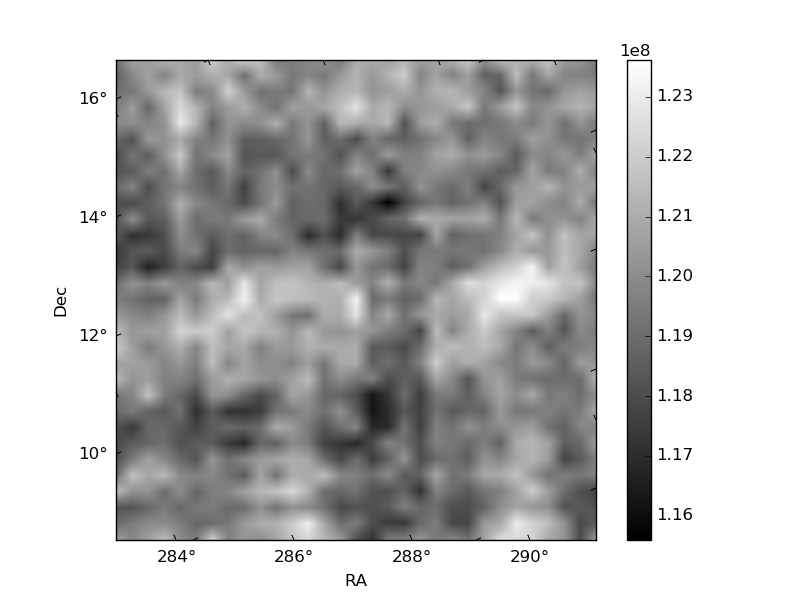
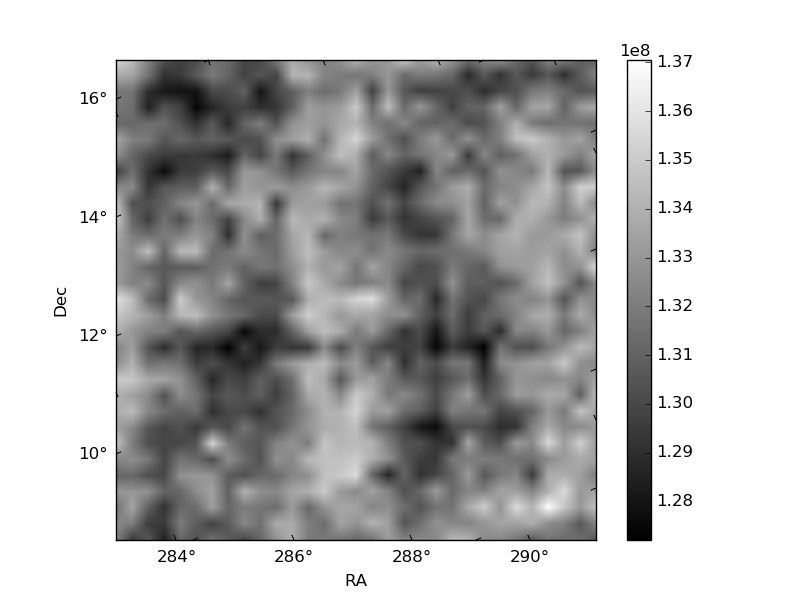
Histogram calculated using DETX and DETY for each event in the final _common_clean file
| Quadrant A | 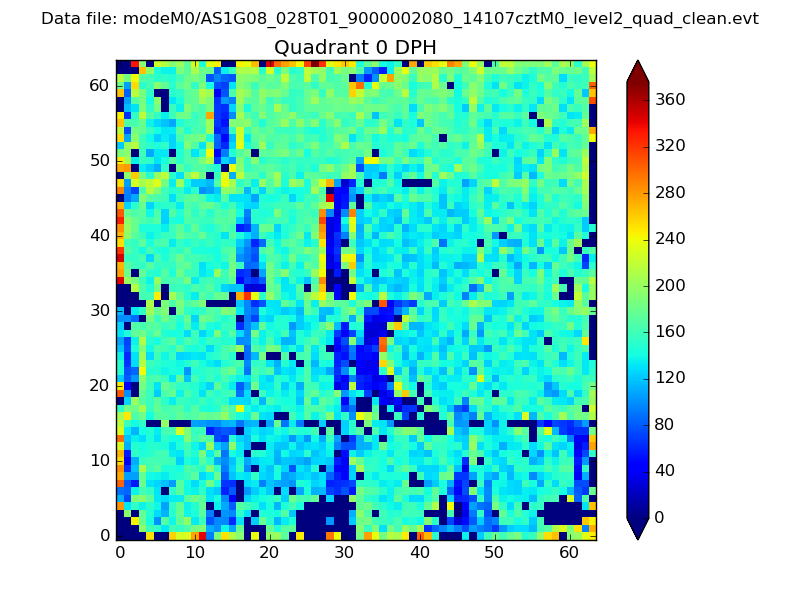 |
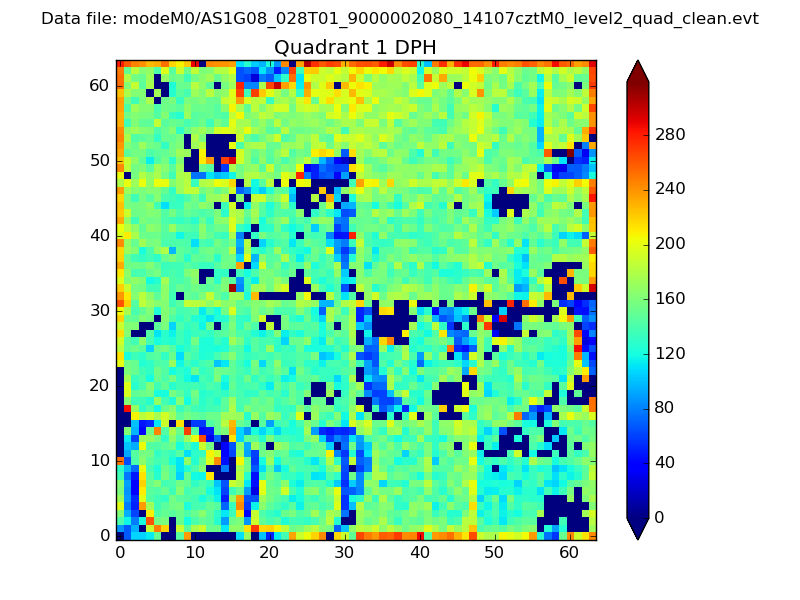 |
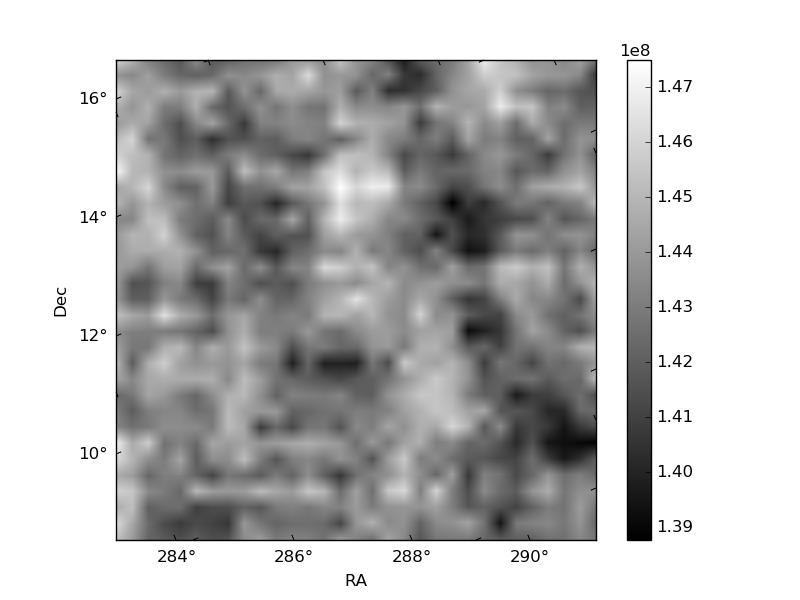
Quadrant B |
|---|---|---|---|
| Quadrant D | 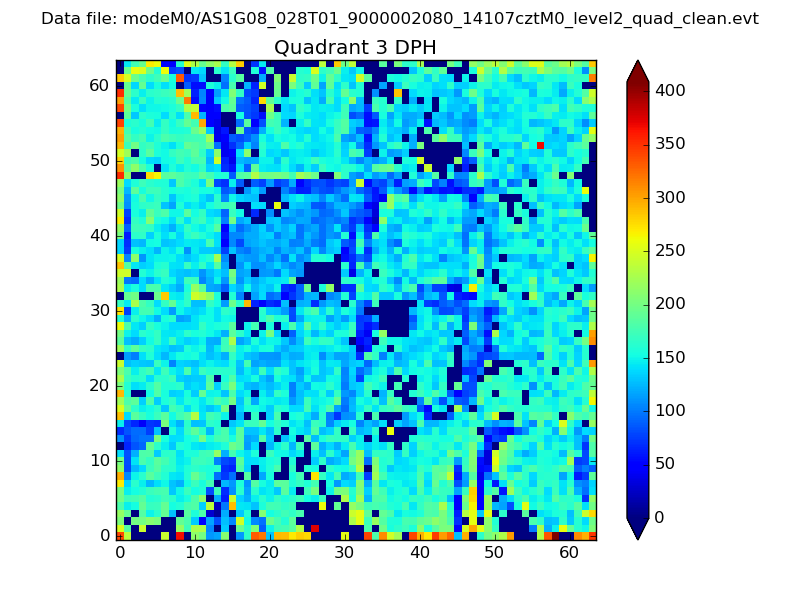 |
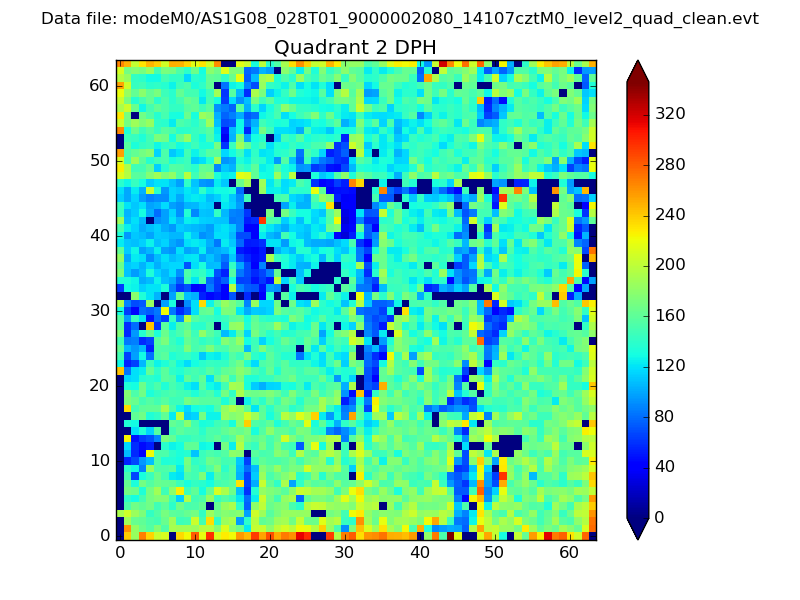 |
Quadrant C |
| Plot type | Count rate plots | Images |
|---|---|---|
| Comparison with Poisson distribution Blue bars denote a histogram of data divided into 1 sec bins. Red curve is a Poisson curve with rate = median count rate of data. |
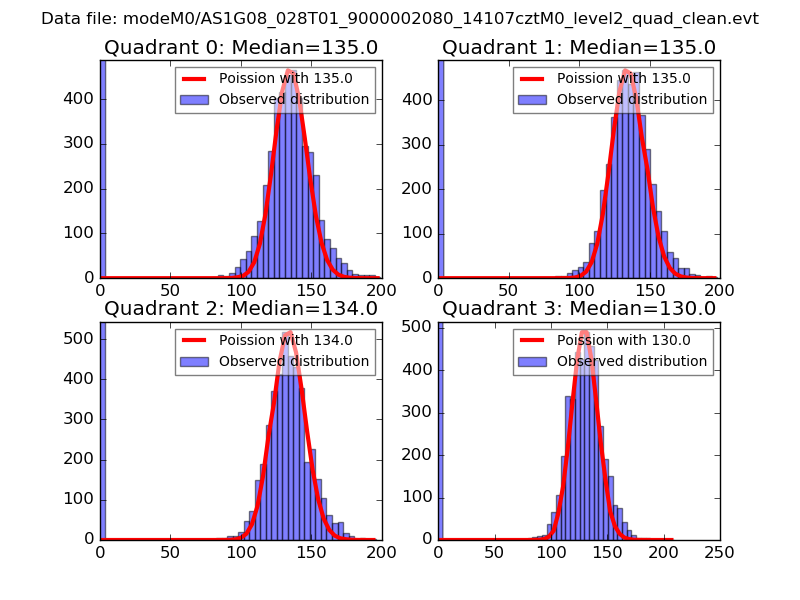 |
 |
| Quadrant-wise count rates Data is divided into 100 sec bins |
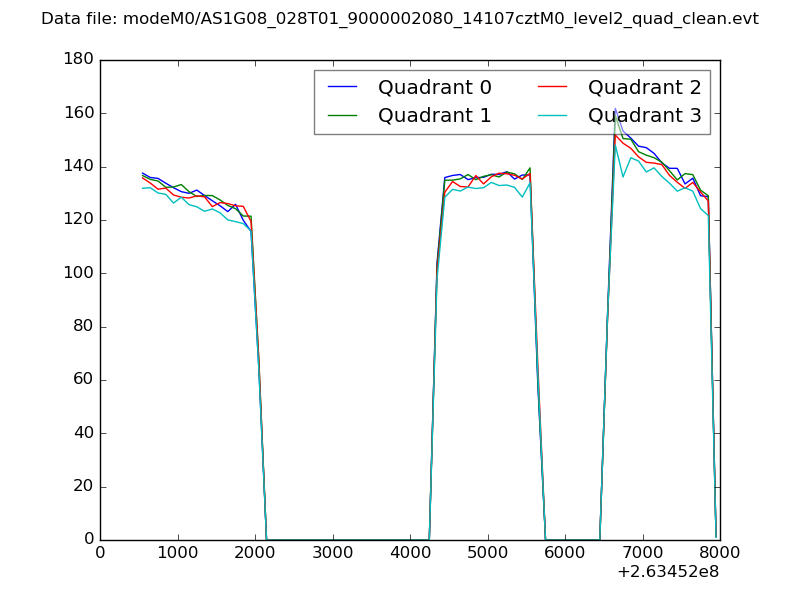 |
|
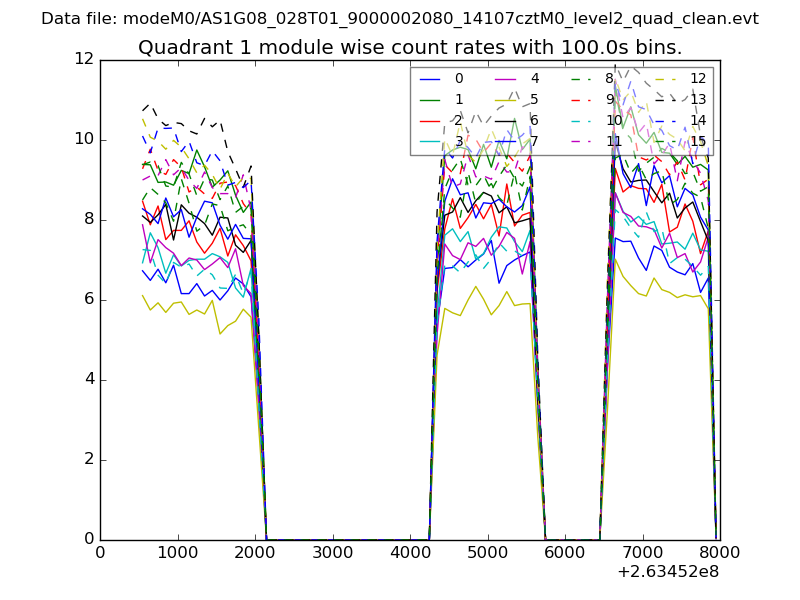
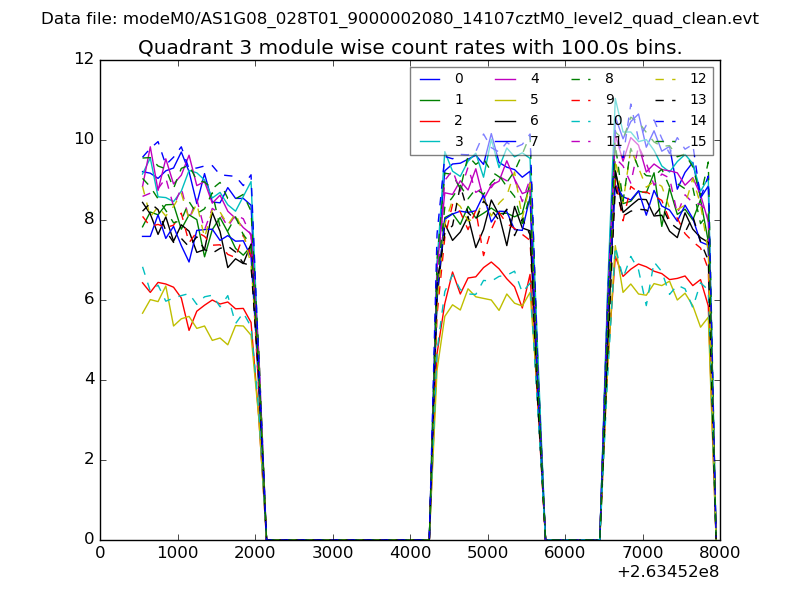
| Module-wise count rates for Quadrant A Data is divided into 100 sec bins |
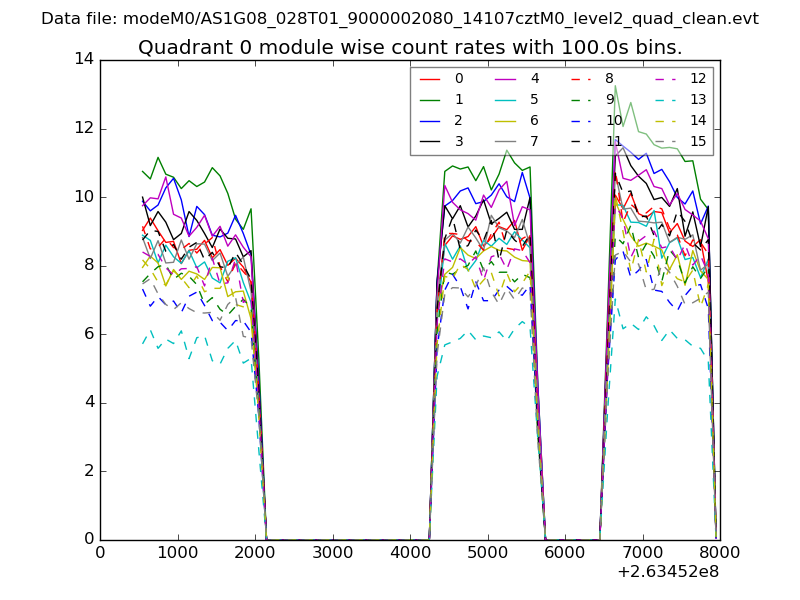 |
 |
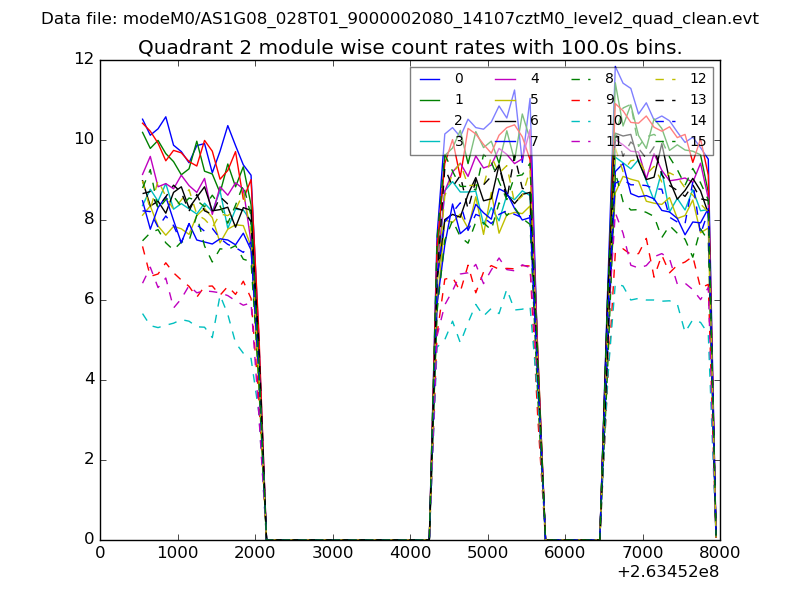
| Module-wise count rates for Quadrant B Data is divided into 100 sec bins |
 |
 |
| Module-wise count rates for Quadrant C Data is divided into 100 sec bins |
 |
 |
| Module-wise count rates for Quadrant D Data is divided into 100 sec bins |
 |
 |
| Parameter | Plot |
|---|---|
| CZT HV Monitor | 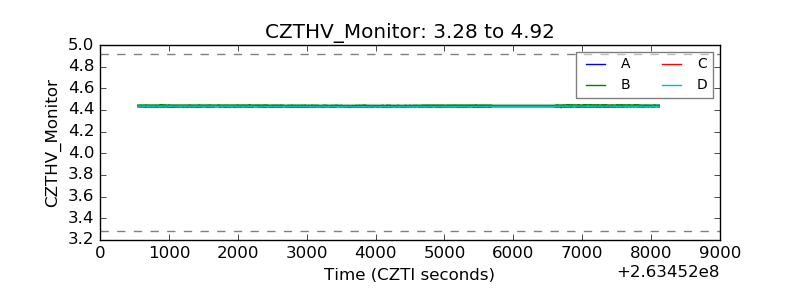 |
| D_VDD | 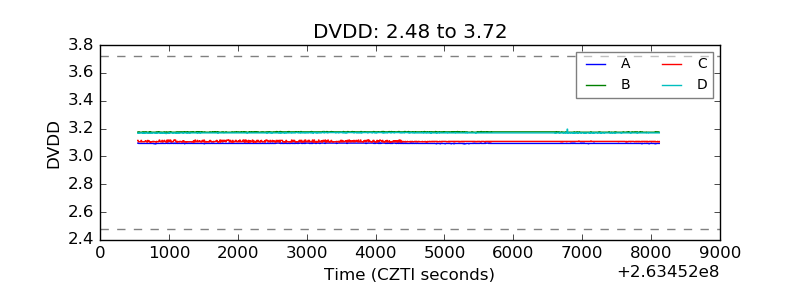 |
| Temperature 1 | 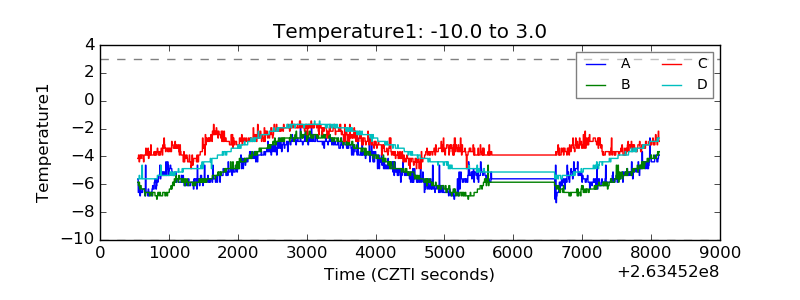 |
| Veto HV Monitor | 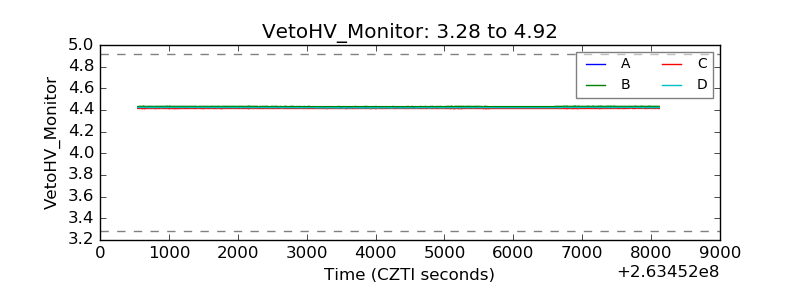 |
| Veto LLD |  |
| Alpha Counter | 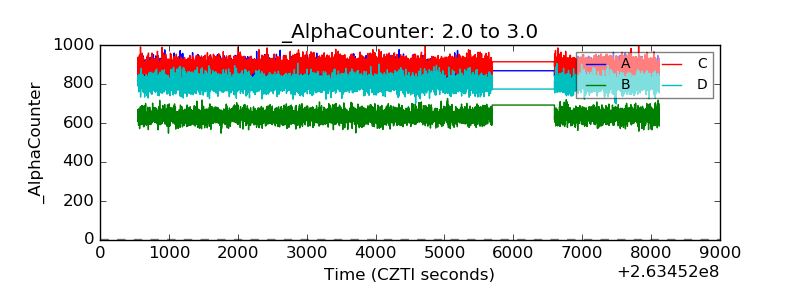 |
| _CPM_Rate | 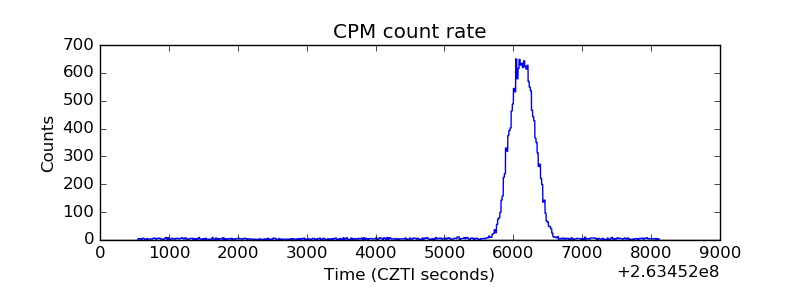 |
| CZT Counter | 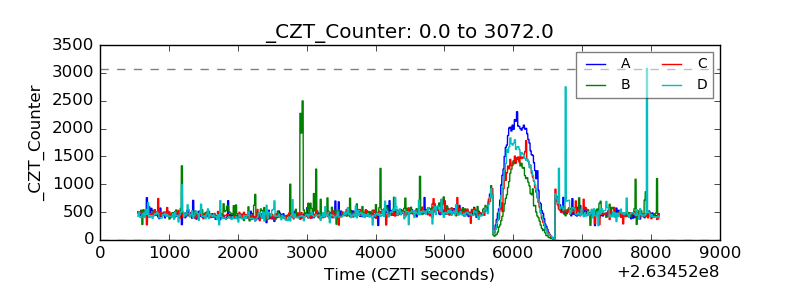 |
| +2.5 Volts monitor |  |
| +5 Volts monitor |  |
| _ROLL_ROT |  |
| _Roll_DEC | 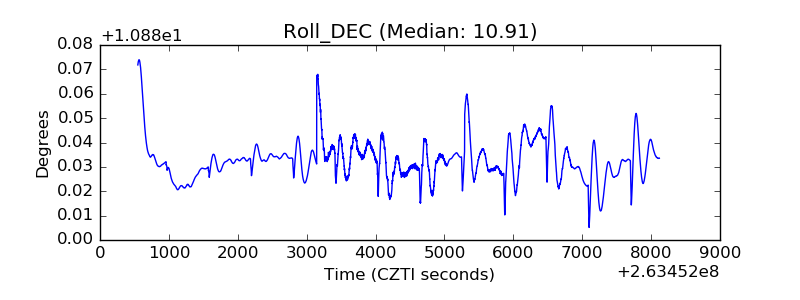 |
| _Roll_RA | 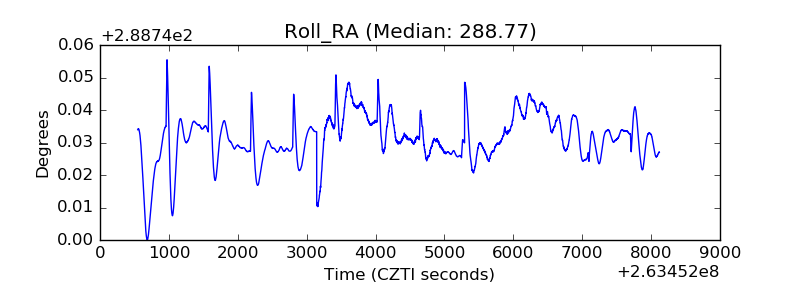 |
| Veto Counter | 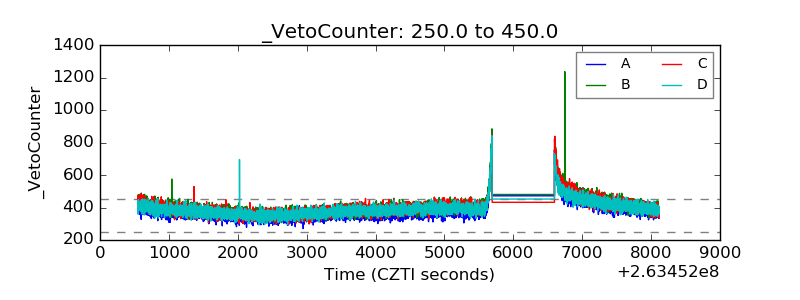 |