| Param | Original file | Final file |
|---|---|---|
| Filename | modeM0/AS1G08_028T01_9000002080_14111cztM0_level2.evt | modeM0/AS1G08_028T01_9000002080_14111cztM0_level2_quad_clean.evt |
| Size (bytes) | 474,448,320 | 69,612,480 |
| Size | 452.5 MB | 66.4 MB |
| Events in quadrant A | 3,403,341 | 422,349 |
| Events in quadrant B | 3,548,824 | 422,439 |
| Events in quadrant C | 3,380,703 | 414,988 |
| Events in quadrant D | 3,606,431 | 406,381 |
| Mode M0 | |||
|---|---|---|---|
| Quadrant | BADHDUFLAG | Total packets | Discarded packets |
| A | 0 | 13940 | 3 |
| B | 0 | 14469 | 2 |
| C | 0 | 13741 | 2 |
| D | 0 | 14781 | 2 |
| Mode M9 | |||
|---|---|---|---|
| Quadrant | BADHDUFLAG | Total packets | Discarded packets |
| A | 0 | 17 | 0 |
| B | 0 | 17 | 0 |
| C | 0 | 17 | 0 |
| D | 0 | 18 | 0 |
| Mode SS | |||
|---|---|---|---|
| Quadrant | BADHDUFLAG | Total packets | Discarded packets |
| A | 0 | 130 | 0 |
| B | 0 | 130 | 0 |
| C | 0 | 130 | 0 |
| D | 0 | 130 | 0 |
| Quadrant | Total seconds | Saturated seconds | Saturation percentage |
|---|---|---|---|
| A | 6321 | 41 | 0.648632% |
| B | 6321 | 48 | 0.759374% |
| C | 6321 | 18 | 0.284765% |
| D | 6321 | 105 | 1.661130% |
Noise dominated data is calculated using 1-second bins in cleaned event files. If a bin has >2000 counts, and if more than 50% of those come from <1% of pixels, then it is considered to be noise-dominated and hence unusable.
| Quadrant | # 1 sec bins | Bins with >0 counts | Bins with >2000 counts | High rate bins dominated by noise | Noise dominated (total time) | Noise dominated (detector-on time) | Marked lightcurve |
|---|---|---|---|---|---|---|---|
| A | 7637 | 6323 | 1 | 1 | 0.01% | 0.02% | 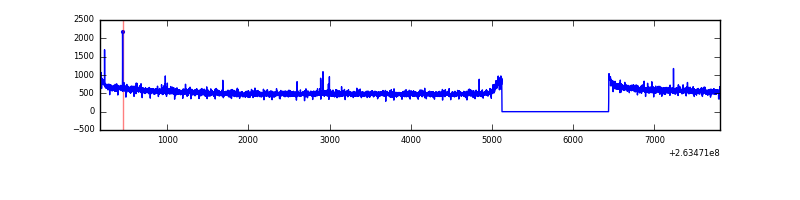 |
| B | 7637 | 6323 | 4 | 4 | 0.05% | 0.06% | 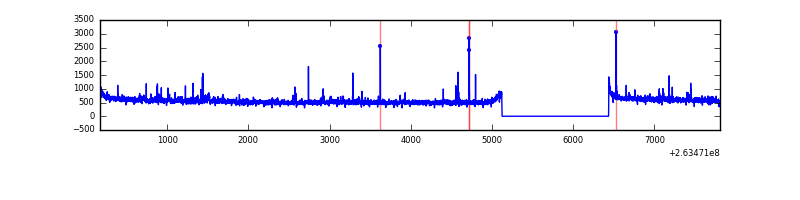 |
| C | 7637 | 6323 | 0 | 0 | 0.00% | 0.00% | 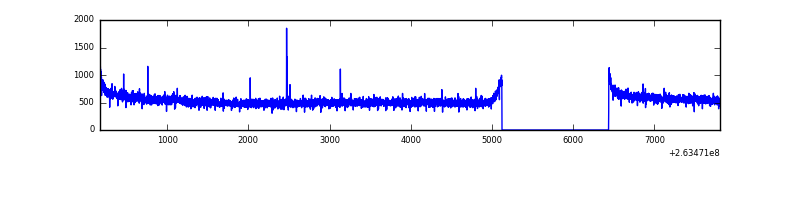 |
| D | 7637 | 6323 | 68 | 68 | 0.89% | 1.08% | 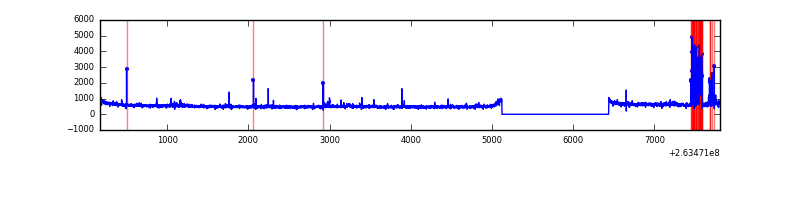 |
Top three noisy pixels from each quadrant. If the there are fewer than three noisy pixels in the level2.evt file, extra rows are filled as -1
| Pixel properties | Quadrant properties | ||||||
|---|---|---|---|---|---|---|---|
| Quadrant | DetID | PixID | Counts | Sigma | Mean | Median | Sigma |
| A | 12 | 96 | 11838 | 62.36 | 877 | 864 | 176.0 |
| A | 8 | 15 | 9666 | 50.02 | 877 | 864 | 176.0 |
| A | 0 | 226 | 7809 | 39.47 | 877 | 864 | 176.0 |
| B | 0 | 189 | 46848 | 285.63 | 864 | 847 | 161.1 |
| B | 0 | 214 | 43618 | 265.57 | 864 | 847 | 161.1 |
| B | 4 | 80 | 20929 | 124.69 | 864 | 847 | 161.1 |
| C | 3 | 233 | 101442 | 523.59 | 838 | 846 | 192.1 |
| C | 14 | 234 | 8034 | 37.41 | 838 | 846 | 192.1 |
| C | 13 | 61 | 6110 | 27.4 | 838 | 846 | 192.1 |
| D | 1 | 52 | 352441 | 1777.44 | 838 | 822 | 197.8 |
| D | 2 | 152 | 32184 | 158.54 | 838 | 822 | 197.8 |
| D | 7 | 223 | 22780 | 111.0 | 838 | 822 | 197.8 |
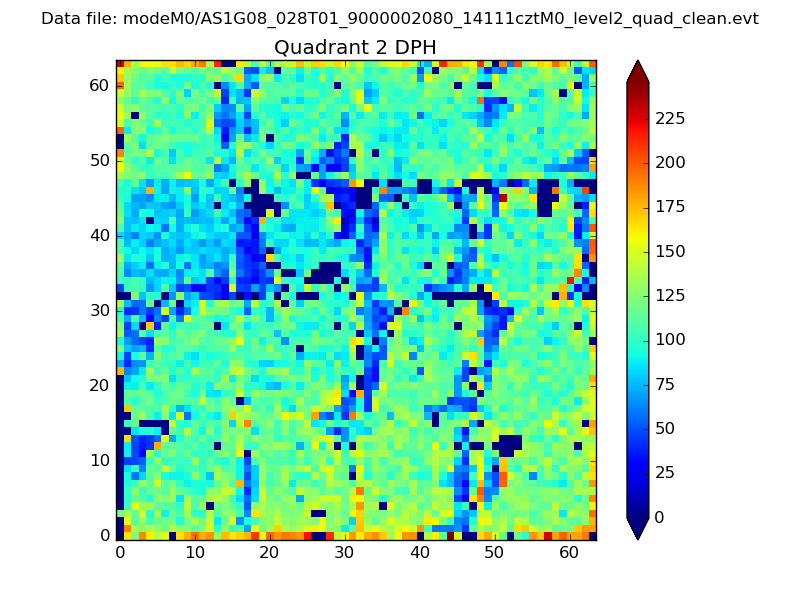
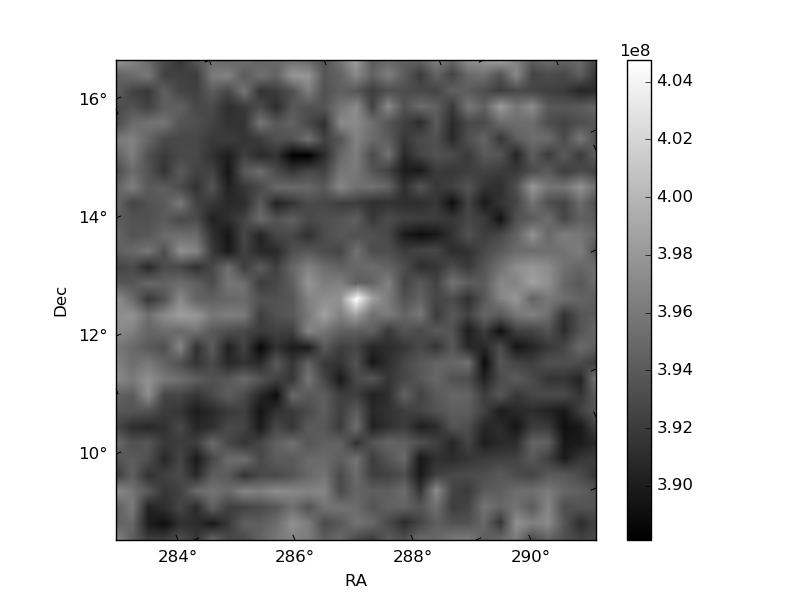
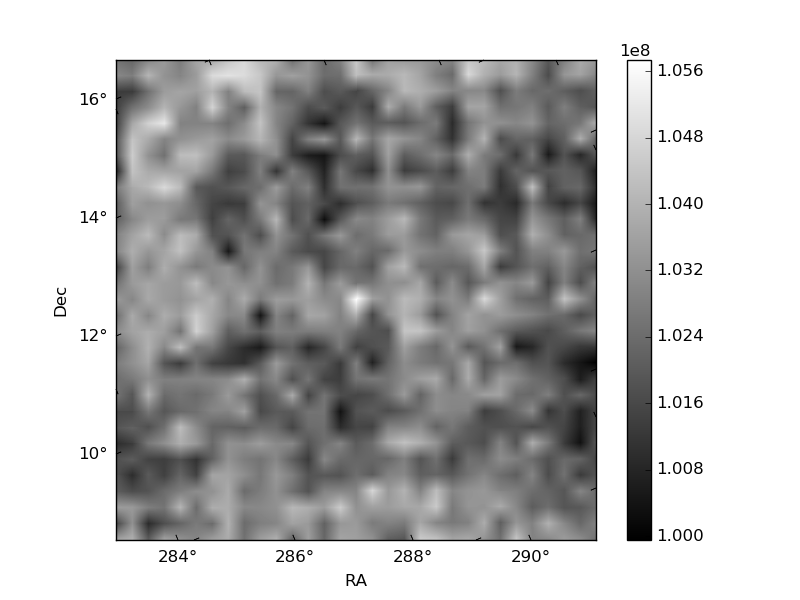
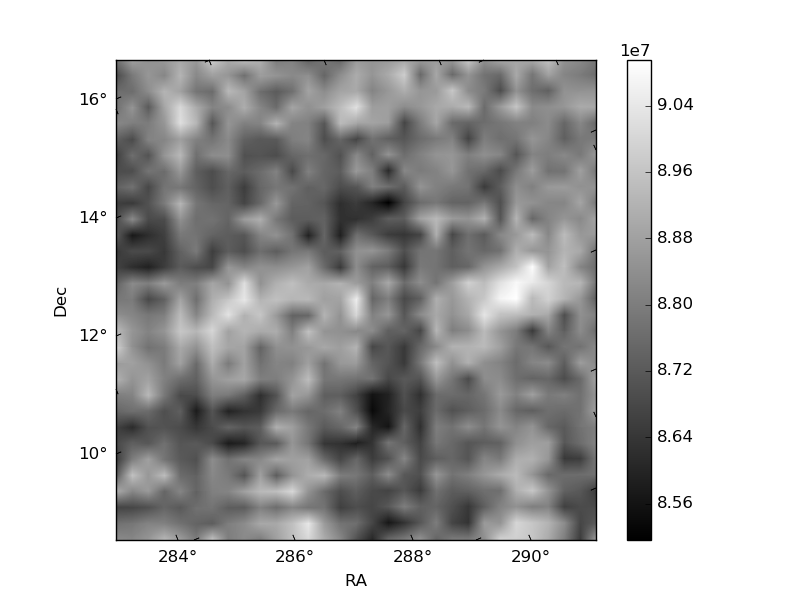
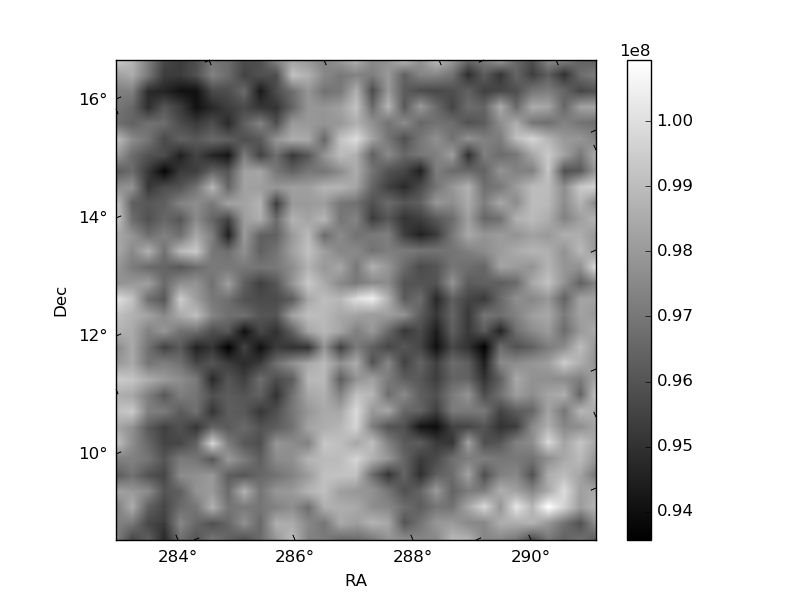
Histogram calculated using DETX and DETY for each event in the final _common_clean file
| Quadrant A | 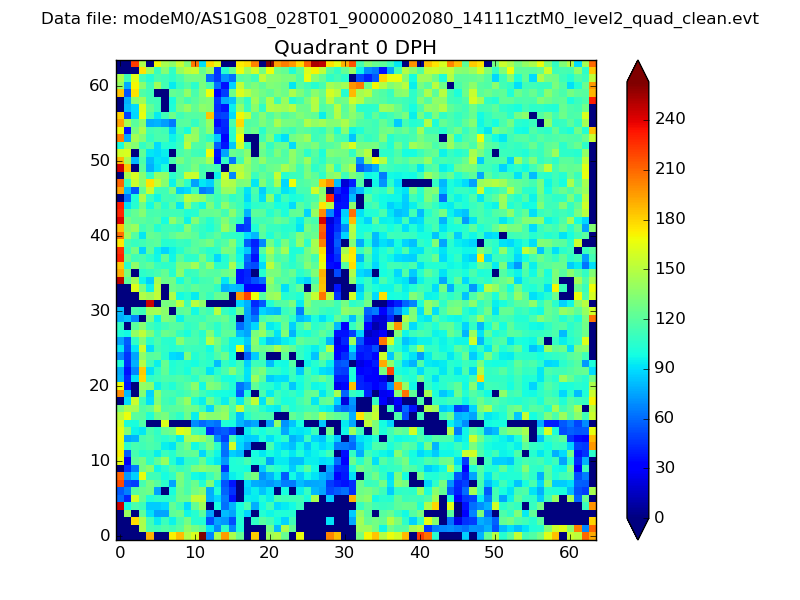 |
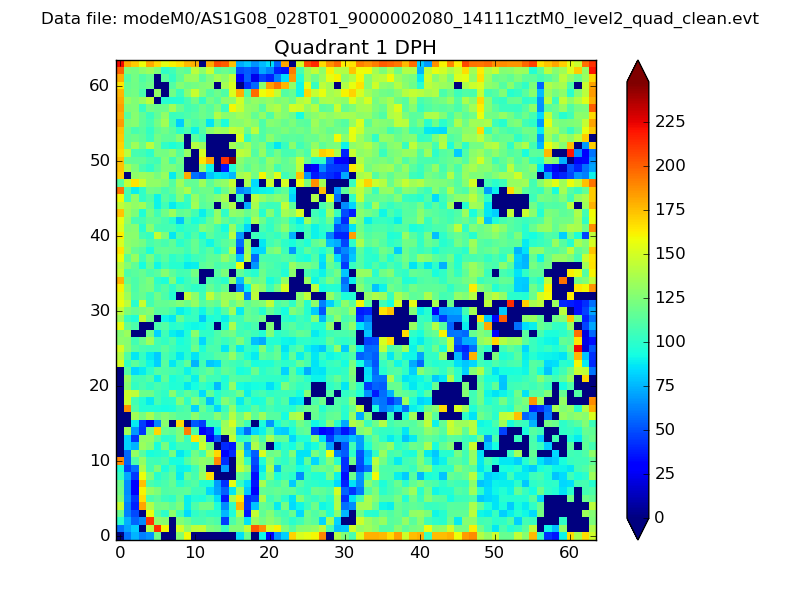 |
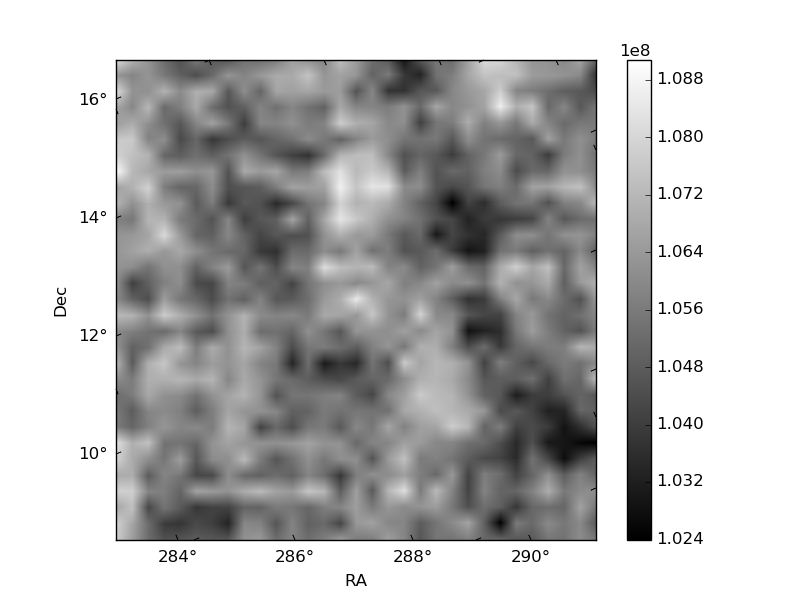
Quadrant B |
|---|---|---|---|
| Quadrant D | 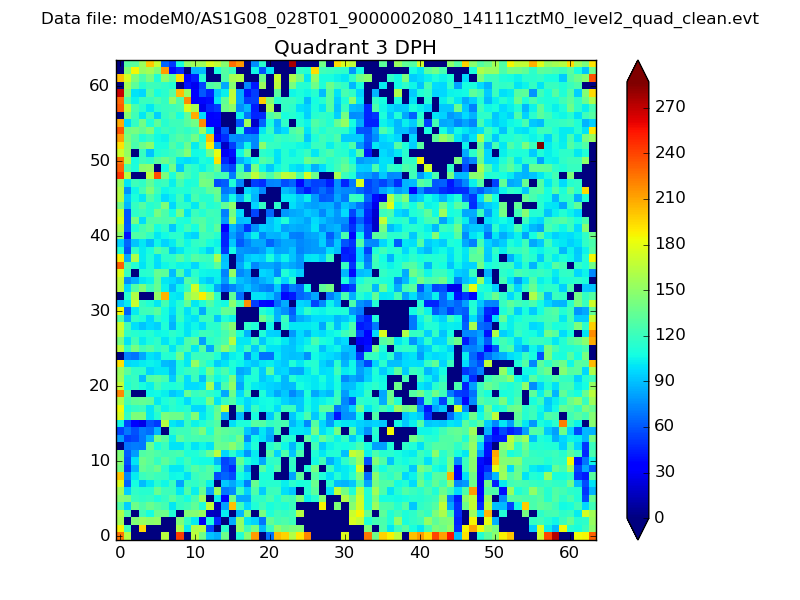 |
 |
Quadrant C |
| Plot type | Count rate plots | Images |
|---|---|---|
| Comparison with Poisson distribution Blue bars denote a histogram of data divided into 1 sec bins. Red curve is a Poisson curve with rate = median count rate of data. |
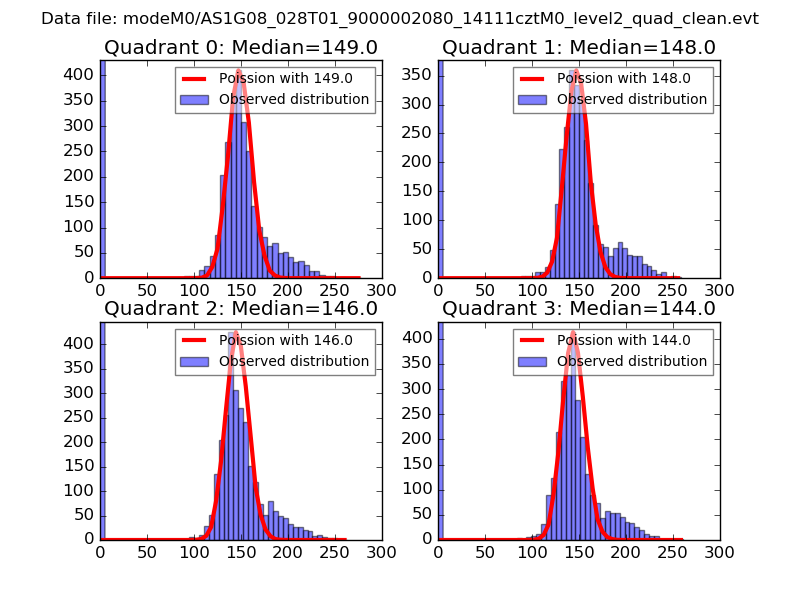 |
 |
| Quadrant-wise count rates Data is divided into 100 sec bins |
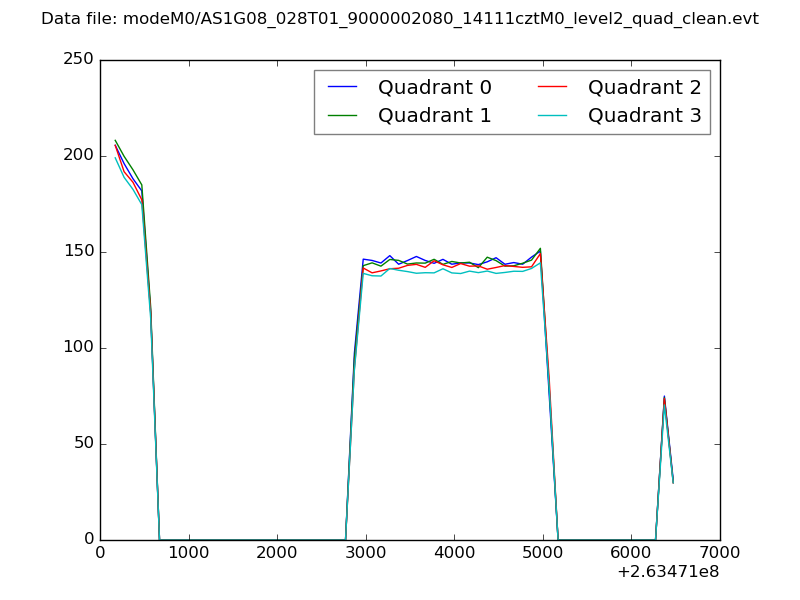 |
|
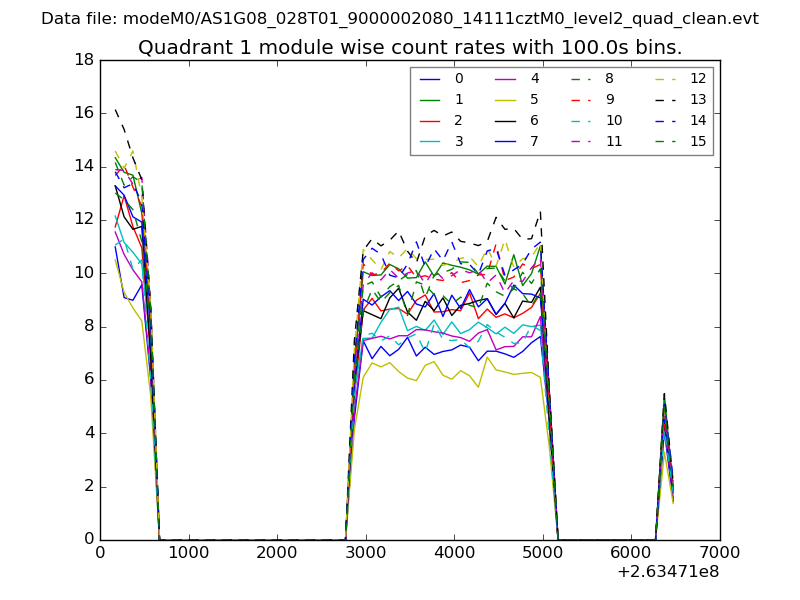
| Module-wise count rates for Quadrant A Data is divided into 100 sec bins |
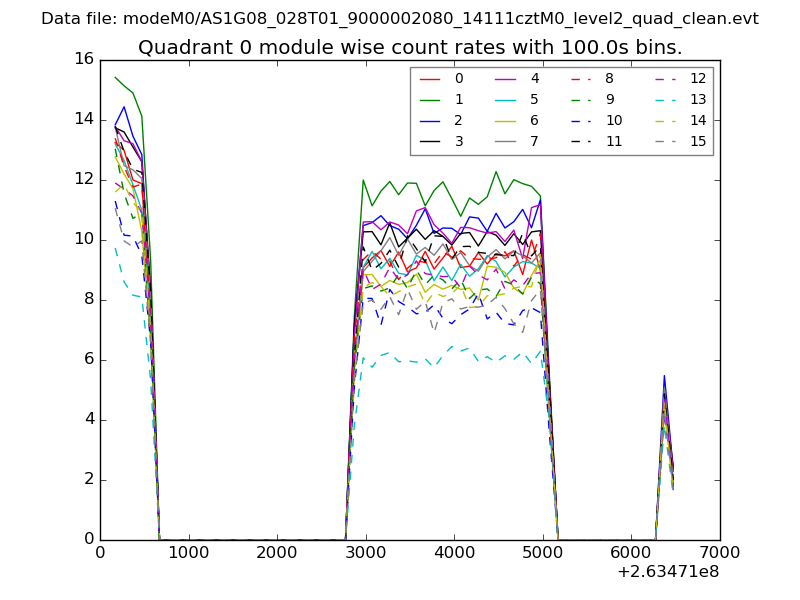 |
 |
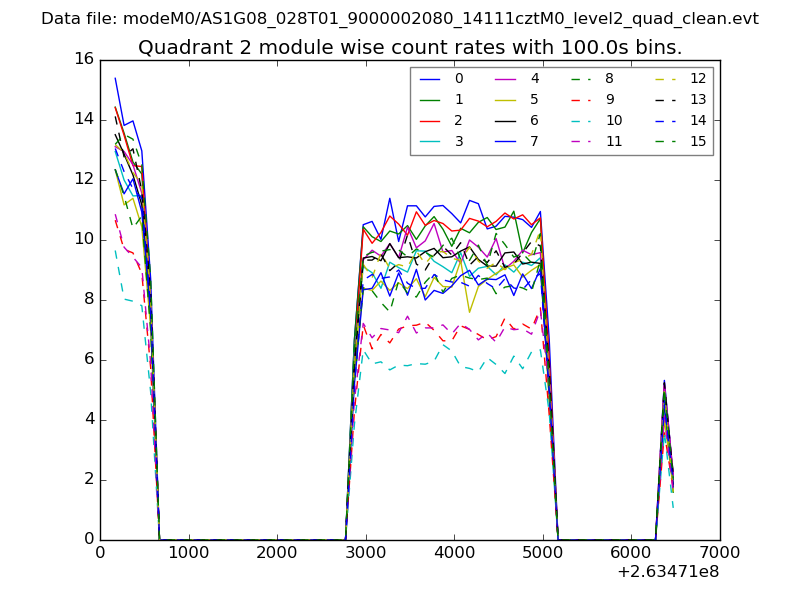
| Module-wise count rates for Quadrant B Data is divided into 100 sec bins |
 |
 |
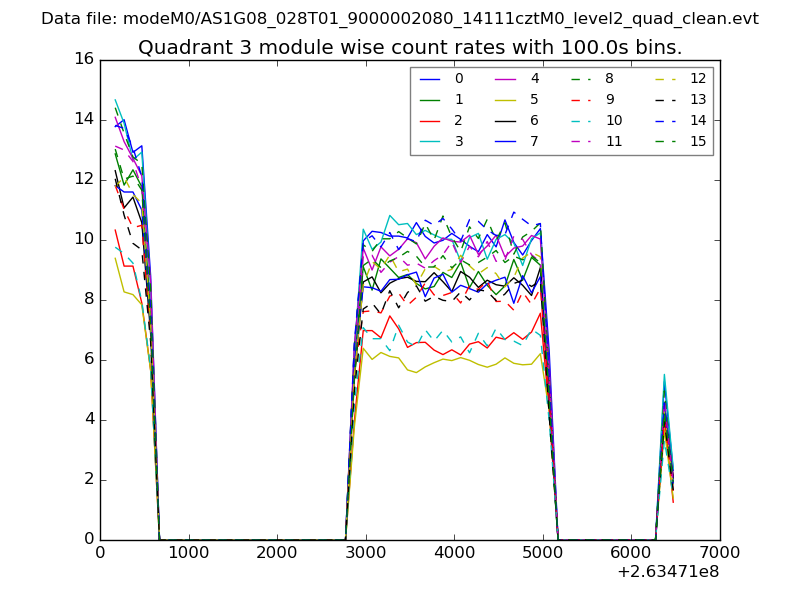
| Module-wise count rates for Quadrant C Data is divided into 100 sec bins |
 |
 |
| Module-wise count rates for Quadrant D Data is divided into 100 sec bins |
 |
 |
| Parameter | Plot |
|---|---|
| CZT HV Monitor | 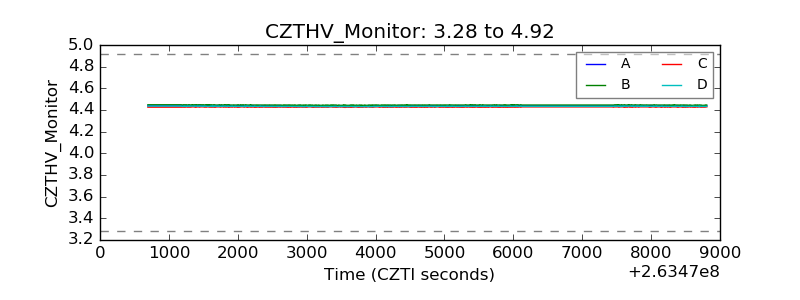 |
| D_VDD | 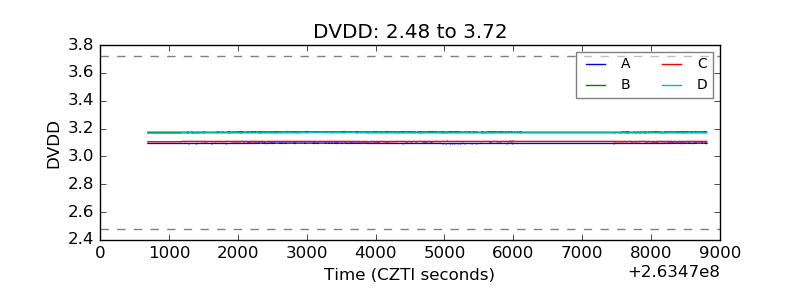 |
| Temperature 1 | 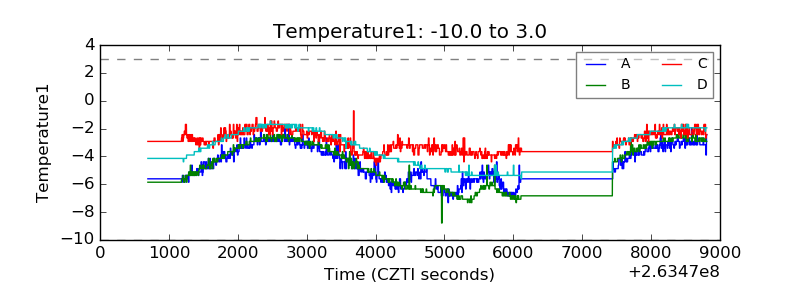 |
| Veto HV Monitor | 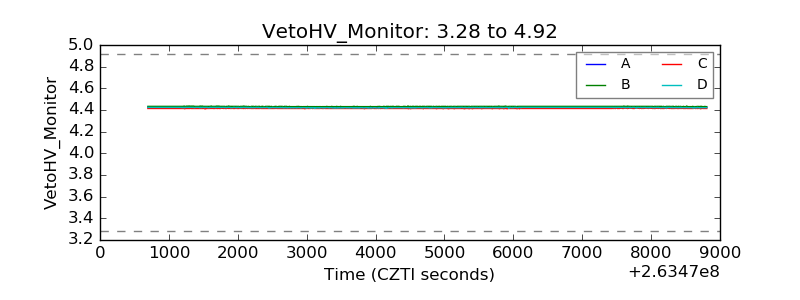 |
| Veto LLD | 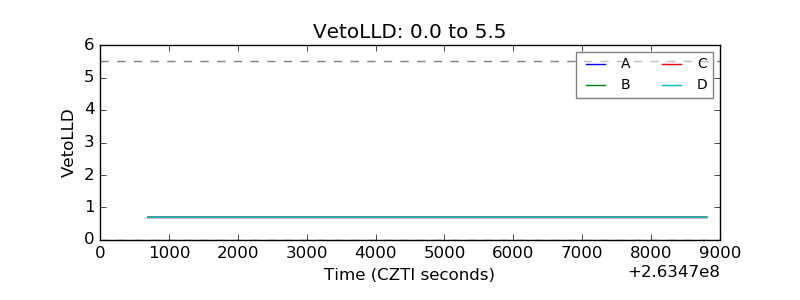 |
| Alpha Counter | 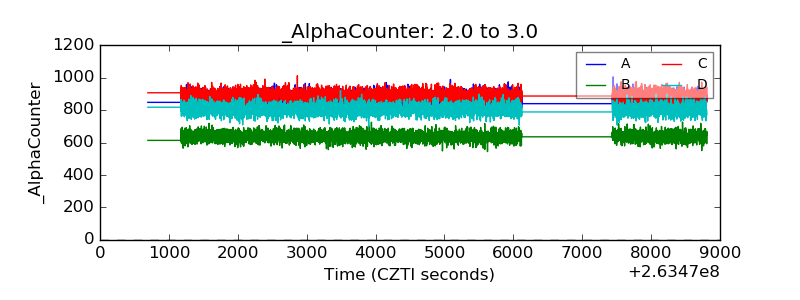 |
| _CPM_Rate | 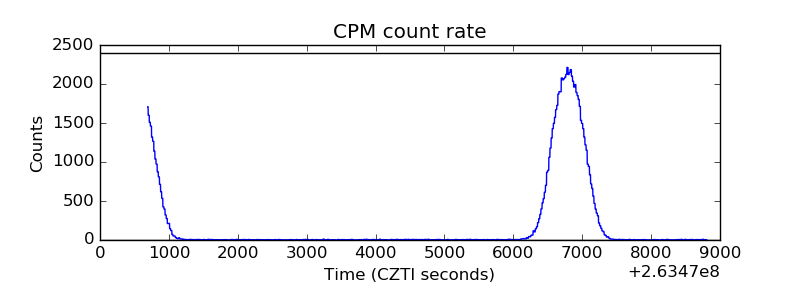 |
| CZT Counter | 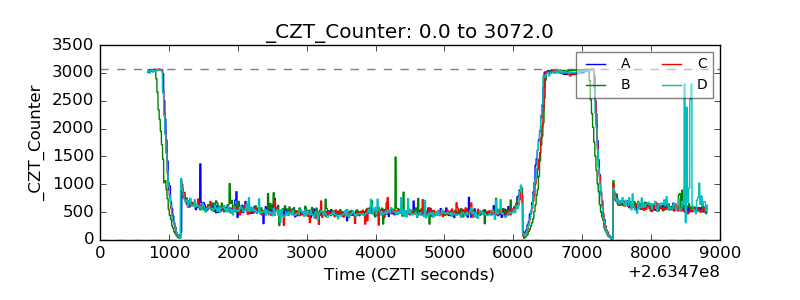 |
| +2.5 Volts monitor | 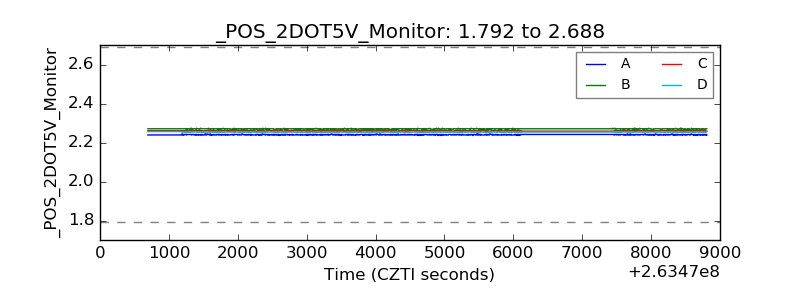 |
| +5 Volts monitor | 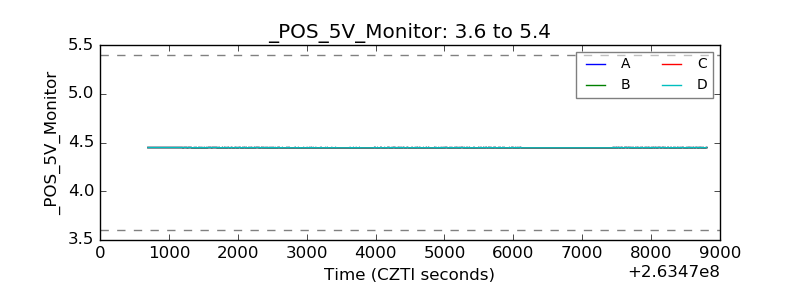 |
| _ROLL_ROT | 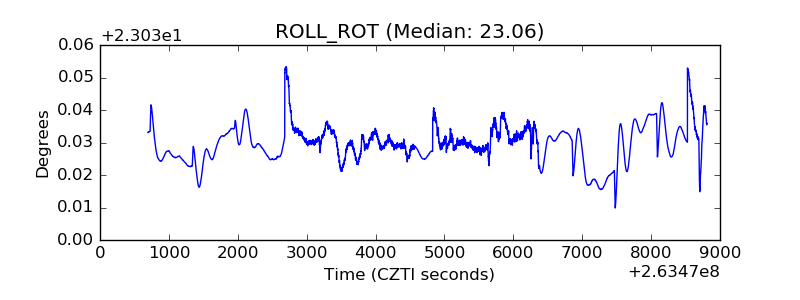 |
| _Roll_DEC | 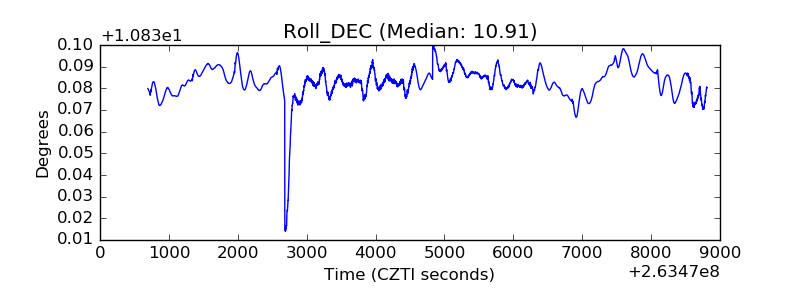 |
| _Roll_RA | 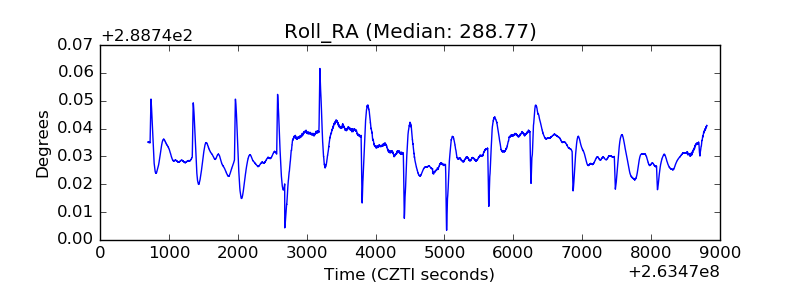 |
| Veto Counter | 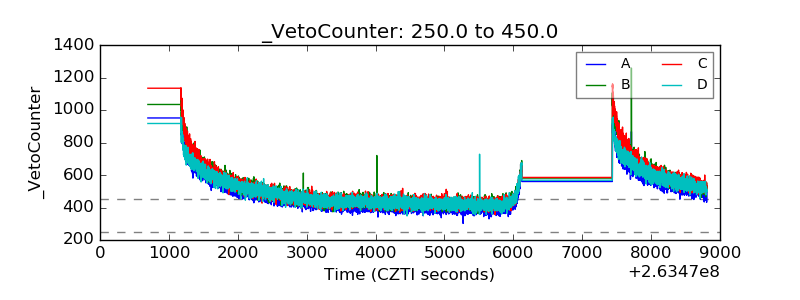 |