| Param | Original file | Final file |
|---|---|---|
| Filename | modeM0/AS1G08_028T01_9000002080_14113cztM0_level2.evt | modeM0/AS1G08_028T01_9000002080_14113cztM0_level2_quad_clean.evt |
| Size (bytes) | 484,202,880 | 73,422,720 |
| Size | 461.8 MB | 70.0 MB |
| Events in quadrant A | 3,393,911 | 452,052 |
| Events in quadrant B | 3,610,527 | 451,030 |
| Events in quadrant C | 3,464,225 | 446,847 |
| Events in quadrant D | 3,770,589 | 436,237 |
| Mode M0 | |||
|---|---|---|---|
| Quadrant | BADHDUFLAG | Total packets | Discarded packets |
| A | 0 | 13938 | 3 |
| B | 0 | 14678 | 2 |
| C | 0 | 13923 | 2 |
| D | 0 | 15287 | 2 |
| Mode M9 | |||
|---|---|---|---|
| Quadrant | BADHDUFLAG | Total packets | Discarded packets |
| A | 0 | 15 | 0 |
| B | 0 | 15 | 0 |
| C | 0 | 15 | 0 |
| D | 0 | 16 | 0 |
| Mode SS | |||
|---|---|---|---|
| Quadrant | BADHDUFLAG | Total packets | Discarded packets |
| A | 0 | 128 | 0 |
| B | 0 | 128 | 0 |
| C | 0 | 128 | 0 |
| D | 0 | 128 | 0 |
| Quadrant | Total seconds | Saturated seconds | Saturation percentage |
|---|---|---|---|
| A | 6258 | 121 | 1.933525% |
| B | 6258 | 149 | 2.380952% |
| C | 6258 | 97 | 1.550016% |
| D | 6258 | 101 | 1.613934% |
Noise dominated data is calculated using 1-second bins in cleaned event files. If a bin has >2000 counts, and if more than 50% of those come from <1% of pixels, then it is considered to be noise-dominated and hence unusable.
| Quadrant | # 1 sec bins | Bins with >0 counts | Bins with >2000 counts | High rate bins dominated by noise | Noise dominated (total time) | Noise dominated (detector-on time) | Marked lightcurve |
|---|---|---|---|---|---|---|---|
| A | 7544 | 6260 | 0 | 0 | 0.00% | 0.00% | 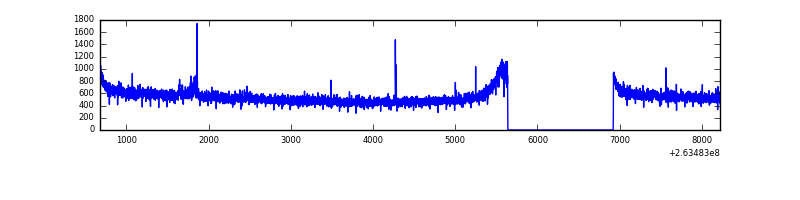 |
| B | 7544 | 6260 | 8 | 8 | 0.11% | 0.13% | 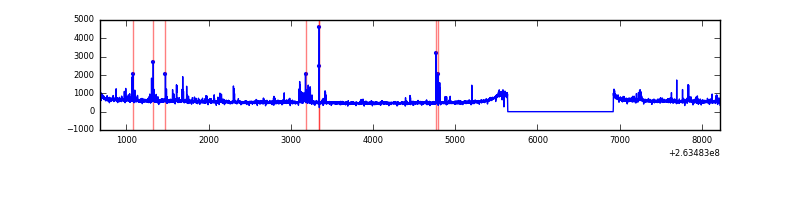 |
| C | 7544 | 6260 | 0 | 0 | 0.00% | 0.00% | 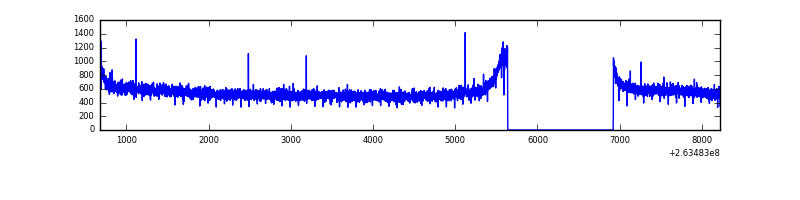 |
| D | 7544 | 6260 | 3 | 3 | 0.04% | 0.05% | 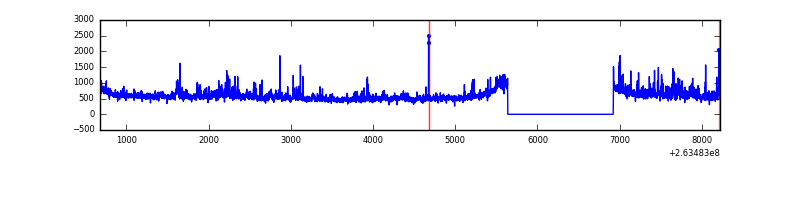 |
Top three noisy pixels from each quadrant. If the there are fewer than three noisy pixels in the level2.evt file, extra rows are filled as -1
| Pixel properties | Quadrant properties | ||||||
|---|---|---|---|---|---|---|---|
| Quadrant | DetID | PixID | Counts | Sigma | Mean | Median | Sigma |
| A | 8 | 15 | 32150 | 179.19 | 872 | 855 | 174.6 |
| A | 0 | 226 | 7563 | 38.41 | 872 | 855 | 174.6 |
| A | 12 | 194 | 6629 | 33.06 | 872 | 855 | 174.6 |
| B | 0 | 85 | 75548 | 457.34 | 865 | 846 | 163.3 |
| B | 0 | 189 | 66380 | 401.21 | 865 | 846 | 163.3 |
| B | 10 | 16 | 40276 | 241.4 | 865 | 846 | 163.3 |
| C | 3 | 233 | 141312 | 719.47 | 848 | 857 | 195.2 |
| C | 8 | 128 | 8001 | 36.59 | 848 | 857 | 195.2 |
| C | 13 | 61 | 6137 | 27.05 | 848 | 857 | 195.2 |
| D | 1 | 52 | 216908 | 1077.35 | 848 | 830 | 200.6 |
| D | 2 | 152 | 184156 | 914.05 | 848 | 830 | 200.6 |
| D | 8 | 195 | 71695 | 353.33 | 848 | 830 | 200.6 |
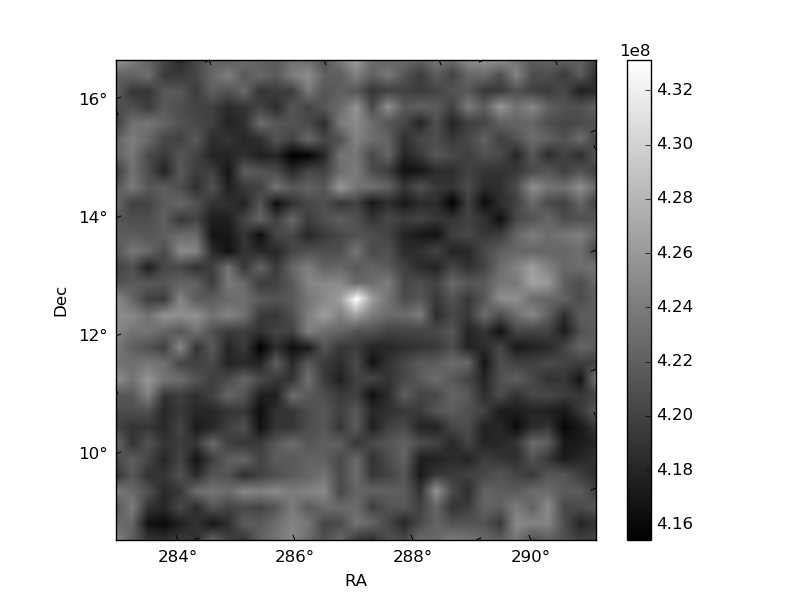
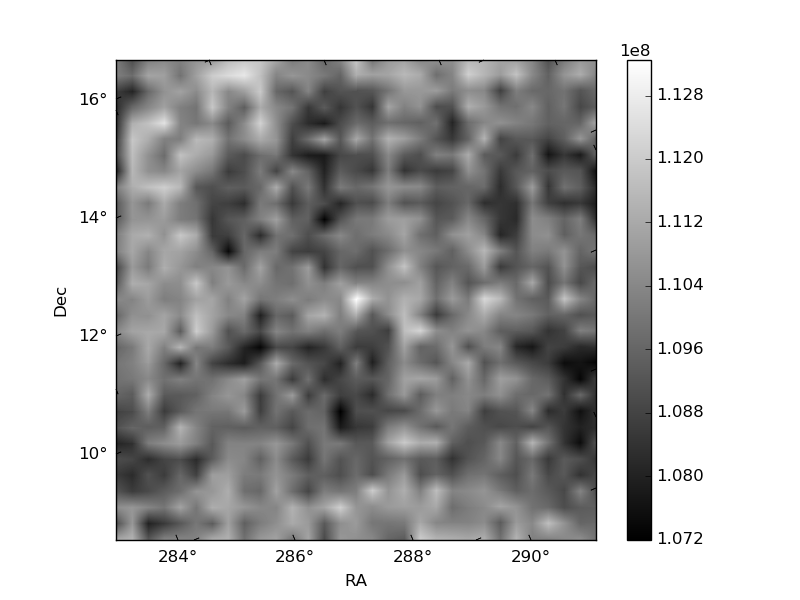
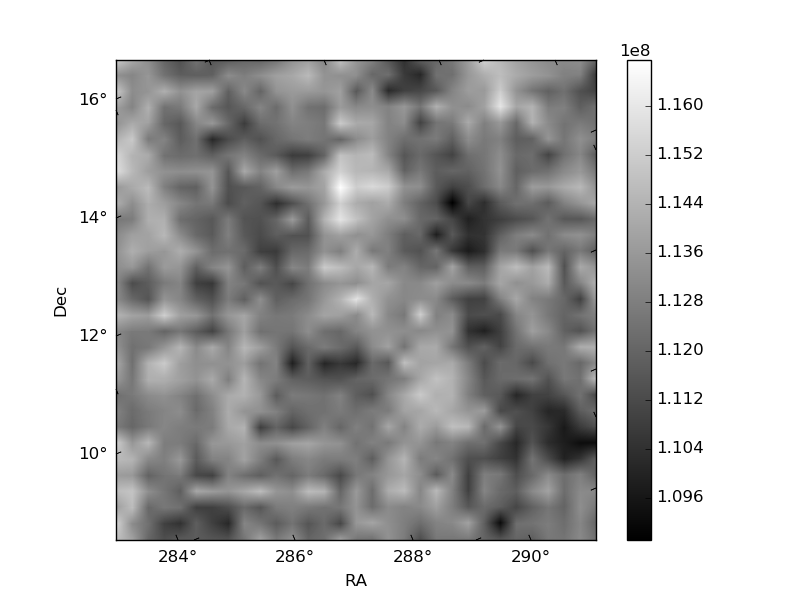
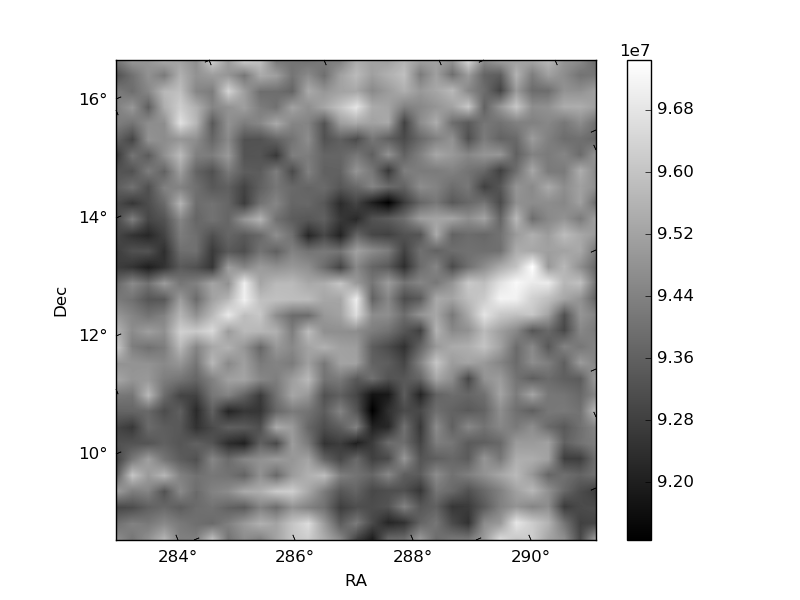
Histogram calculated using DETX and DETY for each event in the final _common_clean file
| Quadrant A | 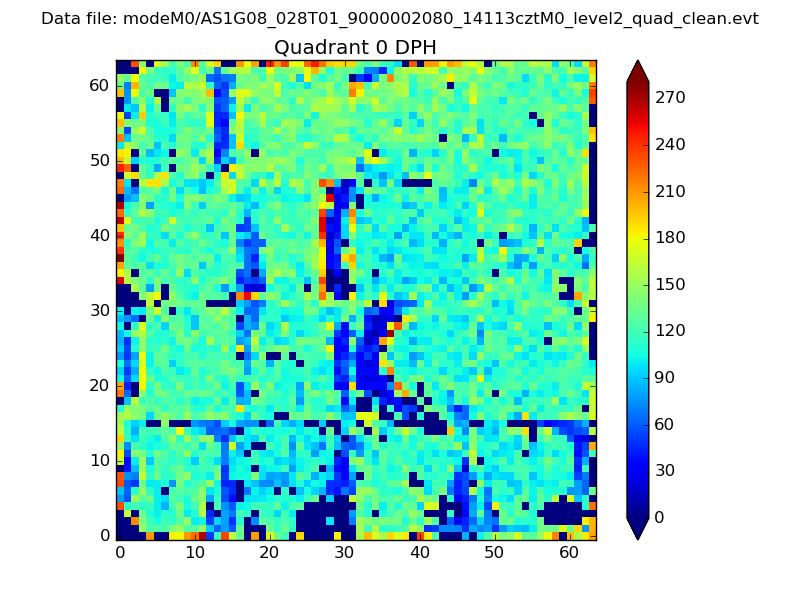 |
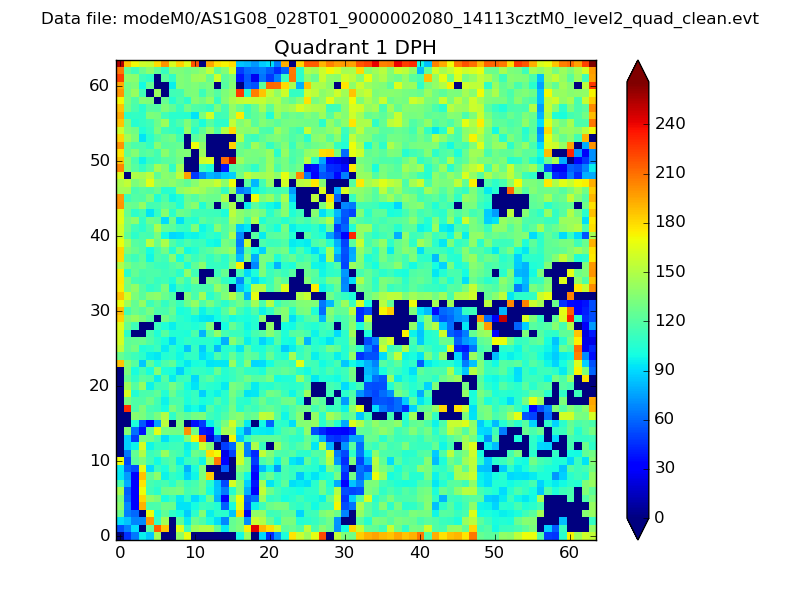 |
Quadrant B |
|---|---|---|---|
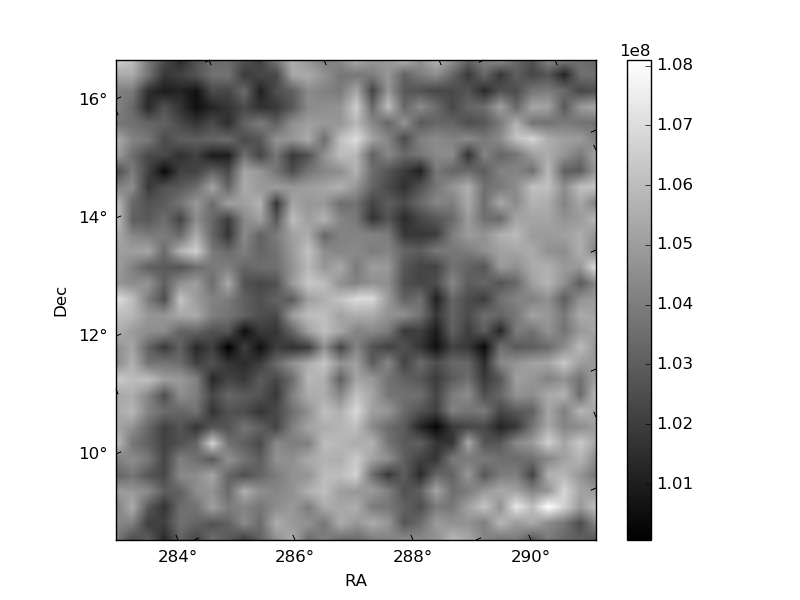
| Quadrant D | 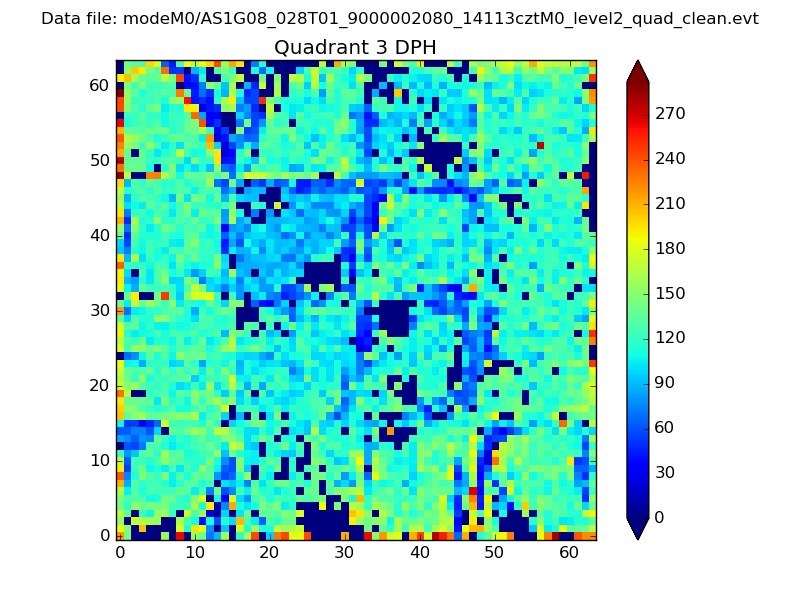 |
 |
Quadrant C |
| Plot type | Count rate plots | Images |
|---|---|---|
| Comparison with Poisson distribution Blue bars denote a histogram of data divided into 1 sec bins. Red curve is a Poisson curve with rate = median count rate of data. |
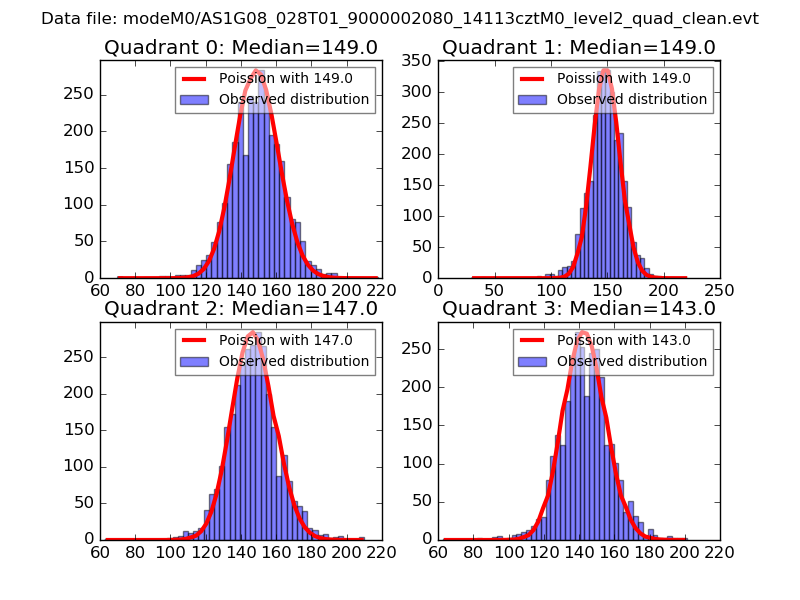 |
 |
| Quadrant-wise count rates Data is divided into 100 sec bins |
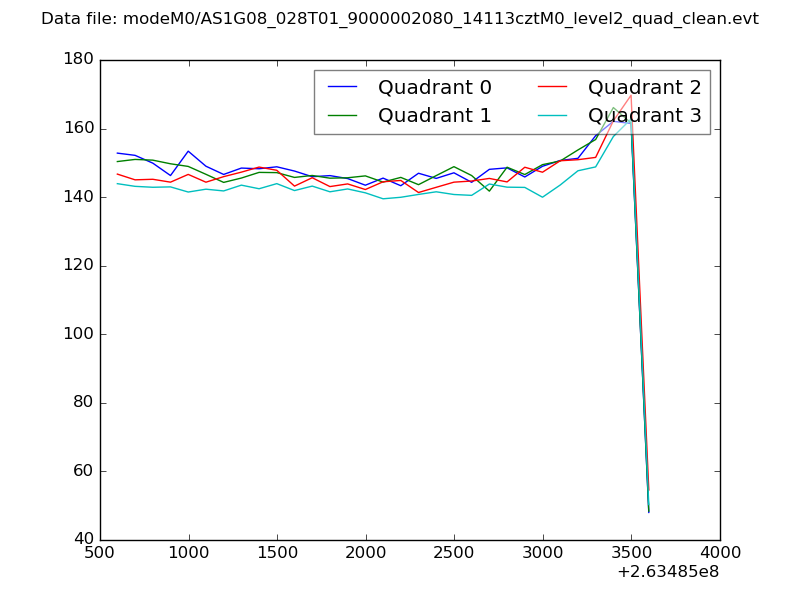 |
|
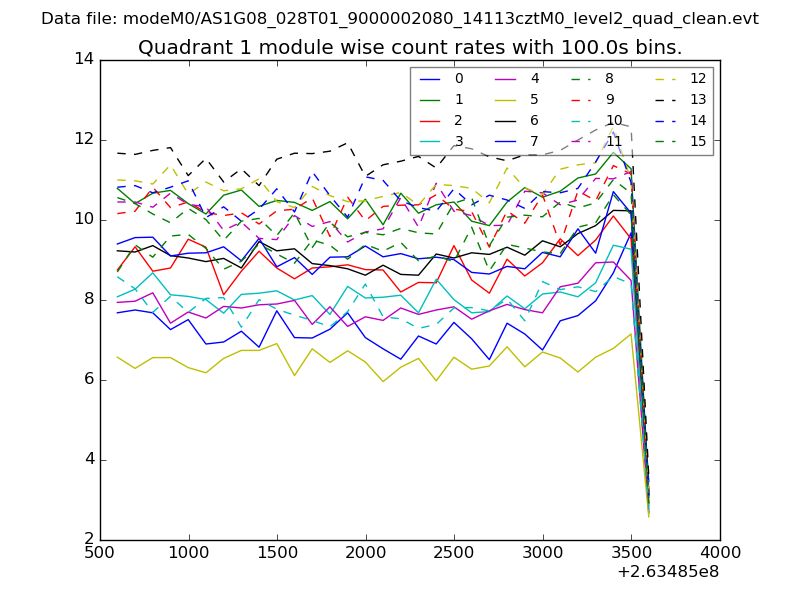
| Module-wise count rates for Quadrant A Data is divided into 100 sec bins |
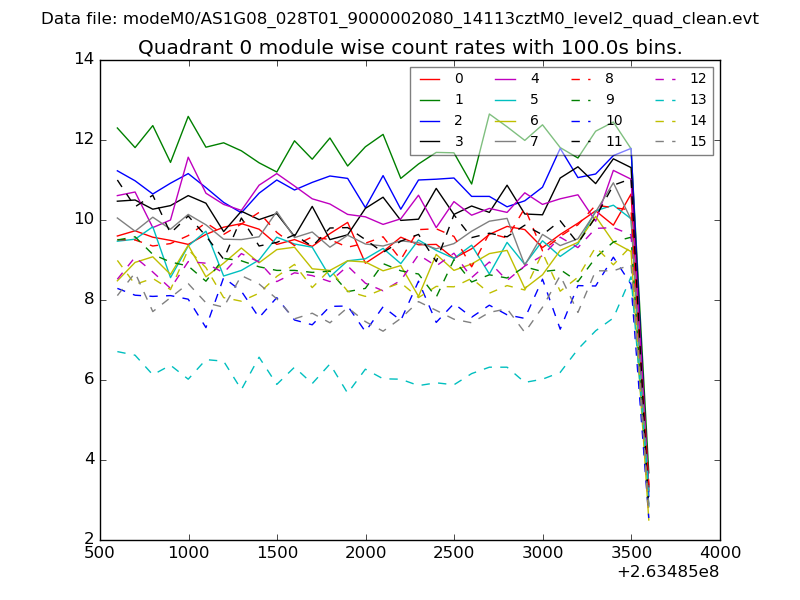 |
 |
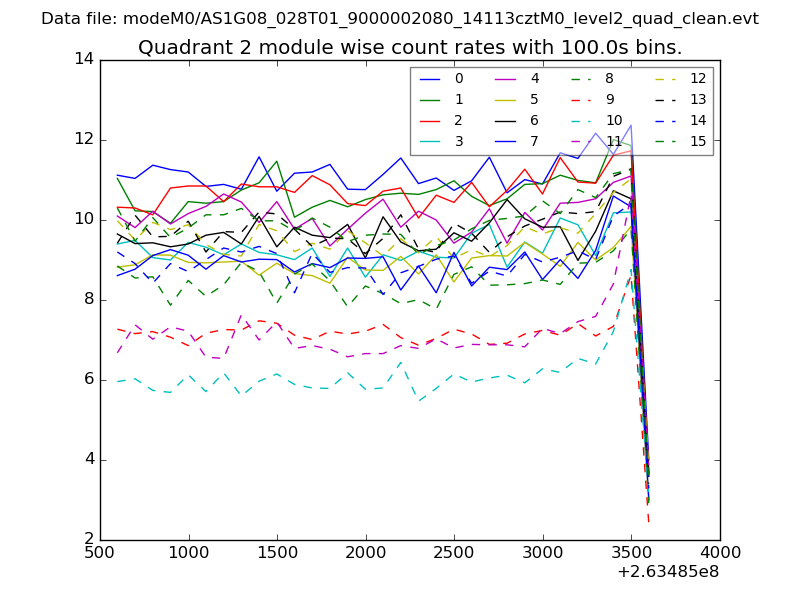
| Module-wise count rates for Quadrant B Data is divided into 100 sec bins |
 |
 |
| Module-wise count rates for Quadrant C Data is divided into 100 sec bins |
 |
 |
| Module-wise count rates for Quadrant D Data is divided into 100 sec bins |
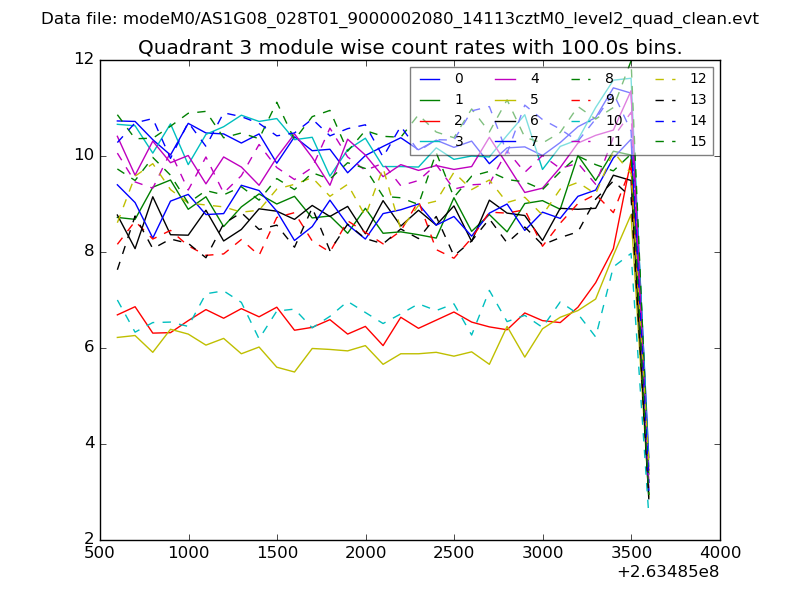 |
 |
| Parameter | Plot |
|---|---|
| CZT HV Monitor | 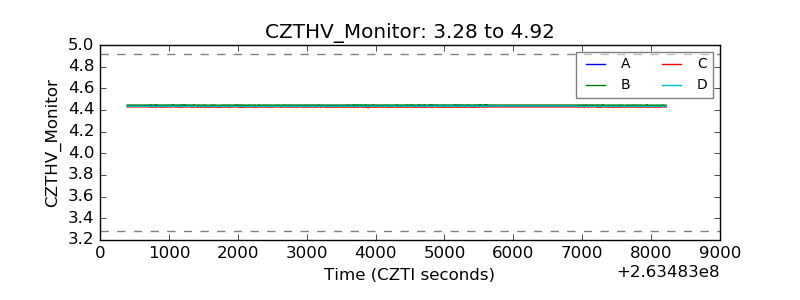 |
| D_VDD | 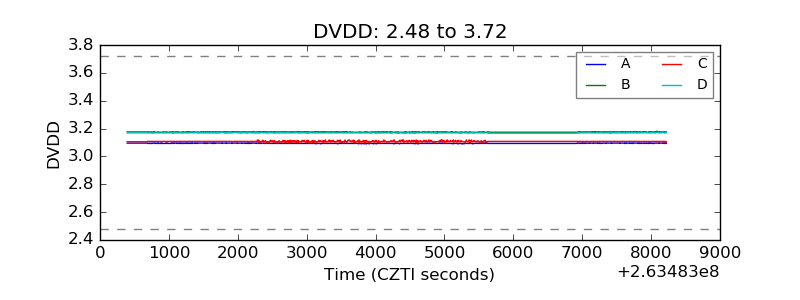 |
| Temperature 1 |  |
| Veto HV Monitor |  |
| Veto LLD | 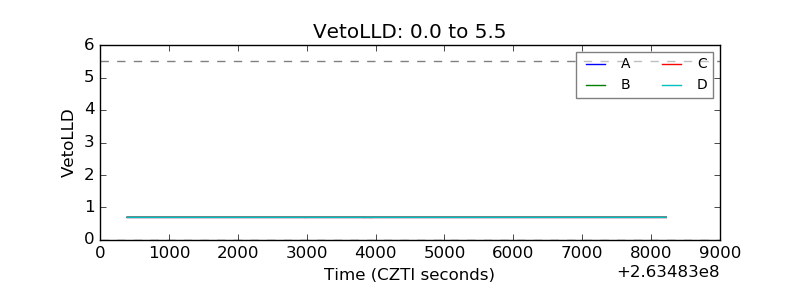 |
| Alpha Counter | 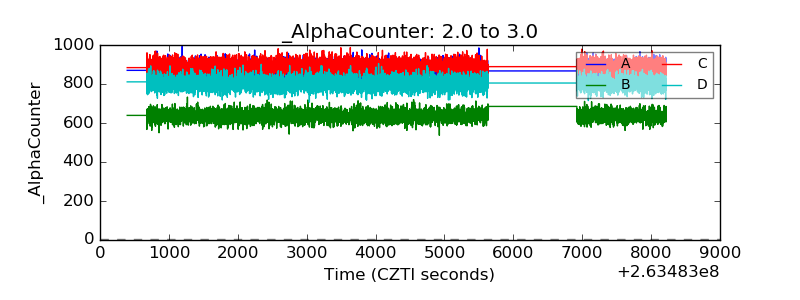 |
| _CPM_Rate | 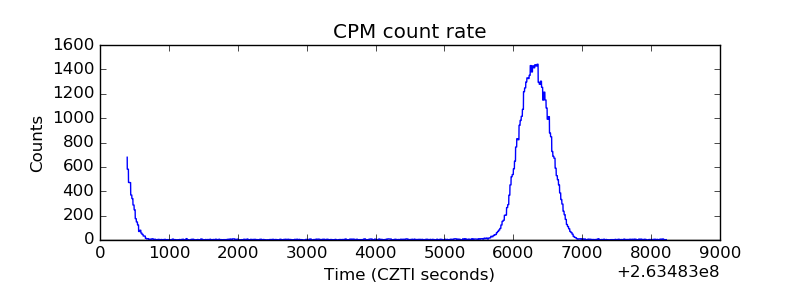 |
| CZT Counter | 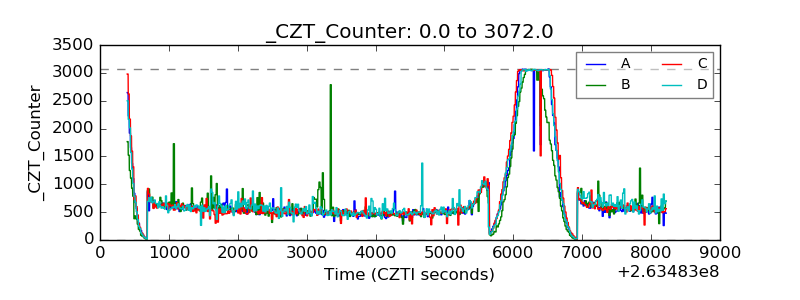 |
| +2.5 Volts monitor |  |
| +5 Volts monitor |  |
| _ROLL_ROT | 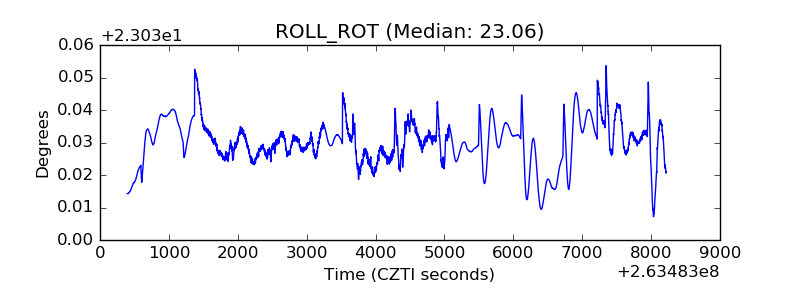 |
| _Roll_DEC | 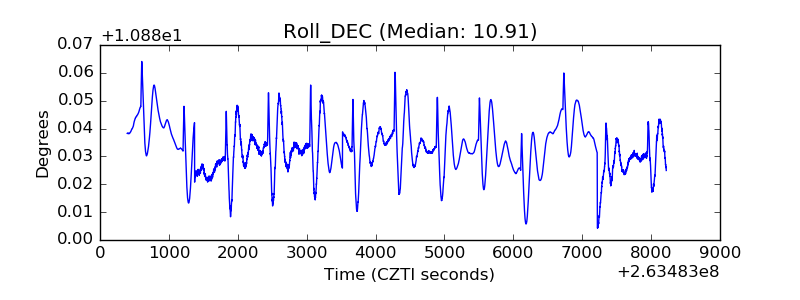 |
| _Roll_RA | 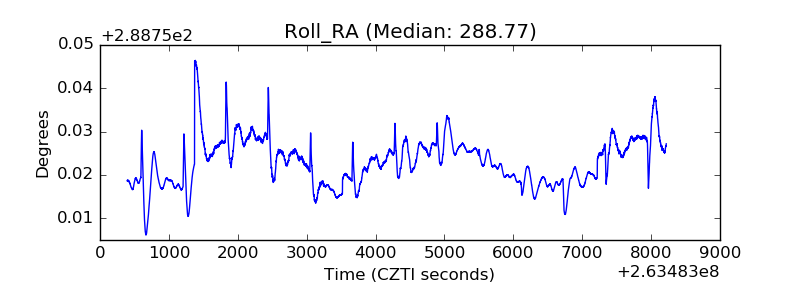 |
| Veto Counter | 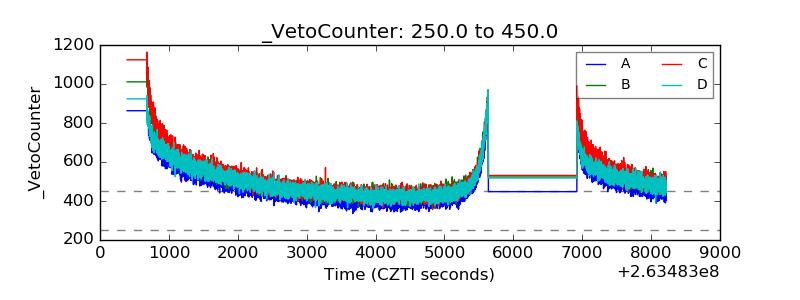 |