| Param | Original file | Final file |
|---|---|---|
| Filename | modeM0/AS1A04_218T04_9000002086cztM0_level2.fits | modeM0/AS1A04_218T04_9000002086cztM0_level2_quad_clean.evt |
| Size (bytes) | 623,744,640 | 574,295,040 |
| Size | 594.8 MB | 547.7 MB |
| Events in quadrant A | 3,867,018 | 3,385,480 |
| Events in quadrant B | 3,693,738 | 3,326,589 |
| Events in quadrant C | 3,793,162 | 3,336,654 |
| Events in quadrant D | 3,160,558 | 2,969,817 |
| Mode M0 | |||
|---|---|---|---|
| Quadrant | BADHDUFLAG | Total packets | Discarded packets |
| A | 0 | 133560 | 0 |
| B | 0 | 137169 | 0 |
| C | 0 | 136201 | 0 |
| D | 0 | 200624 | 0 |
| Mode SS | |||
|---|---|---|---|
| Quadrant | BADHDUFLAG | Total packets | Discarded packets |
| A | 0 | 1296 | 0 |
| B | 0 | 1296 | 0 |
| C | 0 | 1296 | 0 |
| D | 0 | 1296 | 0 |
| Mode M9 | |||
|---|---|---|---|
| Quadrant | BADHDUFLAG | Total packets | Discarded packets |
| A | 0 | 94 | 0 |
| B | 0 | 94 | 0 |
| C | 0 | 96 | 0 |
| D | 0 | 96 | 0 |
| Quadrant | Total seconds | Saturated seconds | Saturation percentage |
|---|---|---|---|
| A | 63784 | 775 | 1.215038% |
| B | 63786 | 940 | 1.473678% |
| C | 63779 | 612 | 0.959563% |
| D | 63781 | 5633 | 8.831784% |
Noise dominated data is calculated using 1-second bins in cleaned event files. If a bin has >2000 counts, and if more than 50% of those come from <1% of pixels, then it is considered to be noise-dominated and hence unusable.
| Quadrant | # 1 sec bins | Bins with >0 counts | Bins with >2000 counts | High rate bins dominated by noise | Noise dominated (total time) | Noise dominated (detector-on time) | Marked lightcurve |
|---|---|---|---|---|---|---|---|
| A | 76150 | 63805 | 0 | 0 | 0.00% | 0.00% |  |
| B | 76150 | 63805 | 0 | 0 | 0.00% | 0.00% |  |
| C | 76150 | 63805 | 0 | 0 | 0.00% | 0.00% |  |
| D | 76150 | 63695 | 0 | 0 | 0.00% | 0.00% |  |
Top three noisy pixels from each quadrant. If the there are fewer than three noisy pixels in the level2.evt file, extra rows are filled as -1
| Pixel properties | Quadrant properties | ||||||
|---|---|---|---|---|---|---|---|
| Quadrant | DetID | PixID | Counts | Sigma | Mean | Median | Sigma |
| A | 0 | 29 | 3743 | 11.16 | 1007 | 942 | 251.0 |
| A | 7 | 110 | 3021 | 8.28 | 1007 | 942 | 251.0 |
| A | 9 | 19 | 2808 | 7.43 | 1007 | 942 | 251.0 |
| B | 2 | 9 | 3121 | 11.29 | 974 | 928 | 194.3 |
| B | 3 | 17 | 2443 | 7.8 | 974 | 928 | 194.3 |
| B | 3 | 80 | 2409 | 7.62 | 974 | 928 | 194.3 |
| C | 12 | 241 | 2700 | 6.87 | 1001 | 933 | 257.2 |
| C | 2 | 191 | 2587 | 6.43 | 1001 | 933 | 257.2 |
| C | 3 | 126 | 2529 | 6.21 | 1001 | 933 | 257.2 |
| D | 3 | 14 | 2328 | 6.3 | 901 | 819 | 239.5 |
| D | 6 | 231 | 2292 | 6.15 | 901 | 819 | 239.5 |
| D | 1 | 19 | 2189 | 5.72 | 901 | 819 | 239.5 |
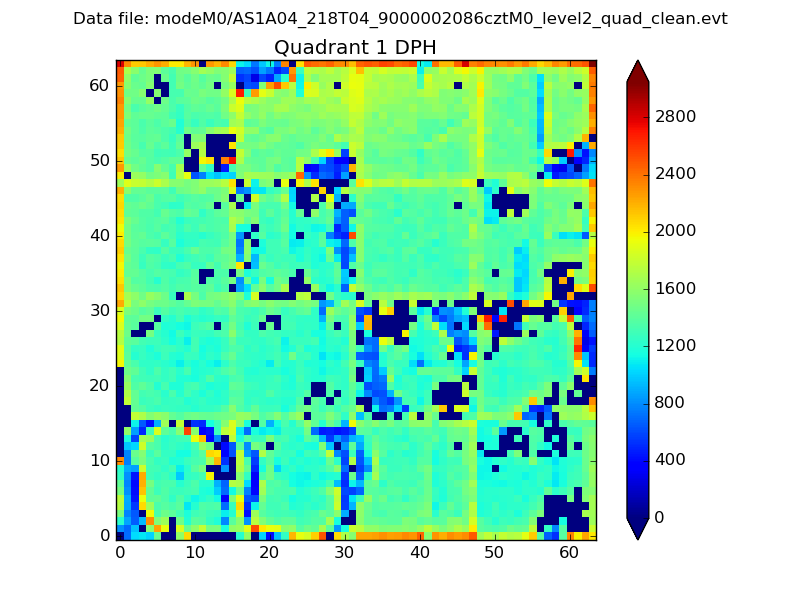
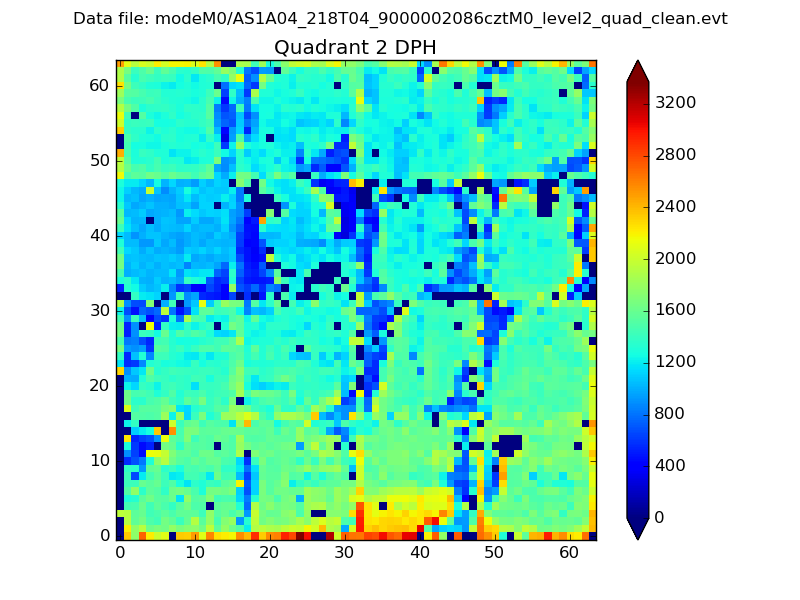
Histogram calculated using DETX and DETY for each event in the final _common_clean file
| Quadrant A |  |
 |
Quadrant B |
|---|---|---|---|
| Quadrant D | 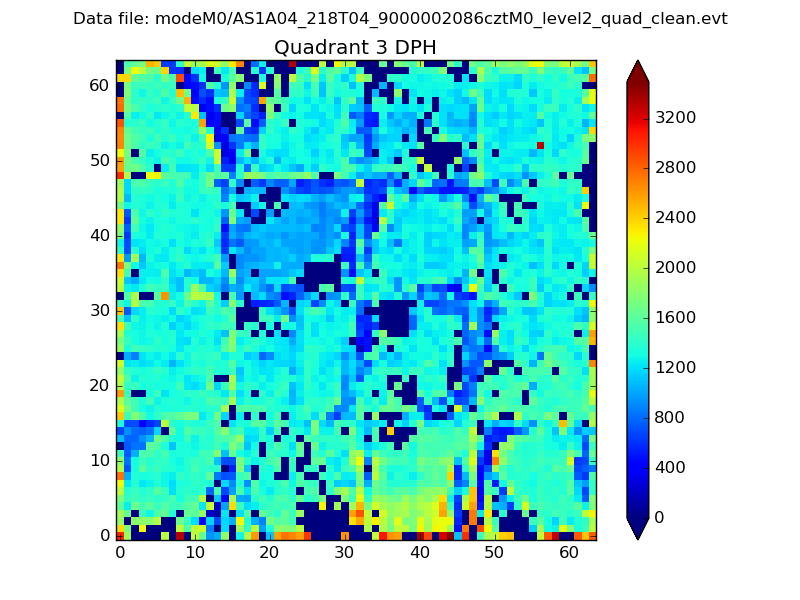 |
 |
Quadrant C |
| Plot type | Count rate plots | Images |
|---|---|---|
| Comparison with Poisson distribution Blue bars denote a histogram of data divided into 1 sec bins. Red curve is a Poisson curve with rate = median count rate of data. |
 |
 |
| Quadrant-wise count rates Data is divided into 100 sec bins |
 |
|
| Module-wise count rates for Quadrant A Data is divided into 100 sec bins |
 |
 |
| Module-wise count rates for Quadrant B Data is divided into 100 sec bins |
 |
 |
| Module-wise count rates for Quadrant C Data is divided into 100 sec bins |
 |
 |
| Module-wise count rates for Quadrant D Data is divided into 100 sec bins |
 |
 |
| Parameter | Plot |
|---|---|
| CZT HV Monitor |  |
| D_VDD |  |
| Temperature 1 |  |
| Veto HV Monitor |  |
| Veto LLD |  |
| Alpha Counter |  |
| _CPM_Rate |  |
| CZT Counter |  |
| +2.5 Volts monitor |  |
| +5 Volts monitor |  |
| _ROLL_ROT |  |
| _Roll_DEC |  |
| _Roll_RA |  |
| Veto Counter |  |