| Param | Original file | Final file |
|---|---|---|
| Filename | modeM0/AS1A04_218T04_9000002086_14131cztM0_level2.evt | modeM0/AS1A04_218T04_9000002086_14131cztM0_level2_quad_clean.evt |
| Size (bytes) | 380,784,960 | 65,629,440 |
| Size | 363.1 MB | 62.6 MB |
| Events in quadrant A | 2,448,356 | 406,175 |
| Events in quadrant B | 2,612,075 | 404,499 |
| Events in quadrant C | 2,672,885 | 416,899 |
| Events in quadrant D | 3,448,143 | 398,566 |
| Mode M0 | |||
|---|---|---|---|
| Quadrant | BADHDUFLAG | Total packets | Discarded packets |
| A | 0 | 10734 | 2 |
| B | 0 | 11164 | 1 |
| C | 0 | 11023 | 1 |
| D | 0 | 13640 | 1 |
| Mode SS | |||
|---|---|---|---|
| Quadrant | BADHDUFLAG | Total packets | Discarded packets |
| A | 0 | 106 | 0 |
| B | 0 | 106 | 0 |
| C | 0 | 106 | 0 |
| D | 0 | 106 | 0 |
| Mode M9 | |||
|---|---|---|---|
| Quadrant | BADHDUFLAG | Total packets | Discarded packets |
| A | 0 | 2 | 0 |
| B | 0 | 2 | 0 |
| C | 0 | 2 | 0 |
| D | 0 | 2 | 0 |
| Quadrant | Total seconds | Saturated seconds | Saturation percentage |
|---|---|---|---|
| A | 5149 | 44 | 0.854535% |
| B | 5149 | 107 | 2.078073% |
| C | 5149 | 46 | 0.893377% |
| D | 5149 | 208 | 4.039619% |
Noise dominated data is calculated using 1-second bins in cleaned event files. If a bin has >2000 counts, and if more than 50% of those come from <1% of pixels, then it is considered to be noise-dominated and hence unusable.
| Quadrant | # 1 sec bins | Bins with >0 counts | Bins with >2000 counts | High rate bins dominated by noise | Noise dominated (total time) | Noise dominated (detector-on time) | Marked lightcurve |
|---|---|---|---|---|---|---|---|
| A | 5380 | 5151 | 0 | 0 | 0.00% | 0.00% | 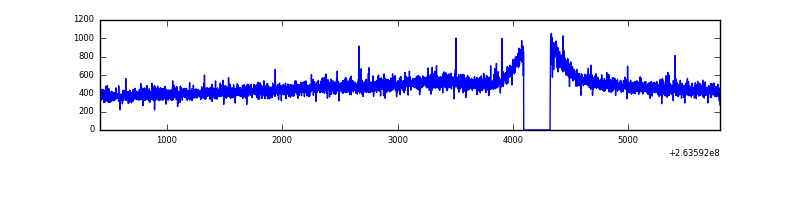 |
| B | 5380 | 5151 | 0 | 0 | 0.00% | 0.00% | 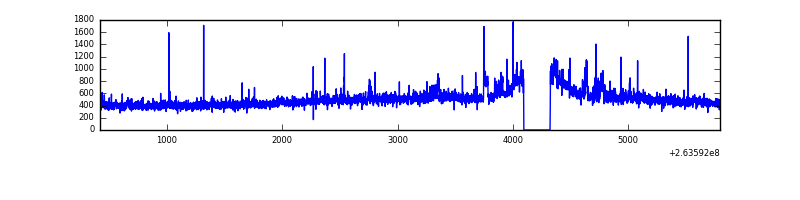 |
| C | 5380 | 5151 | 2 | 2 | 0.04% | 0.04% | 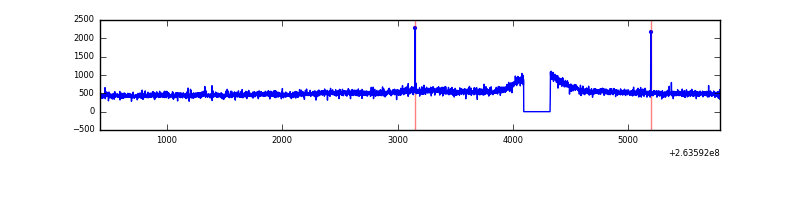 |
| D | 5380 | 5151 | 79 | 79 | 1.47% | 1.53% | 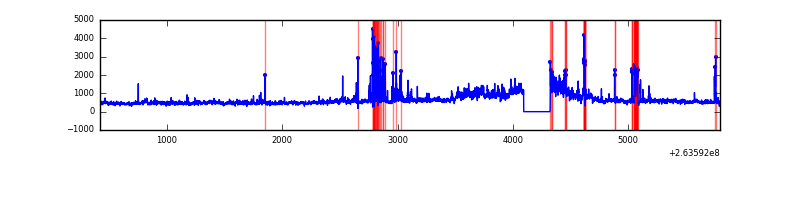 |
Top three noisy pixels from each quadrant. If the there are fewer than three noisy pixels in the level2.evt file, extra rows are filled as -1
| Pixel properties | Quadrant properties | ||||||
|---|---|---|---|---|---|---|---|
| Quadrant | DetID | PixID | Counts | Sigma | Mean | Median | Sigma |
| A | 0 | 226 | 5586 | 38.06 | 635 | 621 | 130.5 |
| A | 12 | 194 | 4771 | 31.81 | 635 | 621 | 130.5 |
| A | 3 | 137 | 4191 | 27.36 | 635 | 621 | 130.5 |
| B | 0 | 85 | 38833 | 308.13 | 632 | 614 | 124.0 |
| B | 0 | 189 | 37686 | 298.88 | 632 | 614 | 124.0 |
| B | 3 | 209 | 23888 | 187.64 | 632 | 614 | 124.0 |
| C | 3 | 233 | 242865 | 1652.14 | 619 | 621 | 146.6 |
| C | 10 | 22 | 11217 | 72.27 | 619 | 621 | 146.6 |
| C | 0 | 207 | 5163 | 30.98 | 619 | 621 | 146.6 |
| D | 1 | 52 | 424477 | 2890.03 | 607 | 591 | 146.7 |
| D | 8 | 195 | 371537 | 2529.09 | 607 | 591 | 146.7 |
| D | 7 | 80 | 187928 | 1277.25 | 607 | 591 | 146.7 |
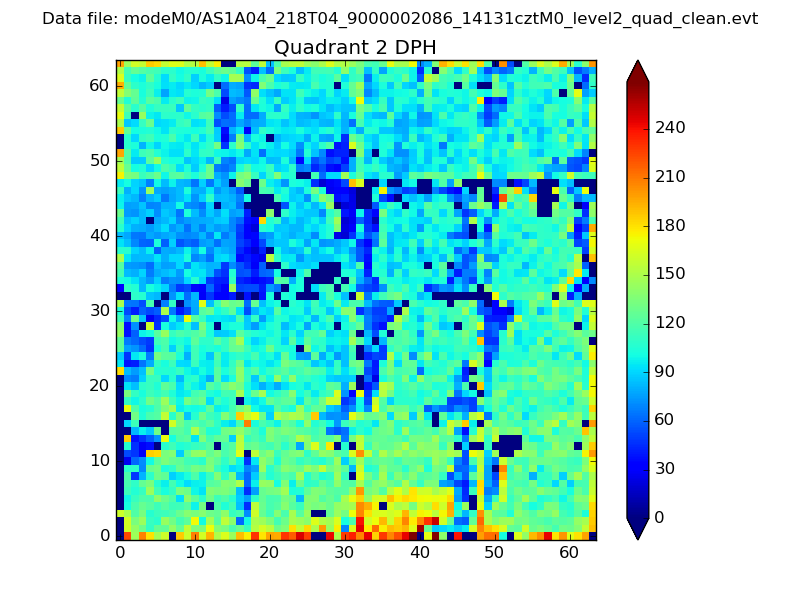
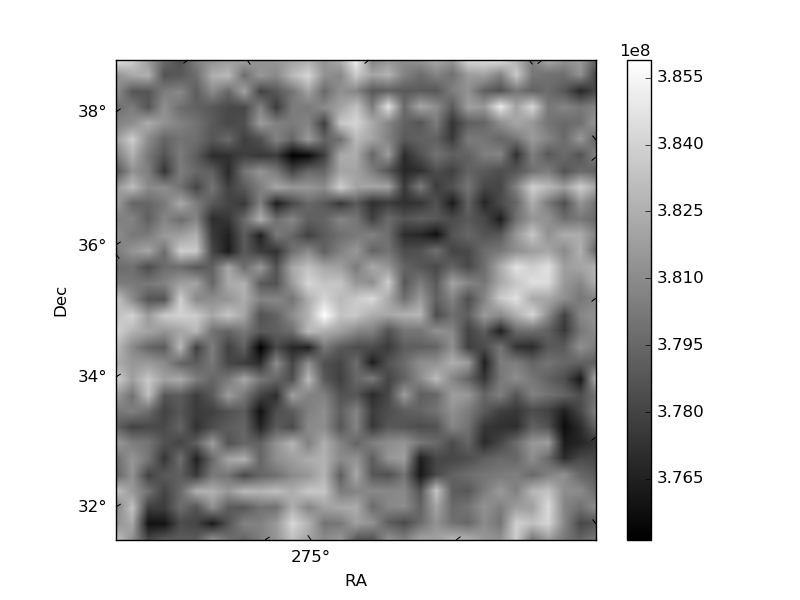
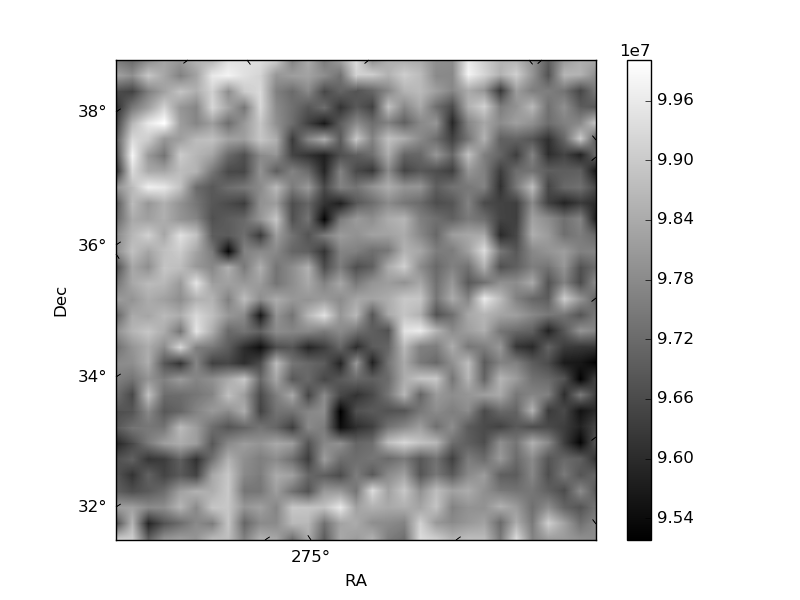
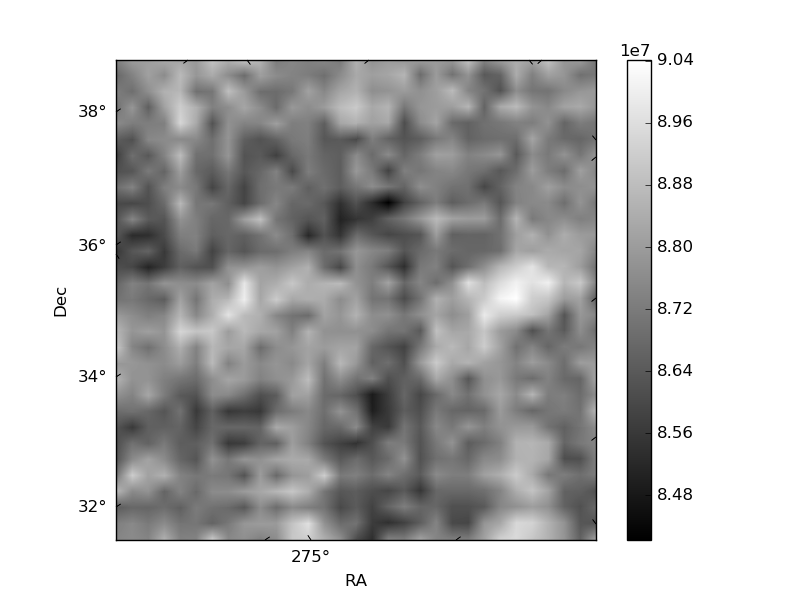
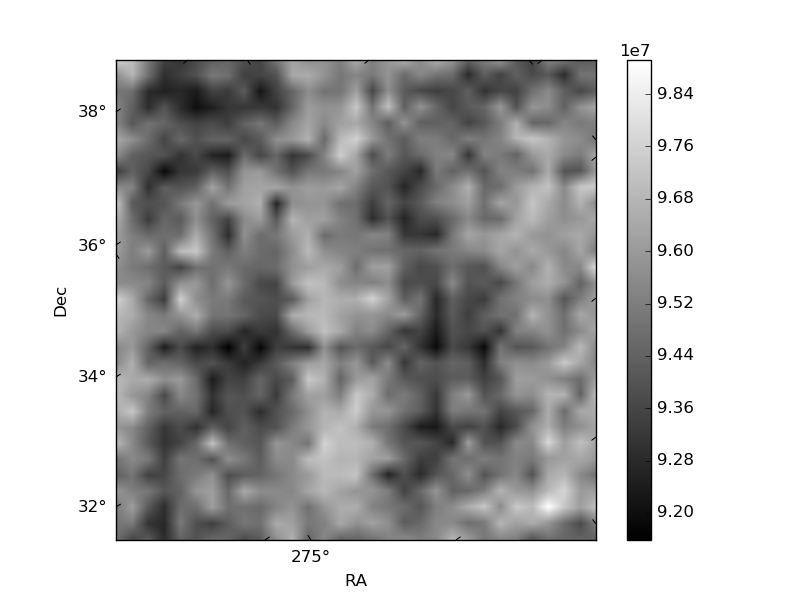
Histogram calculated using DETX and DETY for each event in the final _common_clean file
| Quadrant A | 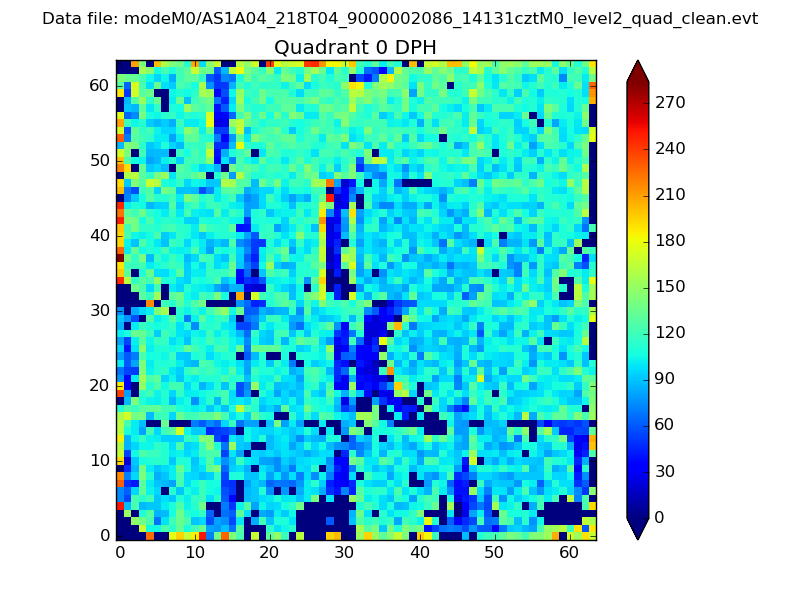 |
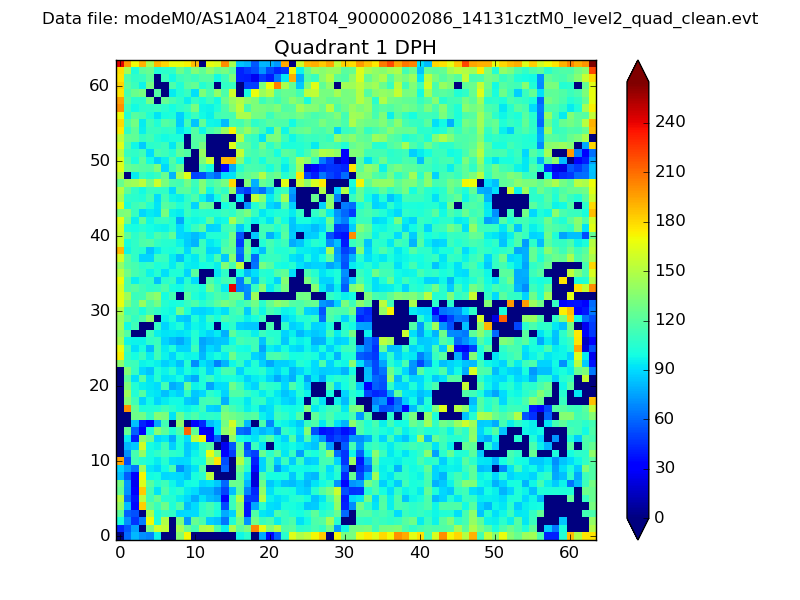 |
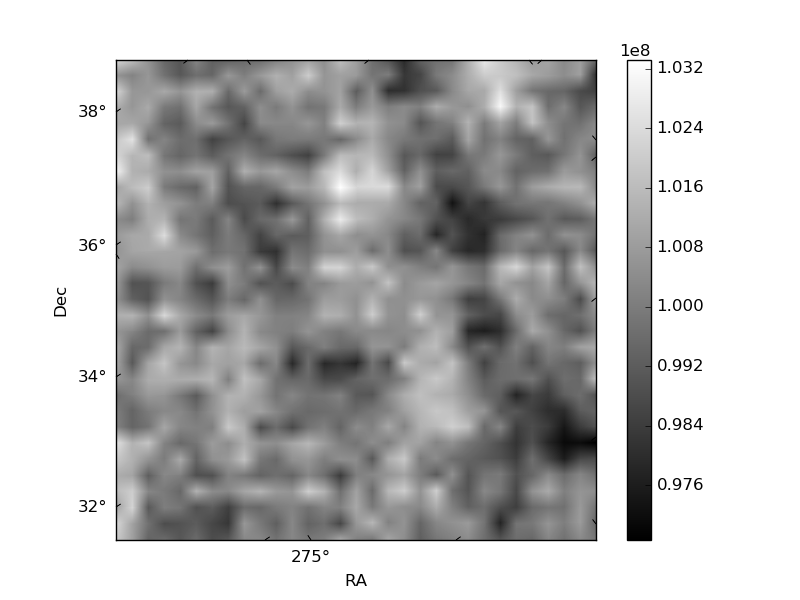
Quadrant B |
|---|---|---|---|
| Quadrant D | 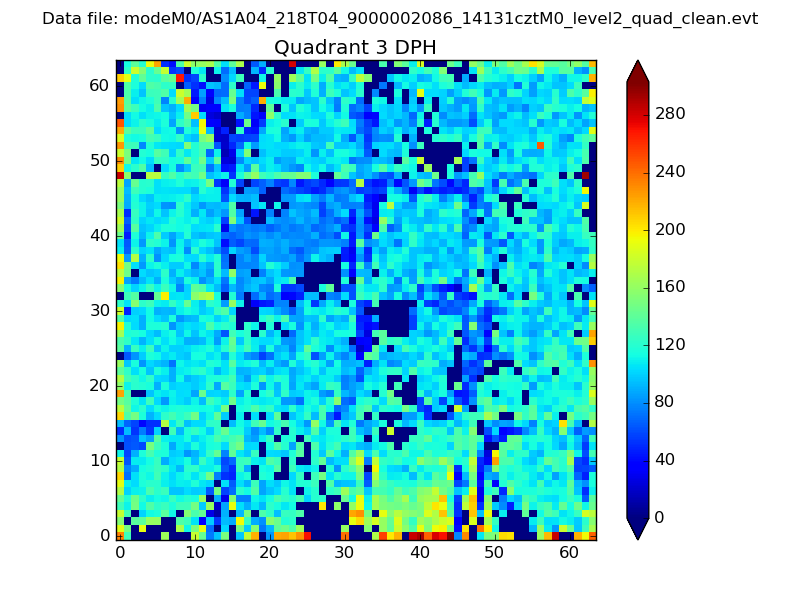 |
 |
Quadrant C |
| Plot type | Count rate plots | Images |
|---|---|---|
| Comparison with Poisson distribution Blue bars denote a histogram of data divided into 1 sec bins. Red curve is a Poisson curve with rate = median count rate of data. |
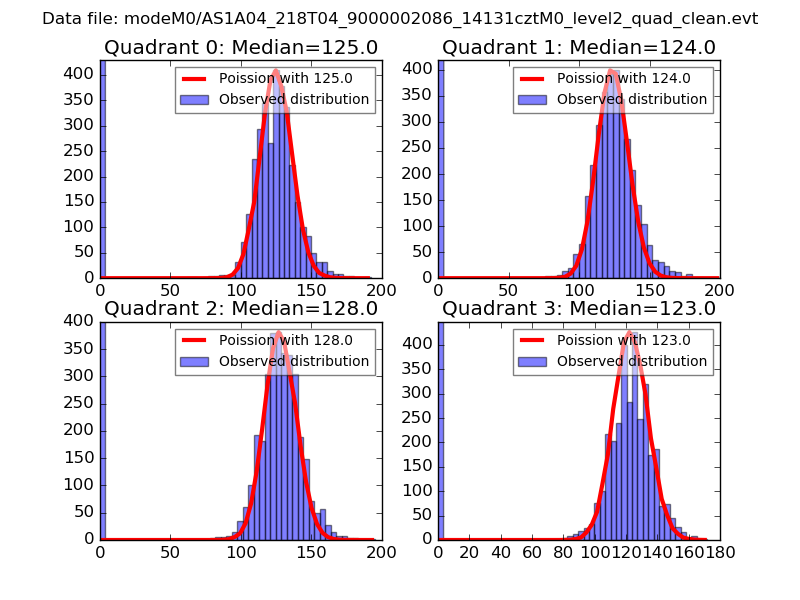 |
 |
| Quadrant-wise count rates Data is divided into 100 sec bins |
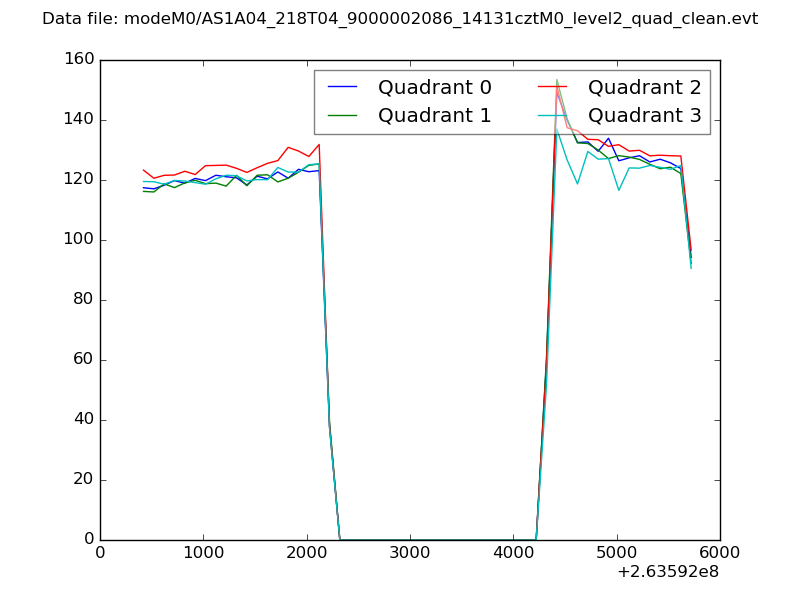 |
|
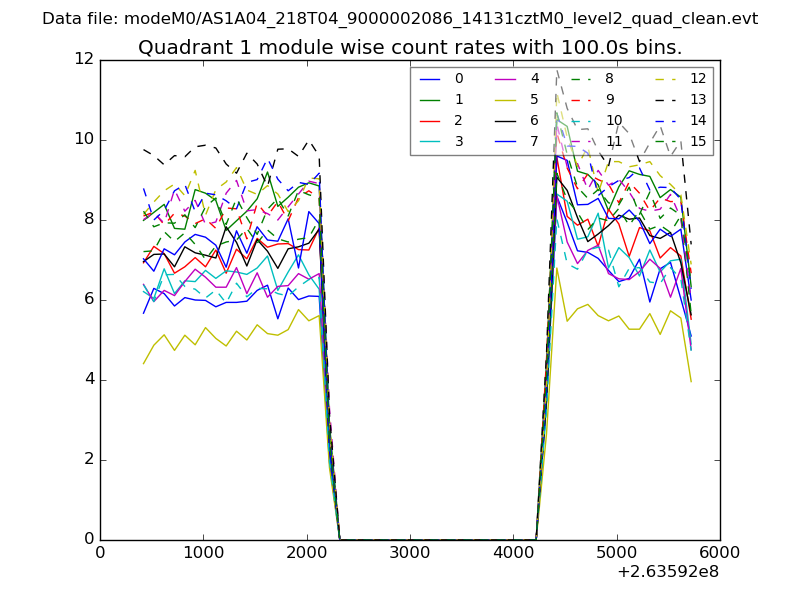
| Module-wise count rates for Quadrant A Data is divided into 100 sec bins |
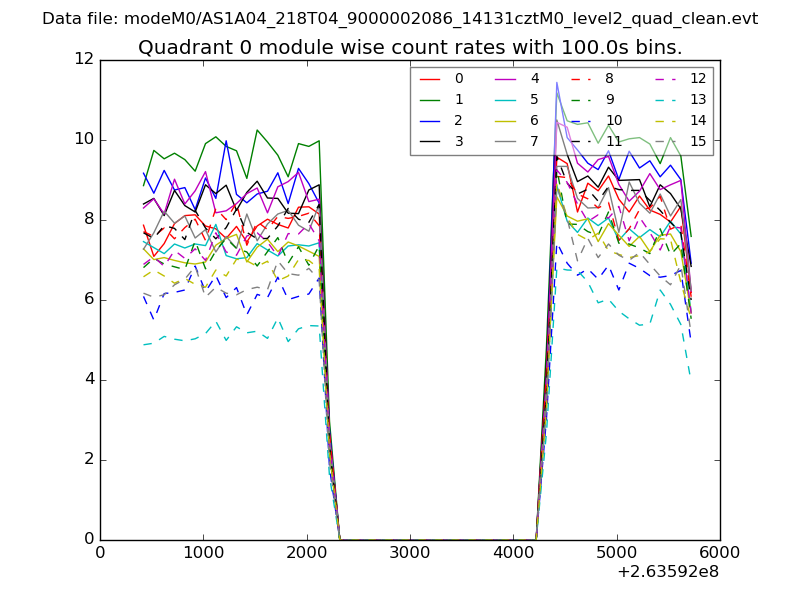 |
 |
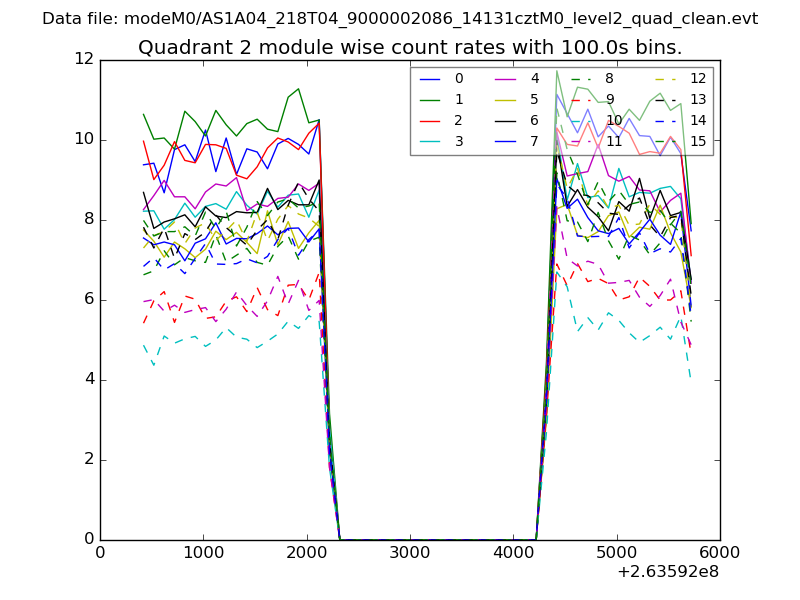
| Module-wise count rates for Quadrant B Data is divided into 100 sec bins |
 |
 |
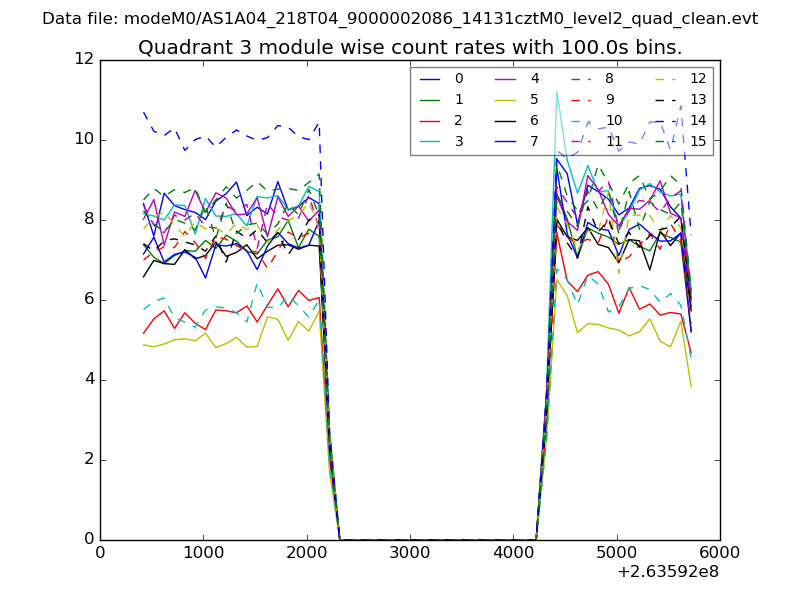
| Module-wise count rates for Quadrant C Data is divided into 100 sec bins |
 |
 |
| Module-wise count rates for Quadrant D Data is divided into 100 sec bins |
 |
 |
| Parameter | Plot |
|---|---|
| CZT HV Monitor | 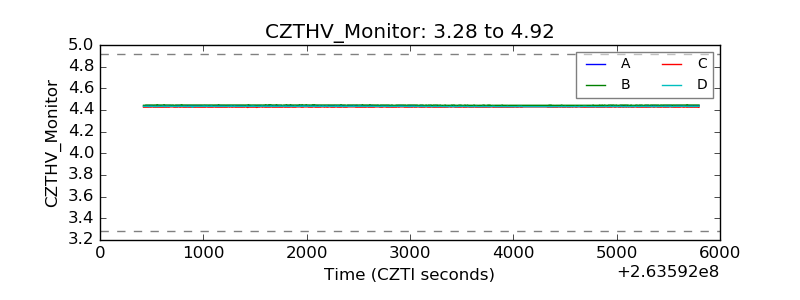 |
| D_VDD | 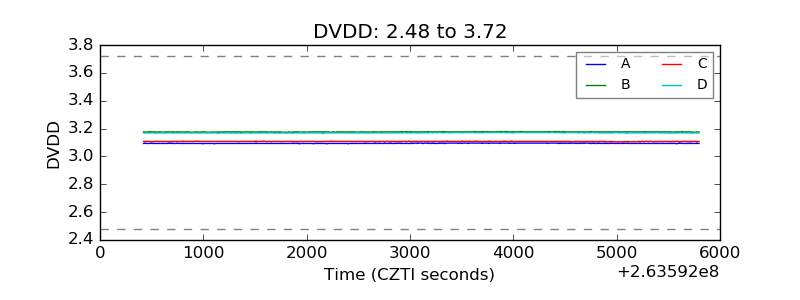 |
| Temperature 1 | 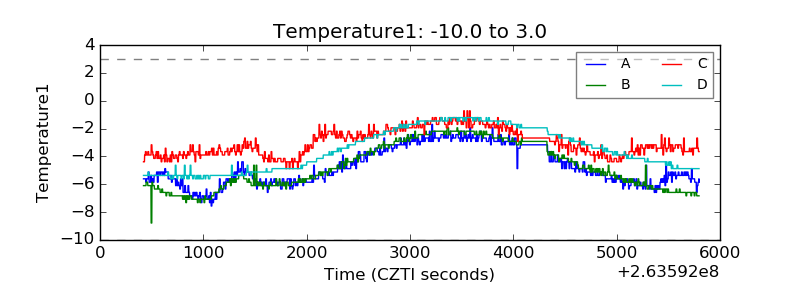 |
| Veto HV Monitor | 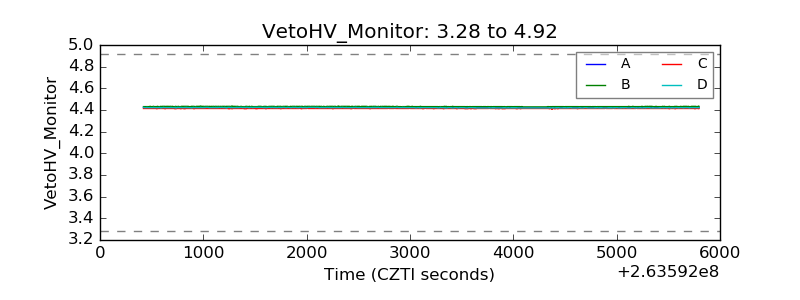 |
| Veto LLD | 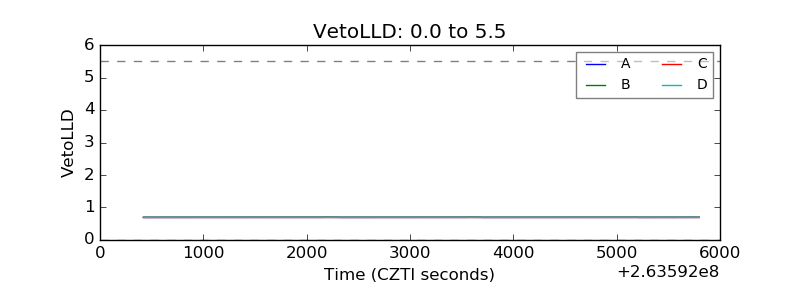 |
| Alpha Counter | 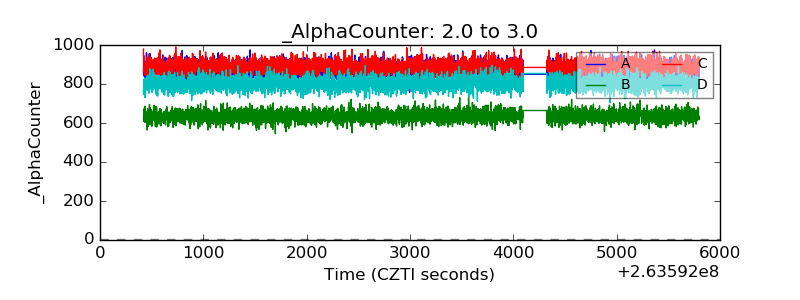 |
| _CPM_Rate | 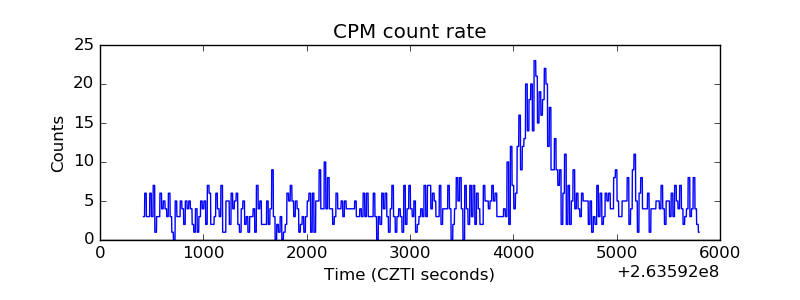 |
| CZT Counter | 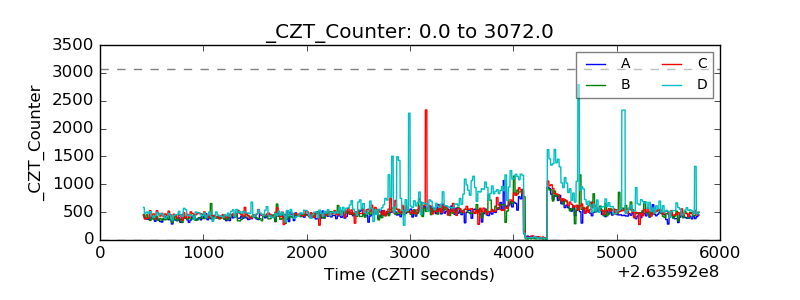 |
| +2.5 Volts monitor |  |
| +5 Volts monitor |  |
| _ROLL_ROT | 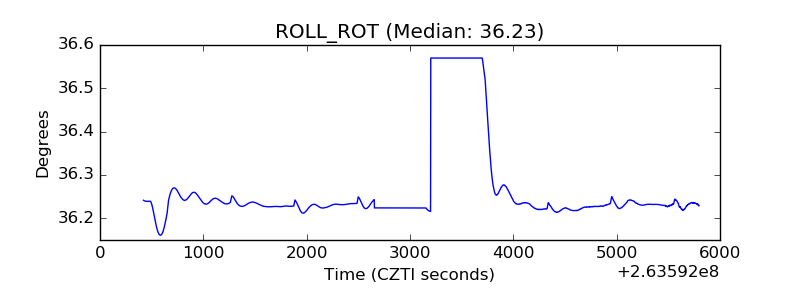 |
| _Roll_DEC | 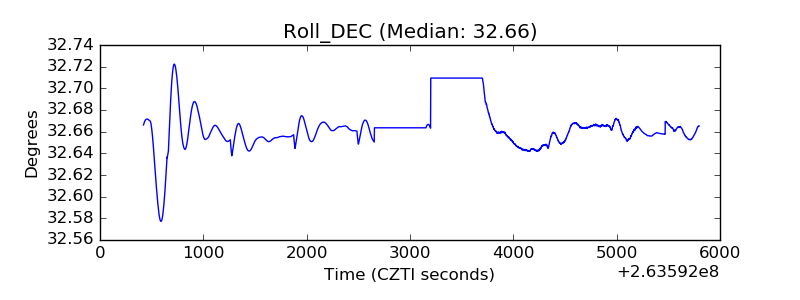 |
| _Roll_RA | 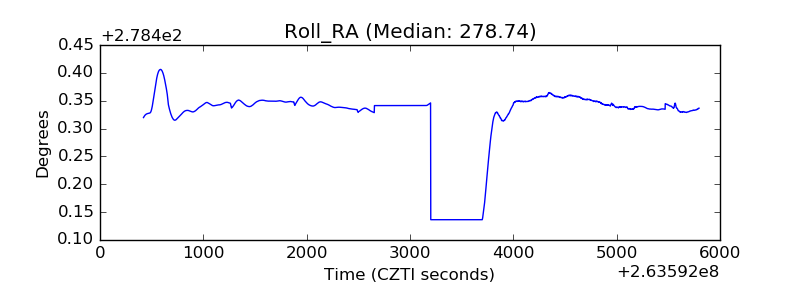 |
| Veto Counter | 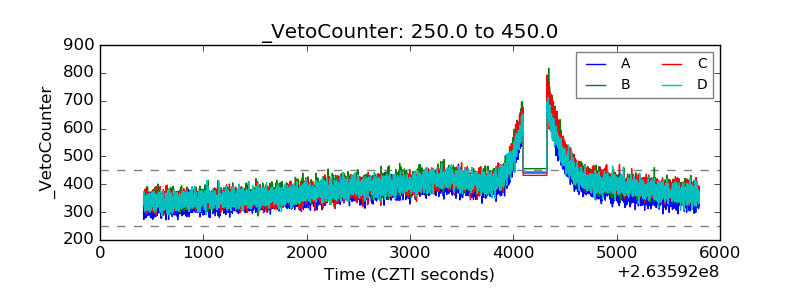 |