| Param | Original file | Final file |
|---|---|---|
| Filename | modeM0/AS1A04_218T04_9000002086_14132cztM0_level2.evt | modeM0/AS1A04_218T04_9000002086_14132cztM0_level2_quad_clean.evt |
| Size (bytes) | 634,582,080 | 109,065,600 |
| Size | 605.2 MB | 104.0 MB |
| Events in quadrant A | 3,889,521 | 687,187 |
| Events in quadrant B | 4,104,867 | 685,540 |
| Events in quadrant C | 4,264,014 | 705,892 |
| Events in quadrant D | 6,414,249 | 664,433 |
| Mode M0 | |||
|---|---|---|---|
| Quadrant | BADHDUFLAG | Total packets | Discarded packets |
| A | 0 | 17082 | 3 |
| B | 0 | 17526 | 2 |
| C | 0 | 17595 | 2 |
| D | 0 | 24710 | 2 |
| Mode SS | |||
|---|---|---|---|
| Quadrant | BADHDUFLAG | Total packets | Discarded packets |
| A | 0 | 166 | 0 |
| B | 0 | 166 | 0 |
| C | 0 | 166 | 0 |
| D | 0 | 166 | 0 |
| Mode M9 | |||
|---|---|---|---|
| Quadrant | BADHDUFLAG | Total packets | Discarded packets |
| A | 0 | 4 | 0 |
| B | 0 | 4 | 0 |
| C | 0 | 4 | 0 |
| D | 0 | 4 | 0 |
| Quadrant | Total seconds | Saturated seconds | Saturation percentage |
|---|---|---|---|
| A | 8052 | 107 | 1.328862% |
| B | 8052 | 198 | 2.459016% |
| C | 8052 | 90 | 1.117735% |
| D | 8052 | 571 | 7.091406% |
Noise dominated data is calculated using 1-second bins in cleaned event files. If a bin has >2000 counts, and if more than 50% of those come from <1% of pixels, then it is considered to be noise-dominated and hence unusable.
| Quadrant | # 1 sec bins | Bins with >0 counts | Bins with >2000 counts | High rate bins dominated by noise | Noise dominated (total time) | Noise dominated (detector-on time) | Marked lightcurve |
|---|---|---|---|---|---|---|---|
| A | 8503 | 8055 | 0 | 0 | 0.00% | 0.00% | 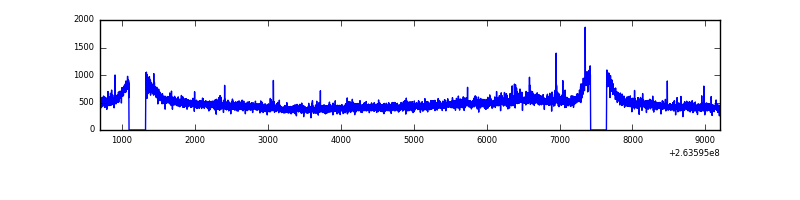 |
| B | 8503 | 8055 | 1 | 1 | 0.01% | 0.01% | 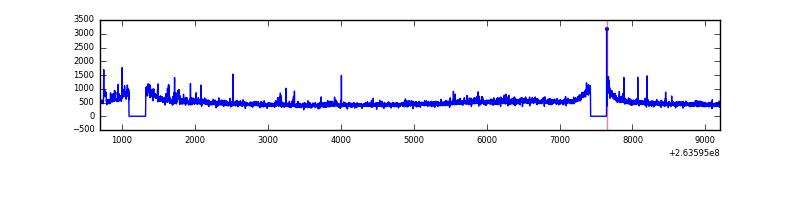 |
| C | 8503 | 8055 | 1 | 1 | 0.01% | 0.01% | 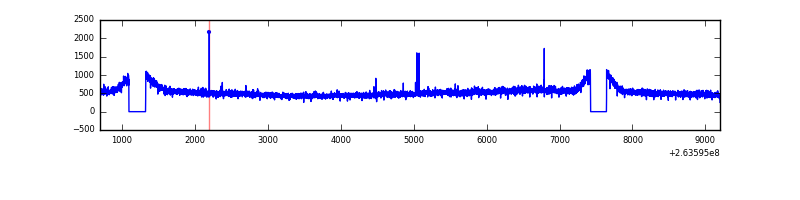 |
| D | 8503 | 8055 | 309 | 309 | 3.63% | 3.84% | 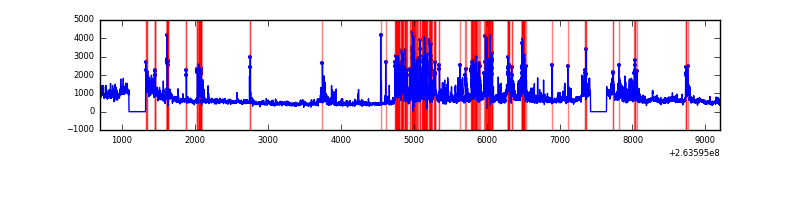 |
Top three noisy pixels from each quadrant. If the there are fewer than three noisy pixels in the level2.evt file, extra rows are filled as -1
| Pixel properties | Quadrant properties | ||||||
|---|---|---|---|---|---|---|---|
| Quadrant | DetID | PixID | Counts | Sigma | Mean | Median | Sigma |
| A | 12 | 189 | 41675 | 197.3 | 997 | 975 | 206.3 |
| A | 12 | 96 | 12783 | 57.24 | 997 | 975 | 206.3 |
| A | 0 | 226 | 8662 | 37.26 | 997 | 975 | 206.3 |
| B | 0 | 219 | 49159 | 248.61 | 998 | 970 | 193.8 |
| B | 0 | 85 | 49008 | 247.83 | 998 | 970 | 193.8 |
| B | 0 | 189 | 31808 | 159.09 | 998 | 970 | 193.8 |
| C | 3 | 233 | 423247 | 1822.19 | 982 | 985 | 231.7 |
| C | 14 | 234 | 10460 | 40.89 | 982 | 985 | 231.7 |
| C | 13 | 61 | 7049 | 26.17 | 982 | 985 | 231.7 |
| D | 1 | 52 | 1045115 | 4583.89 | 950 | 927 | 227.8 |
| D | 7 | 80 | 1038059 | 4552.92 | 950 | 927 | 227.8 |
| D | 8 | 195 | 487751 | 2137.11 | 950 | 927 | 227.8 |
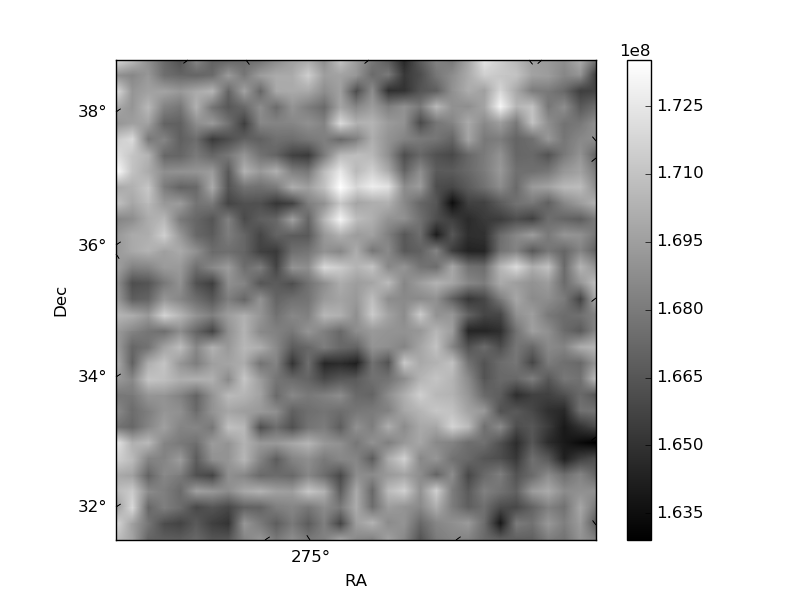
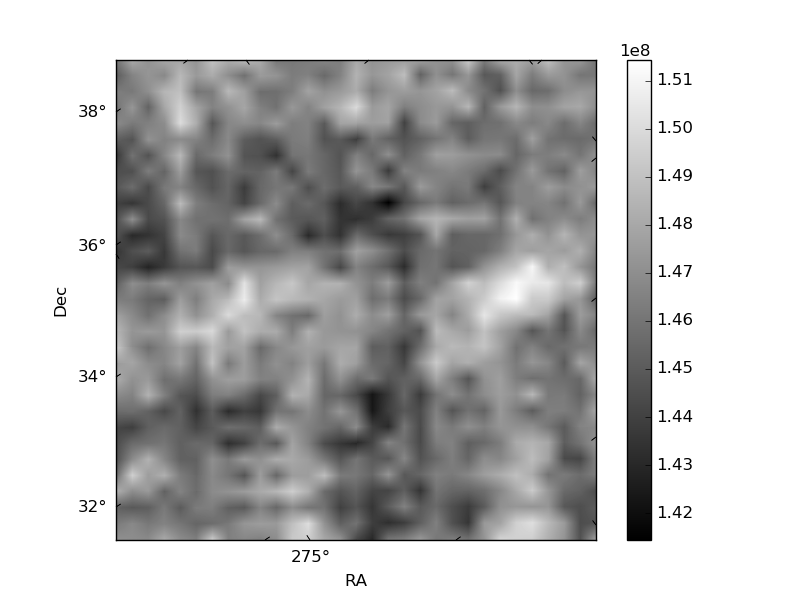
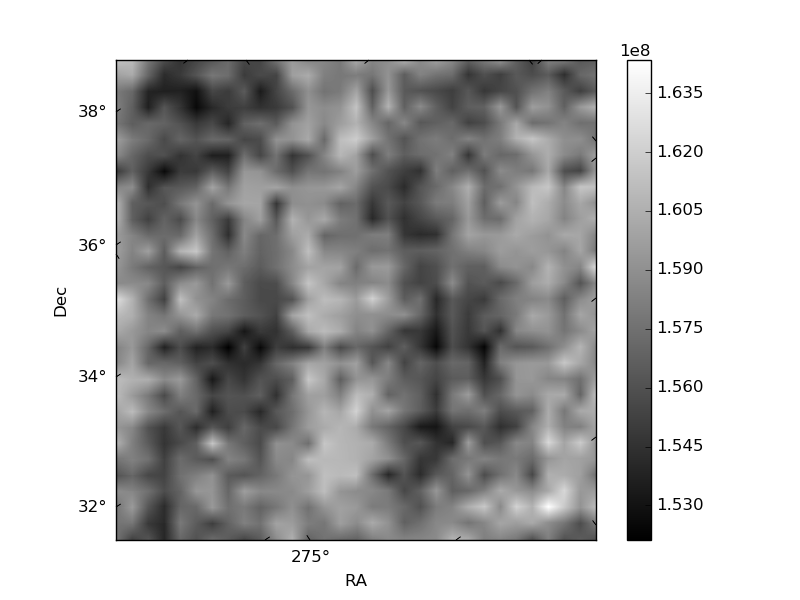
Histogram calculated using DETX and DETY for each event in the final _common_clean file
| Quadrant A | 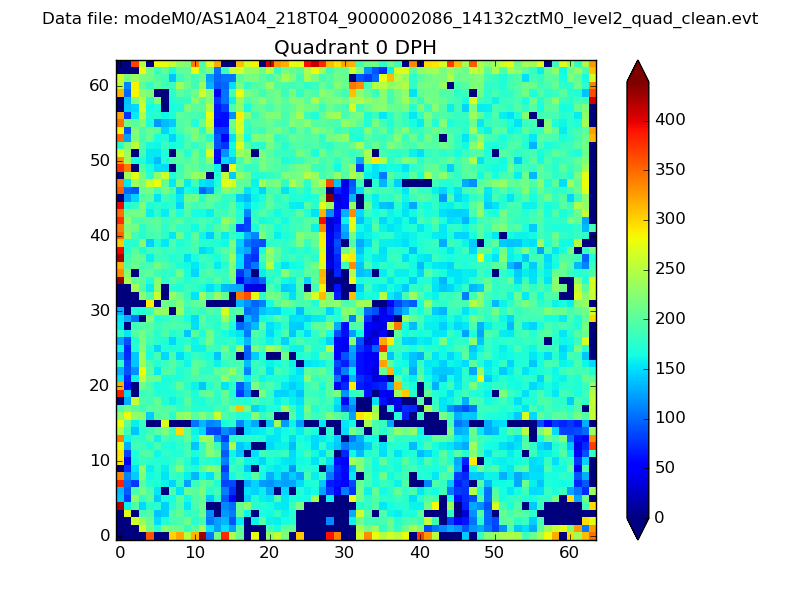 |
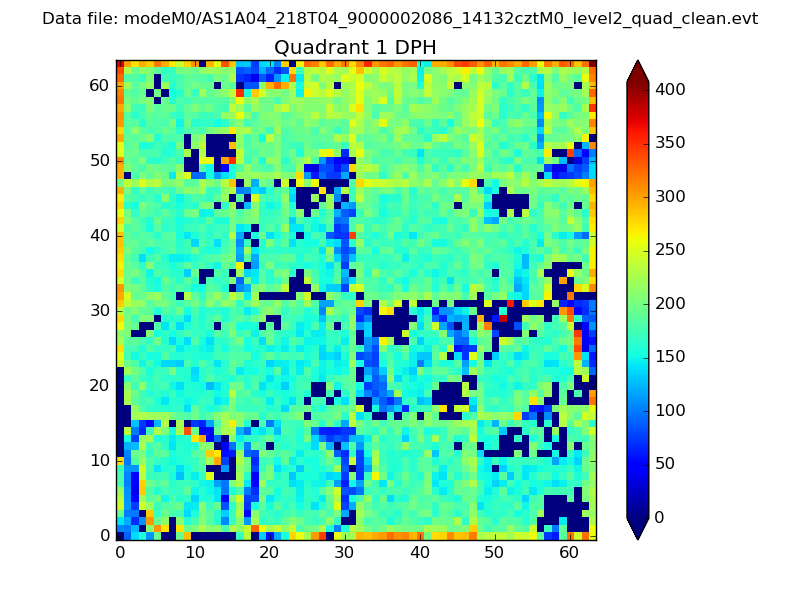 |
Quadrant B |
|---|---|---|---|
| Quadrant D |  |
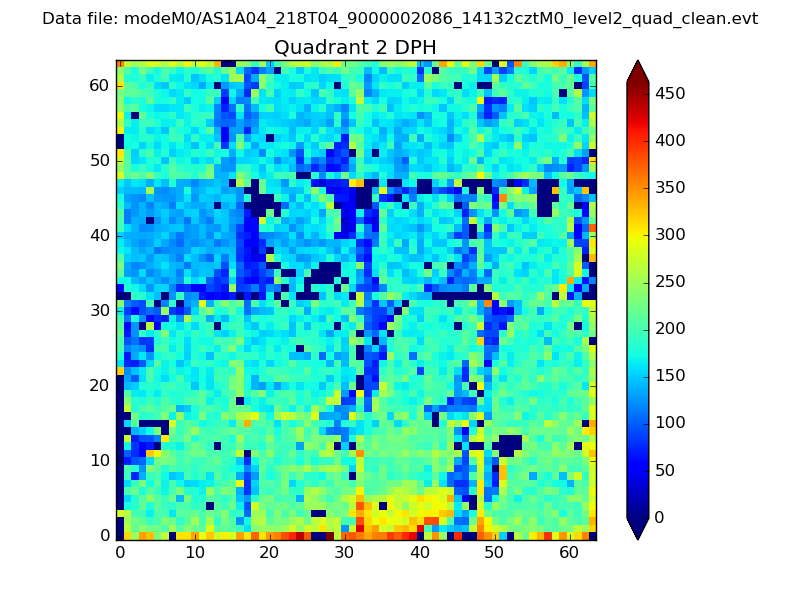 |
Quadrant C |
| Plot type | Count rate plots | Images |
|---|---|---|
| Comparison with Poisson distribution Blue bars denote a histogram of data divided into 1 sec bins. Red curve is a Poisson curve with rate = median count rate of data. |
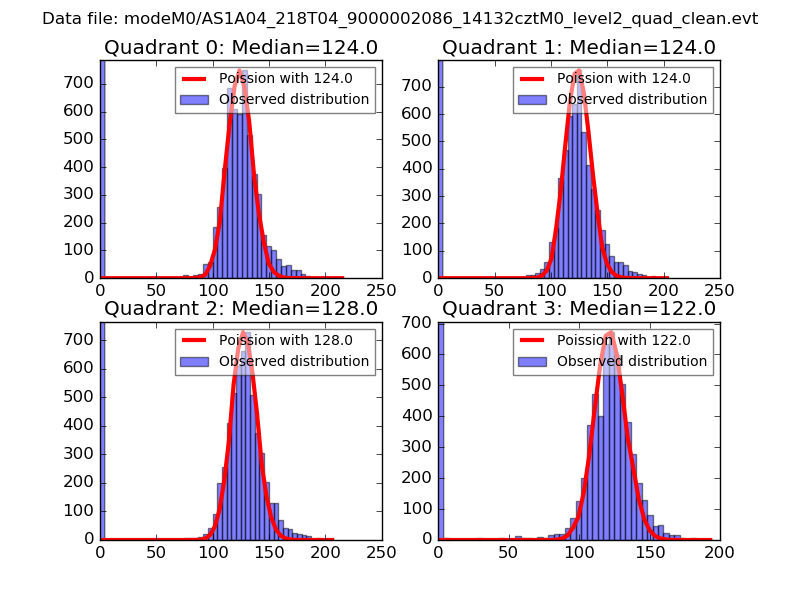 |
 |
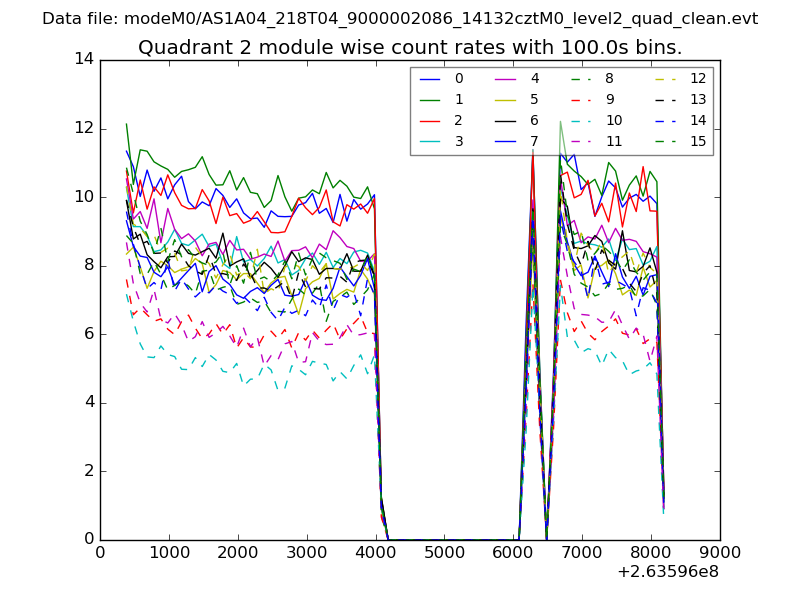
| Quadrant-wise count rates Data is divided into 100 sec bins |
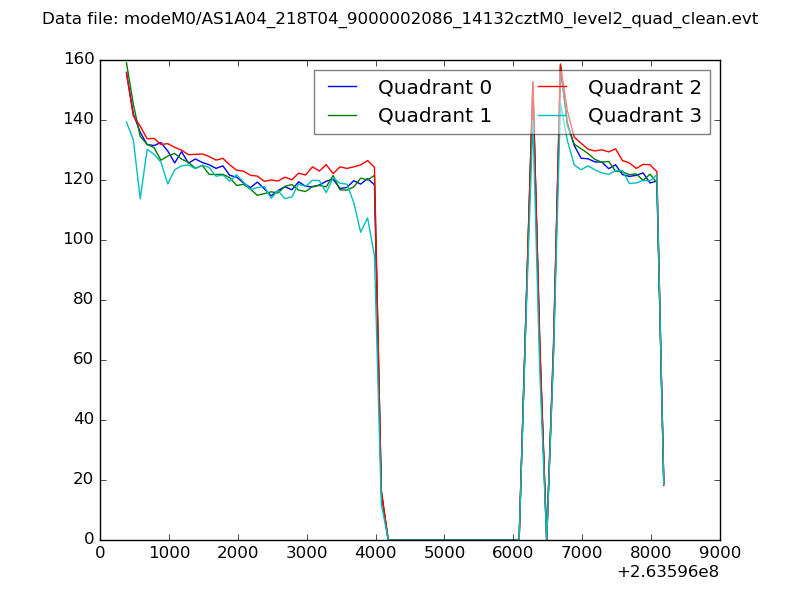 |
|
| Module-wise count rates for Quadrant A Data is divided into 100 sec bins |
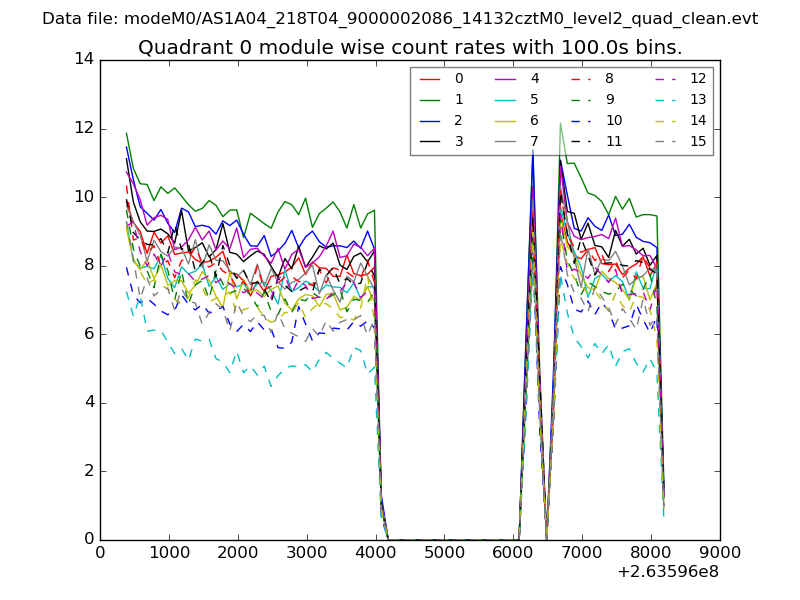 |
 |
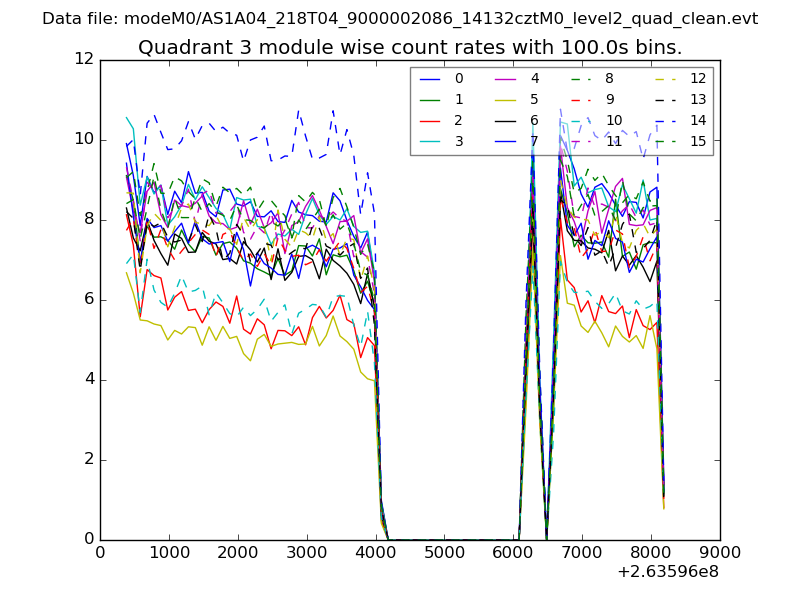
| Module-wise count rates for Quadrant B Data is divided into 100 sec bins |
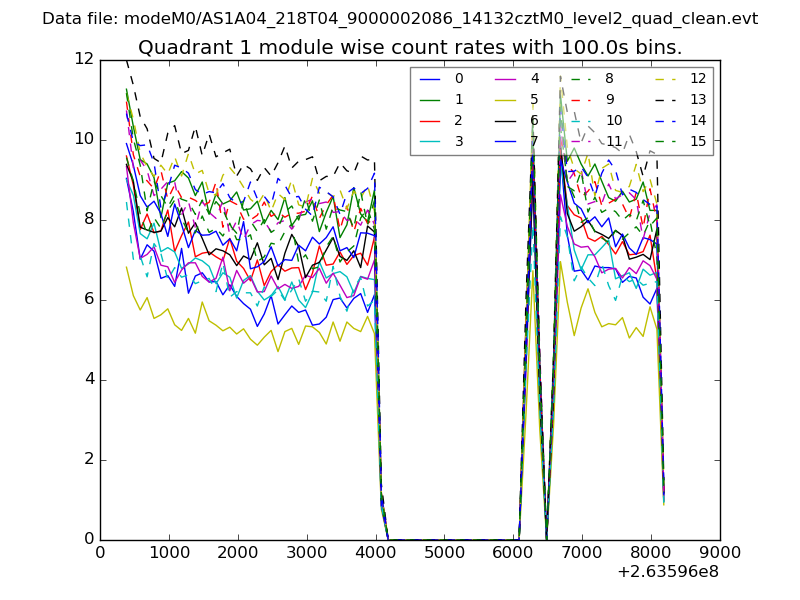 |
 |
| Module-wise count rates for Quadrant C Data is divided into 100 sec bins |
 |
 |
| Module-wise count rates for Quadrant D Data is divided into 100 sec bins |
 |
 |
| Parameter | Plot |
|---|---|
| CZT HV Monitor | 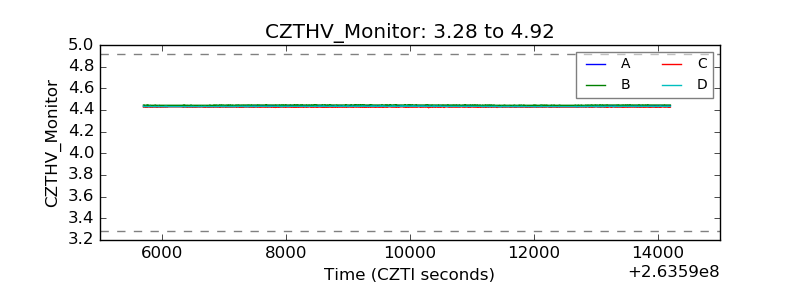 |
| D_VDD | 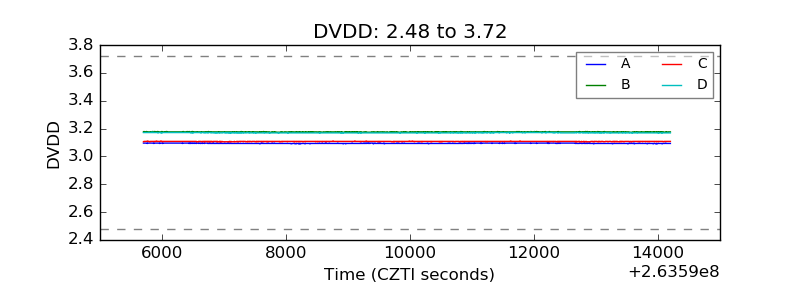 |
| Temperature 1 | 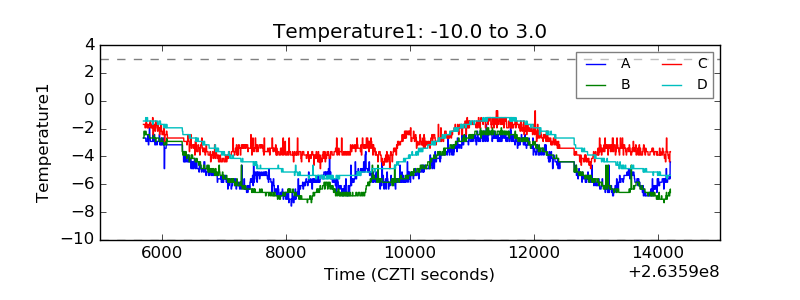 |
| Veto HV Monitor | 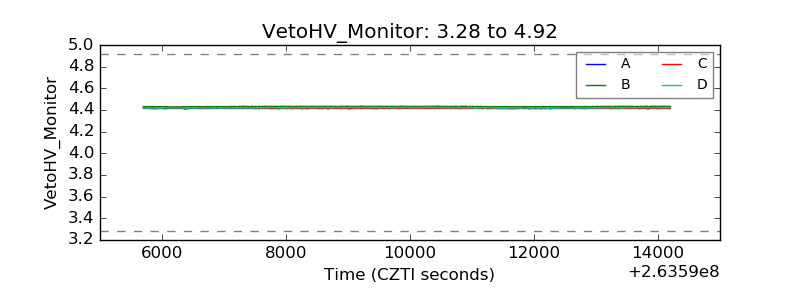 |
| Veto LLD | 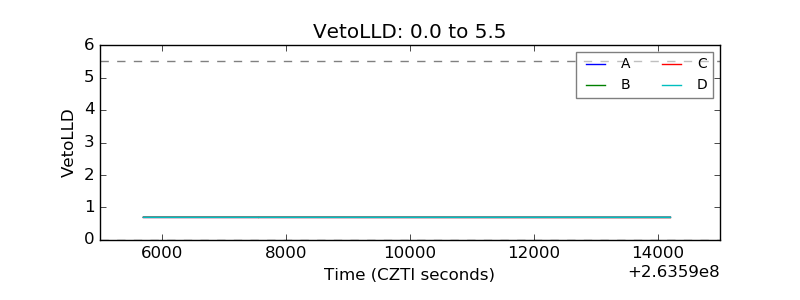 |
| Alpha Counter | 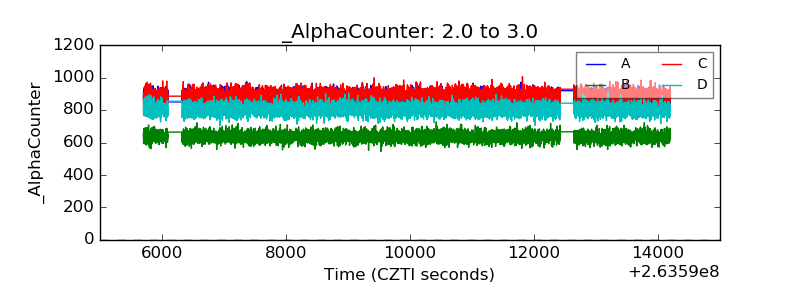 |
| _CPM_Rate | 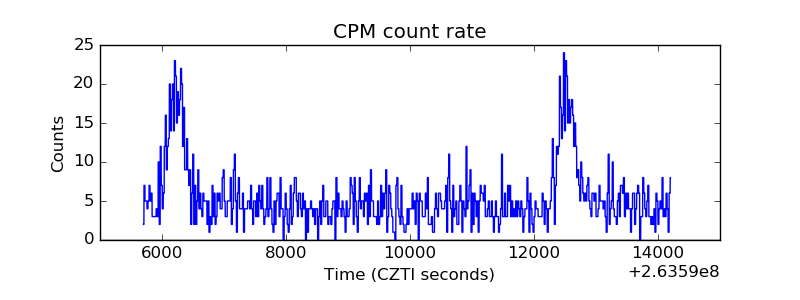 |
| CZT Counter |  |
| +2.5 Volts monitor |  |
| +5 Volts monitor |  |
| _ROLL_ROT | 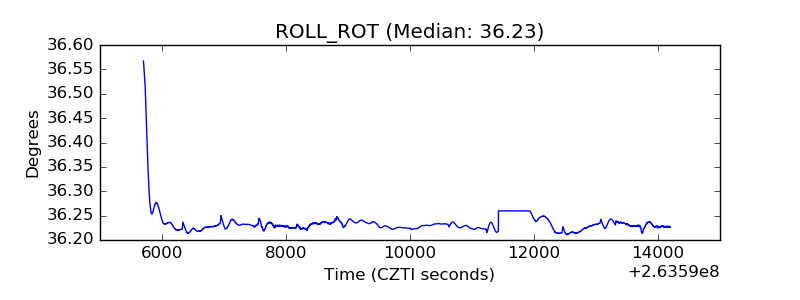 |
| _Roll_DEC |  |
| _Roll_RA | 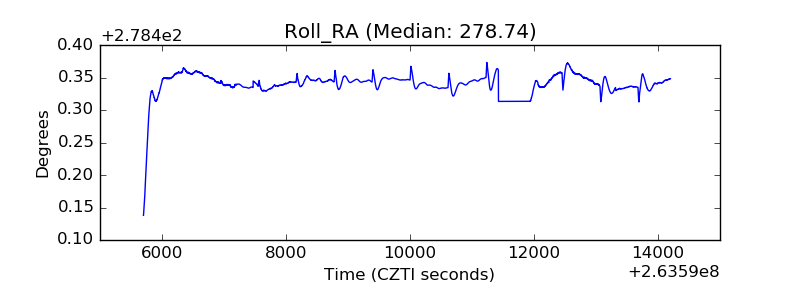 |
| Veto Counter | 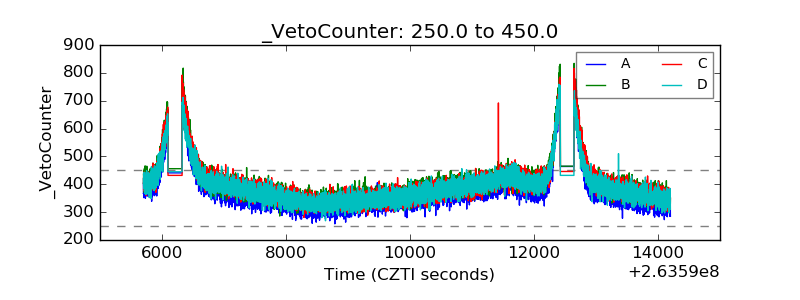 |