| Param | Original file | Final file |
|---|---|---|
| Filename | modeM0/AS1A04_218T04_9000002086_14135cztM0_level2.evt | modeM0/AS1A04_218T04_9000002086_14135cztM0_level2_quad_clean.evt |
| Size (bytes) | 1,547,461,440 | 247,432,320 |
| Size | 1.4 GB | 236.0 MB |
| Events in quadrant A | 9,041,316 | 1,572,061 |
| Events in quadrant B | 9,635,702 | 1,571,202 |
| Events in quadrant C | 9,576,004 | 1,622,115 |
| Events in quadrant D | 17,308,074 | 1,397,117 |
| Mode M0 | |||
|---|---|---|---|
| Quadrant | BADHDUFLAG | Total packets | Discarded packets |
| A | 0 | 40048 | 5 |
| B | 0 | 41618 | 4 |
| C | 0 | 40696 | 4 |
| D | 0 | 64627 | 4 |
| Mode SS | |||
|---|---|---|---|
| Quadrant | BADHDUFLAG | Total packets | Discarded packets |
| A | 0 | 394 | 0 |
| B | 0 | 394 | 0 |
| C | 0 | 394 | 0 |
| D | 0 | 394 | 0 |
| Mode M9 | |||
|---|---|---|---|
| Quadrant | BADHDUFLAG | Total packets | Discarded packets |
| A | 0 | 19 | 0 |
| B | 0 | 19 | 0 |
| C | 0 | 19 | 0 |
| D | 0 | 19 | 0 |
| Quadrant | Total seconds | Saturated seconds | Saturation percentage |
|---|---|---|---|
| A | 19318 | 222 | 1.149187% |
| B | 19318 | 291 | 1.506367% |
| C | 19318 | 180 | 0.931773% |
| D | 19318 | 2336 | 12.092349% |
Noise dominated data is calculated using 1-second bins in cleaned event files. If a bin has >2000 counts, and if more than 50% of those come from <1% of pixels, then it is considered to be noise-dominated and hence unusable.
| Quadrant | # 1 sec bins | Bins with >0 counts | Bins with >2000 counts | High rate bins dominated by noise | Noise dominated (total time) | Noise dominated (detector-on time) | Marked lightcurve |
|---|---|---|---|---|---|---|---|
| A | 21249 | 19323 | 2 | 2 | 0.01% | 0.01% | 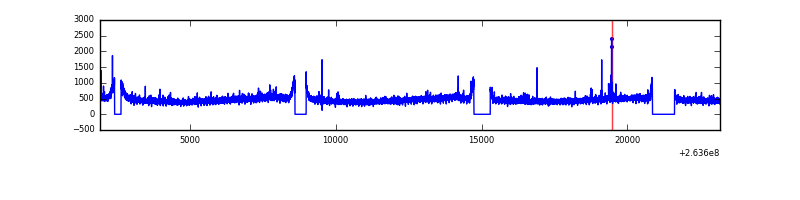 |
| B | 21249 | 19323 | 7 | 7 | 0.03% | 0.04% | 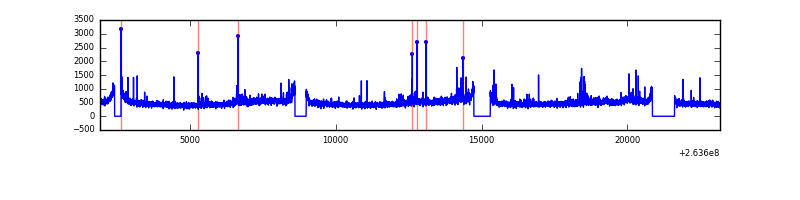 |
| C | 21249 | 19323 | 8 | 8 | 0.04% | 0.04% | 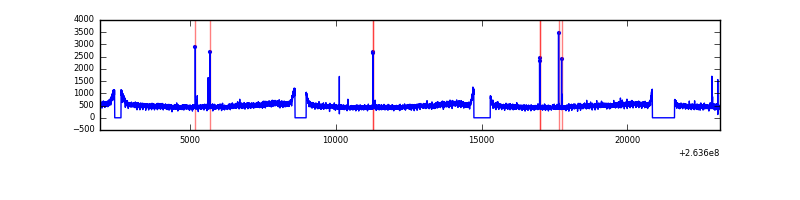 |
| D | 21249 | 19322 | 1930 | 1930 | 9.08% | 9.99% | 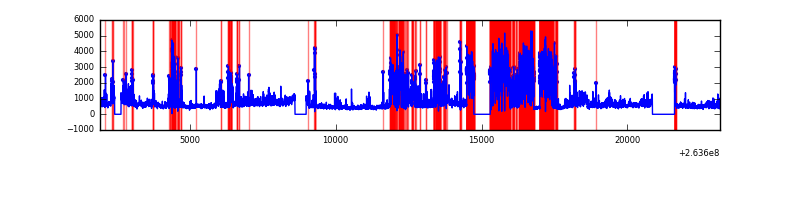 |
Top three noisy pixels from each quadrant. If the there are fewer than three noisy pixels in the level2.evt file, extra rows are filled as -1
| Pixel properties | Quadrant properties | ||||||
|---|---|---|---|---|---|---|---|
| Quadrant | DetID | PixID | Counts | Sigma | Mean | Median | Sigma |
| A | 12 | 189 | 38909 | 78.59 | 2316 | 2268 | 466.2 |
| A | 1 | 113 | 38296 | 77.27 | 2316 | 2268 | 466.2 |
| A | 8 | 15 | 31822 | 63.39 | 2316 | 2268 | 466.2 |
| B | 10 | 244 | 264316 | 589.08 | 2311 | 2247 | 444.9 |
| B | 3 | 209 | 84512 | 184.91 | 2311 | 2247 | 444.9 |
| B | 0 | 189 | 68046 | 147.9 | 2311 | 2247 | 444.9 |
| C | 3 | 233 | 710804 | 1339.54 | 2264 | 2275 | 528.9 |
| C | 14 | 234 | 40742 | 72.72 | 2264 | 2275 | 528.9 |
| C | 13 | 61 | 16387 | 26.68 | 2264 | 2275 | 528.9 |
| D | 7 | 80 | 6410562 | 12726.47 | 2108 | 2057 | 503.6 |
| D | 8 | 195 | 1209074 | 2396.98 | 2108 | 2057 | 503.6 |
| D | 1 | 52 | 528475 | 1045.4 | 2108 | 2057 | 503.6 |
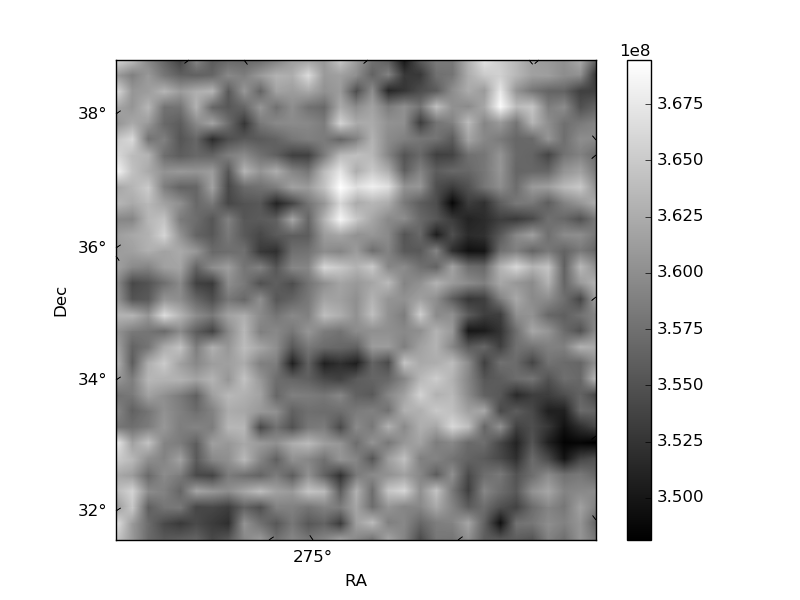
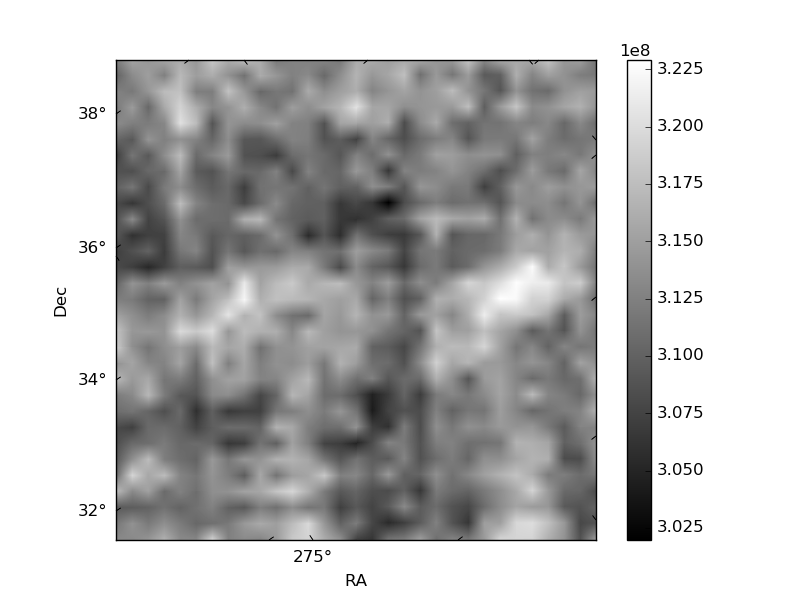
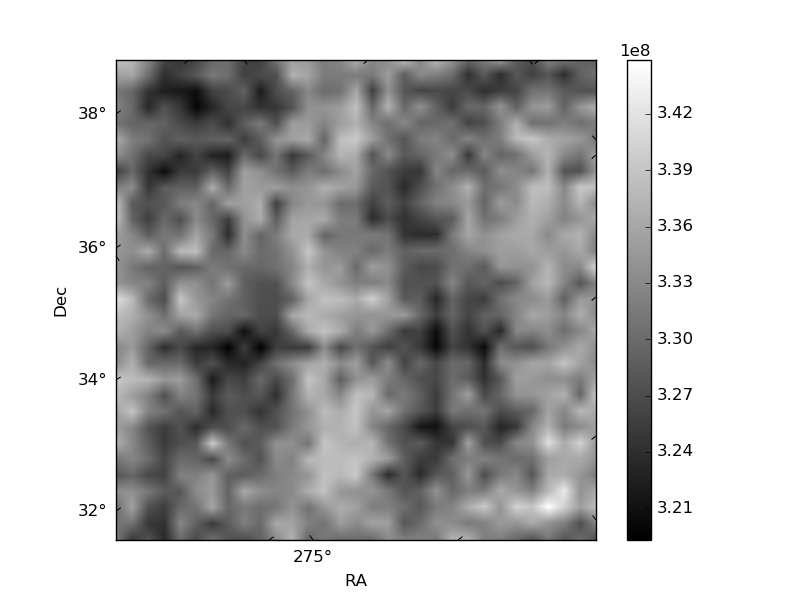
Histogram calculated using DETX and DETY for each event in the final _common_clean file
| Quadrant A | 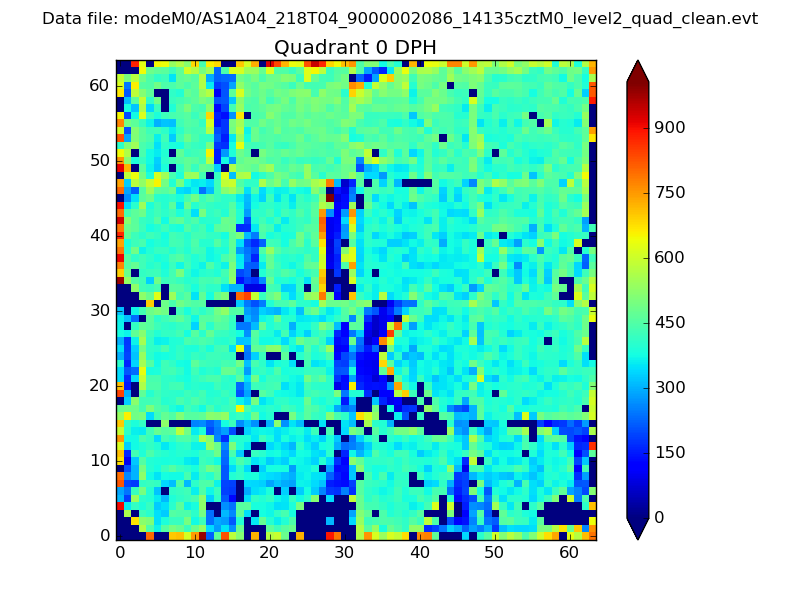 |
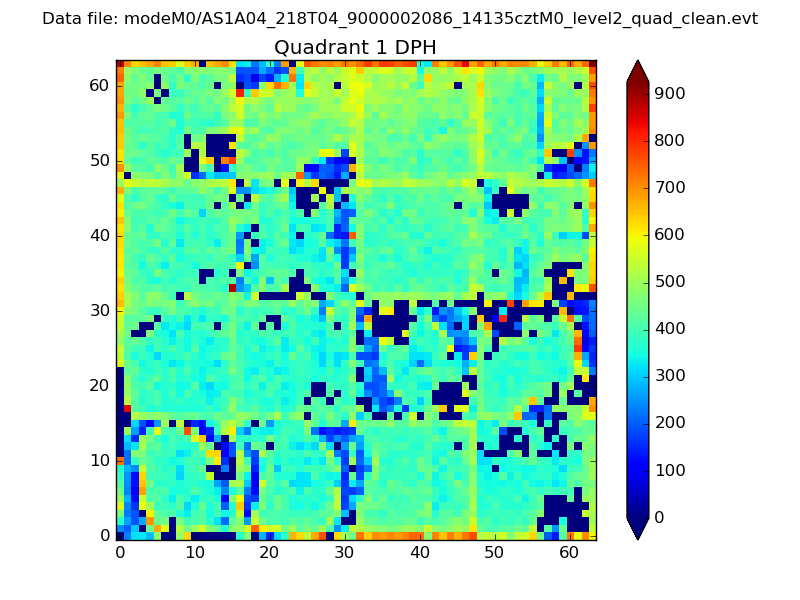 |
Quadrant B |
|---|---|---|---|
| Quadrant D | 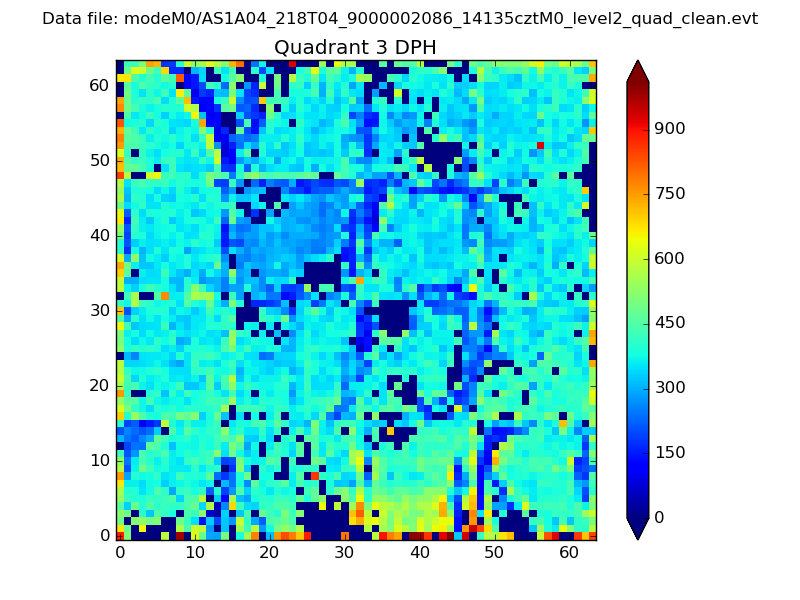 |
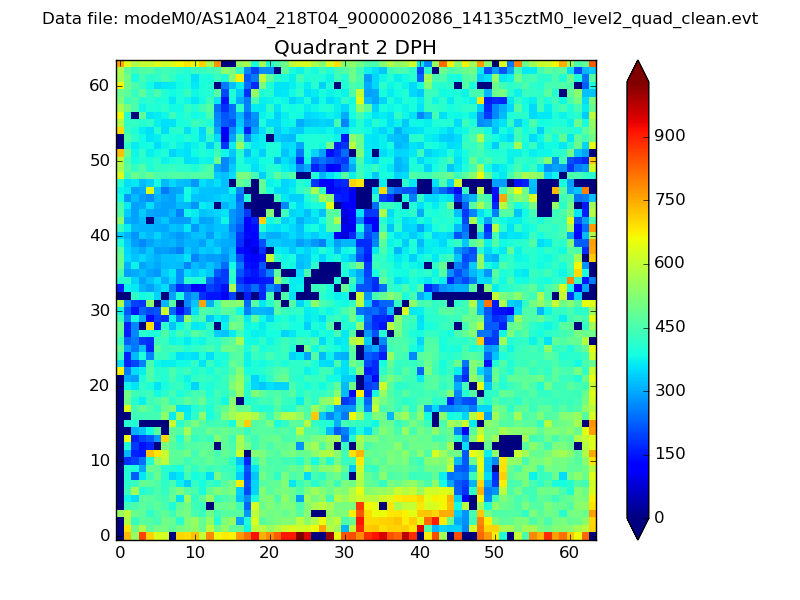 |
Quadrant C |
| Plot type | Count rate plots | Images |
|---|---|---|
| Comparison with Poisson distribution Blue bars denote a histogram of data divided into 1 sec bins. Red curve is a Poisson curve with rate = median count rate of data. |
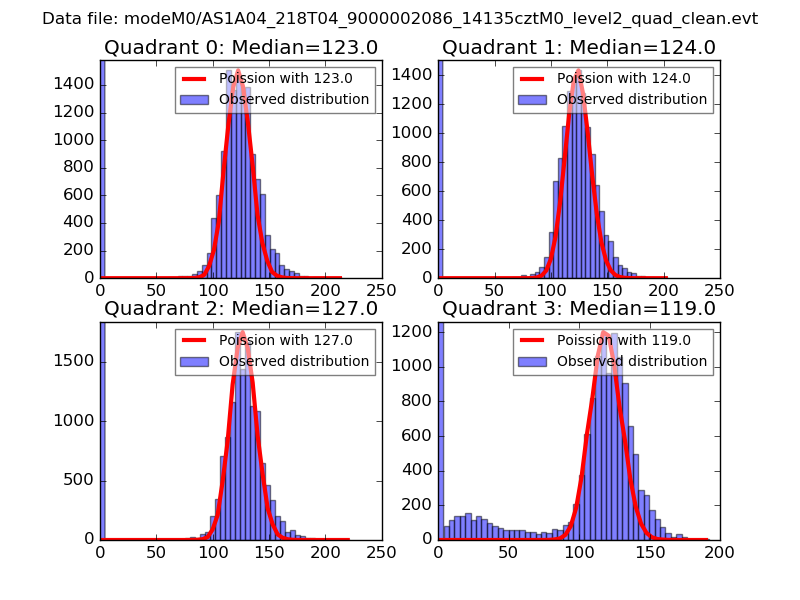 |
 |
| Quadrant-wise count rates Data is divided into 100 sec bins |
 |
|
| Module-wise count rates for Quadrant A Data is divided into 100 sec bins |
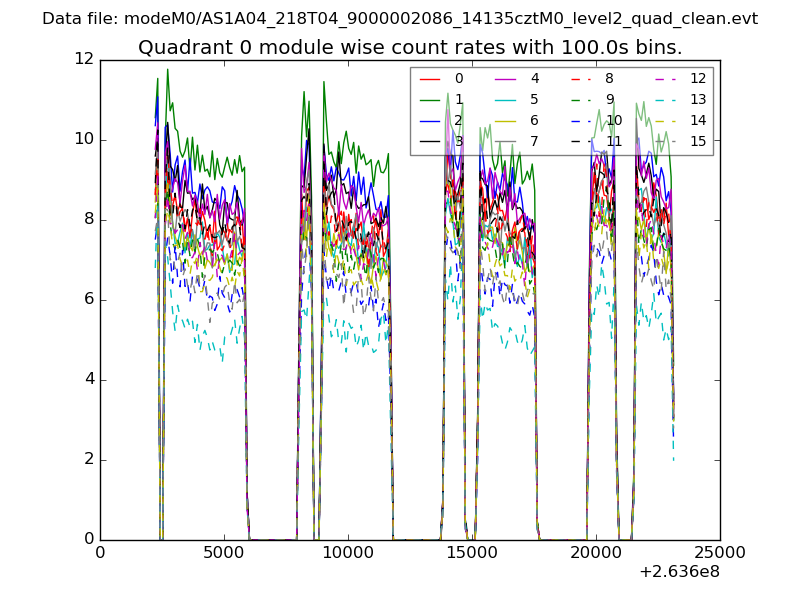 |
 |
| Module-wise count rates for Quadrant B Data is divided into 100 sec bins |
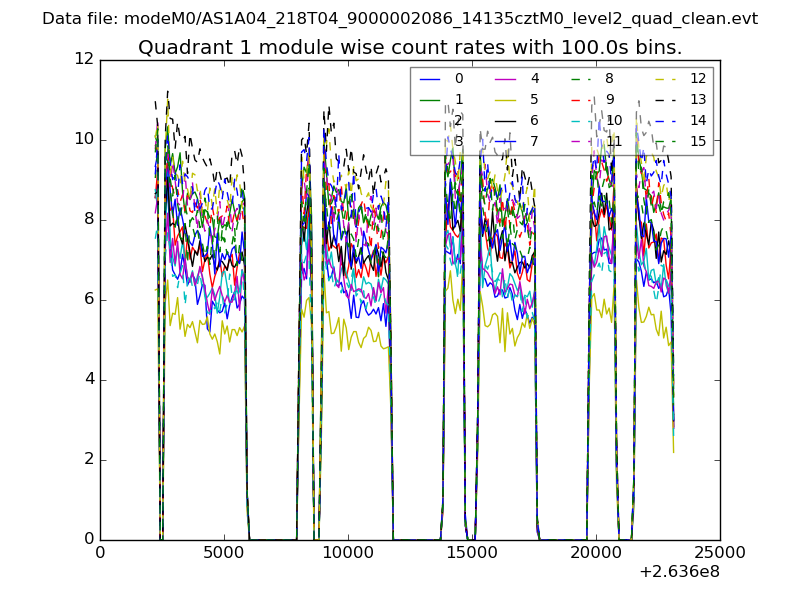 |
 |
| Module-wise count rates for Quadrant C Data is divided into 100 sec bins |
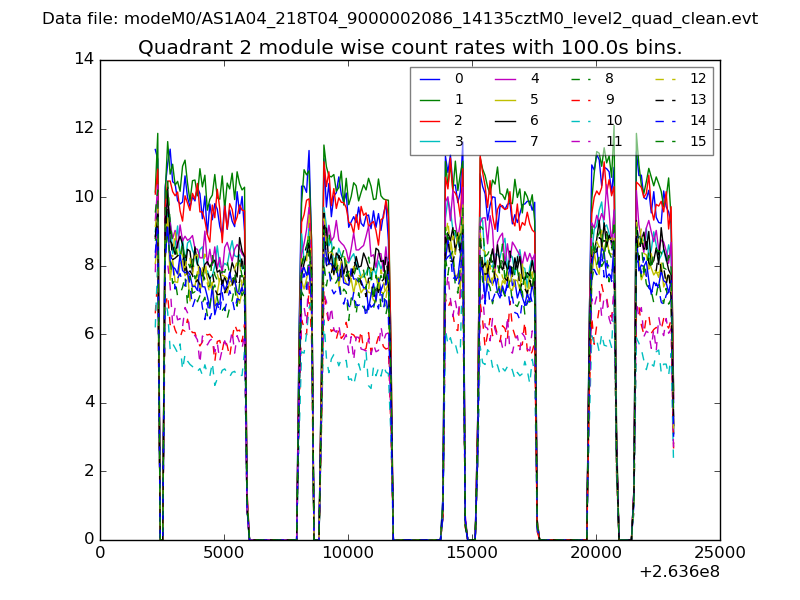 |
 |
| Module-wise count rates for Quadrant D Data is divided into 100 sec bins |
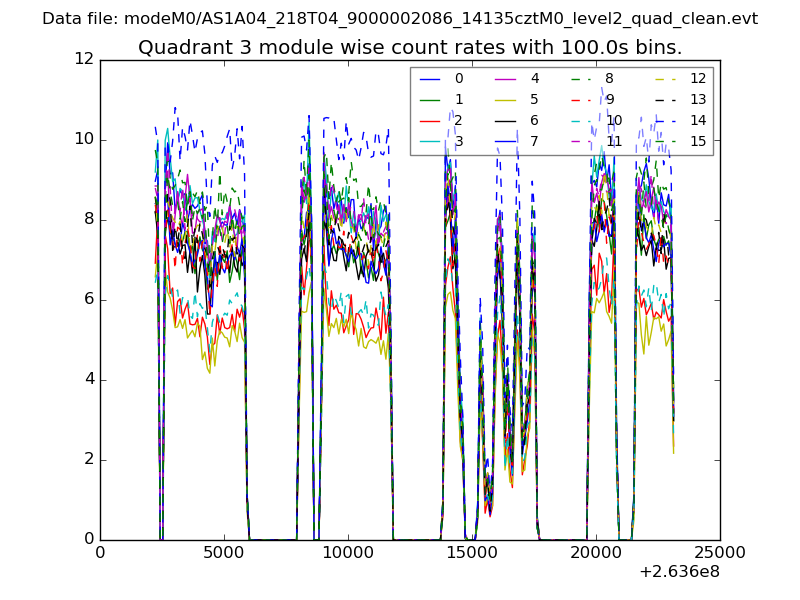 |
 |
| Parameter | Plot |
|---|---|
| CZT HV Monitor | 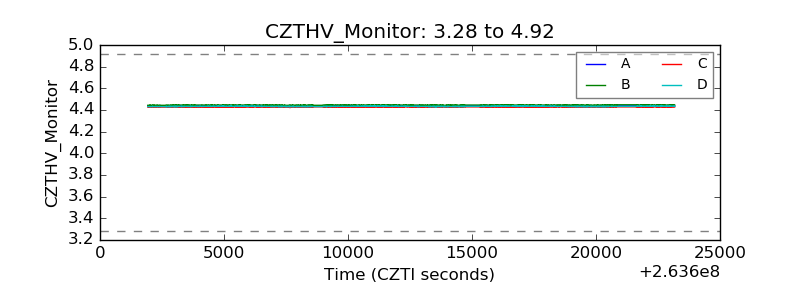 |
| D_VDD | 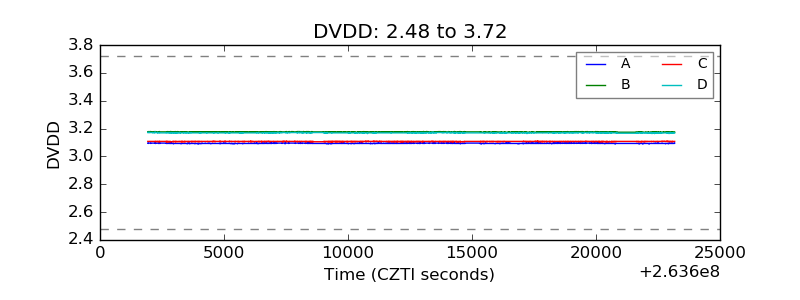 |
| Temperature 1 | 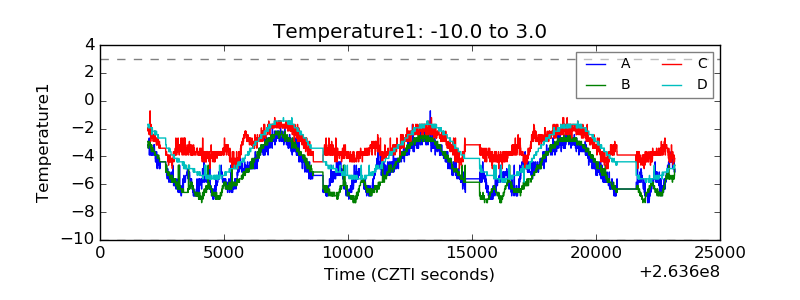 |
| Veto HV Monitor | 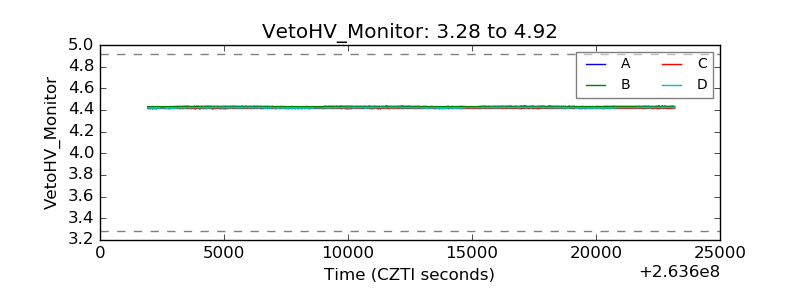 |
| Veto LLD | 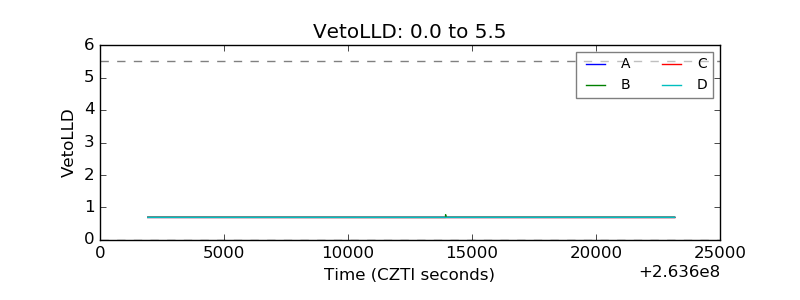 |
| Alpha Counter | 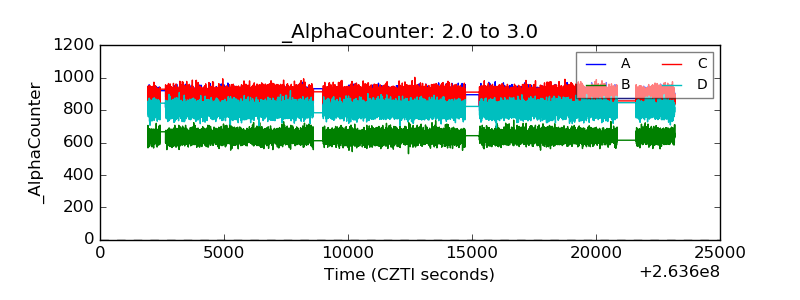 |
| _CPM_Rate | 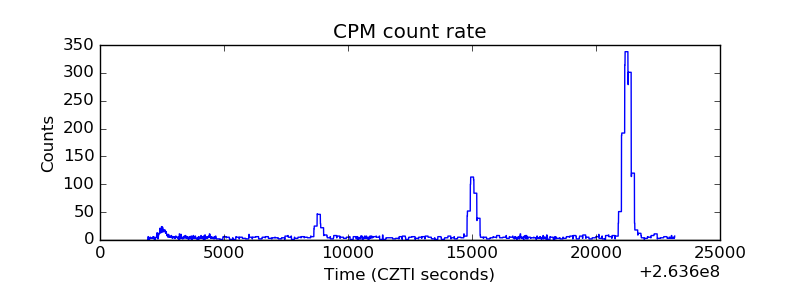 |
| CZT Counter |  |
| +2.5 Volts monitor |  |
| +5 Volts monitor |  |
| _ROLL_ROT | 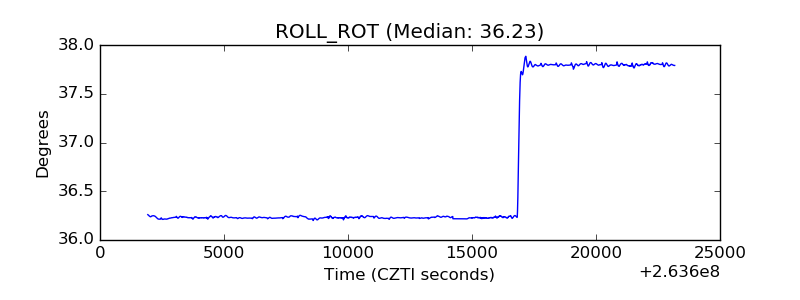 |
| _Roll_DEC | 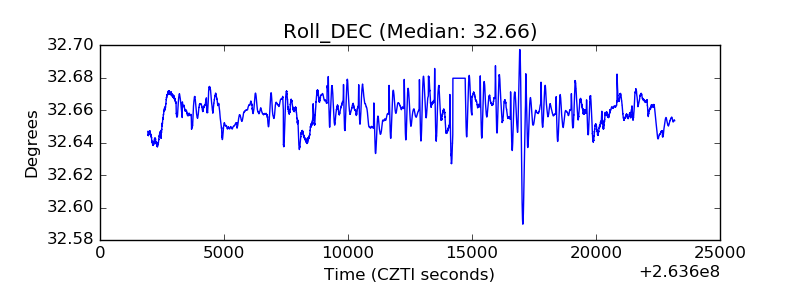 |
| _Roll_RA |  |
| Veto Counter | 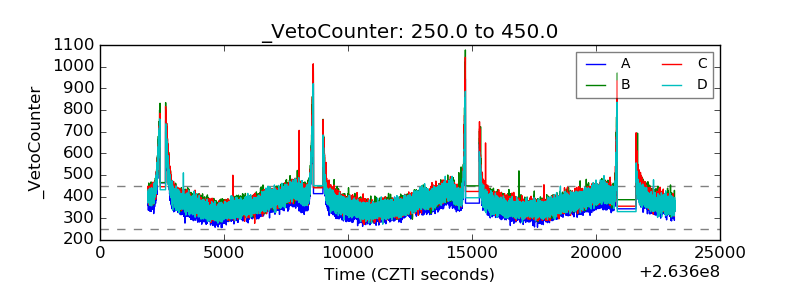 |