| Param | Original file | Final file |
|---|---|---|
| Filename | modeM0/AS1A04_218T04_9000002086_14136cztM0_level2.evt | modeM0/AS1A04_218T04_9000002086_14136cztM0_level2_quad_clean.evt |
| Size (bytes) | 166,691,520 | 28,396,800 |
| Size | 159.0 MB | 27.1 MB |
| Events in quadrant A | 983,273 | 181,248 |
| Events in quadrant B | 1,097,061 | 180,330 |
| Events in quadrant C | 1,001,124 | 184,229 |
| Events in quadrant D | 1,834,395 | 173,953 |
| Mode M0 | |||
|---|---|---|---|
| Quadrant | BADHDUFLAG | Total packets | Discarded packets |
| A | 0 | 4021 | 11 |
| B | 0 | 4365 | 6 |
| C | 0 | 3973 | 3 |
| D | 0 | 6855 | 11 |
| Mode SS | |||
|---|---|---|---|
| Quadrant | BADHDUFLAG | Total packets | Discarded packets |
| A | 0 | 40 | 0 |
| B | 0 | 40 | 0 |
| C | 0 | 40 | 0 |
| D | 0 | 40 | 0 |
| Mode M9 | |||
|---|---|---|---|
| Quadrant | BADHDUFLAG | Total packets | Discarded packets |
| A | 0 | 4 | 2 |
| B | 0 | 4 | 2 |
| C | 0 | 4 | 0 |
| D | 0 | 3 | 0 |
| Quadrant | Total seconds | Saturated seconds | Saturation percentage |
|---|---|---|---|
| A | 1915 | 19 | 0.992167% |
| B | 1917 | 21 | 1.095462% |
| C | 1918 | 3 | 0.156413% |
| D | 1916 | 115 | 6.002088% |
Noise dominated data is calculated using 1-second bins in cleaned event files. If a bin has >2000 counts, and if more than 50% of those come from <1% of pixels, then it is considered to be noise-dominated and hence unusable.
| Quadrant | # 1 sec bins | Bins with >0 counts | Bins with >2000 counts | High rate bins dominated by noise | Noise dominated (total time) | Noise dominated (detector-on time) | Marked lightcurve |
|---|---|---|---|---|---|---|---|
| A | 1922 | 1920 | 0 | 0 | 0.00% | 0.00% | 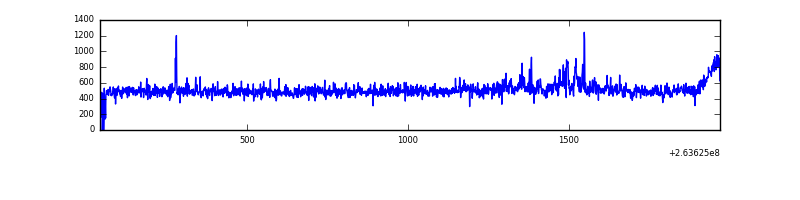 |
| B | 1924 | 1923 | 0 | 0 | 0.00% | 0.00% | 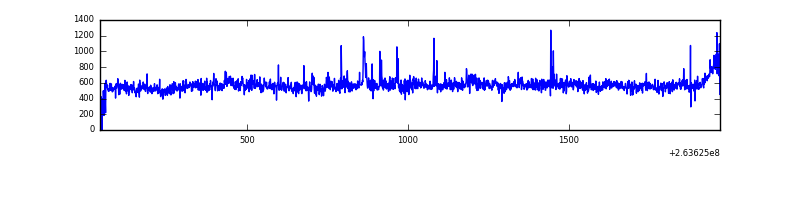 |
| C | 1927 | 1923 | 0 | 0 | 0.00% | 0.00% | 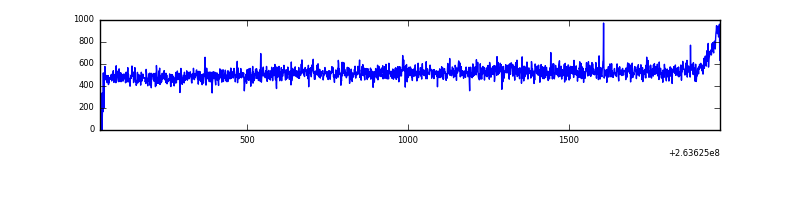 |
| D | 1927 | 1922 | 72 | 72 | 3.74% | 3.75% | 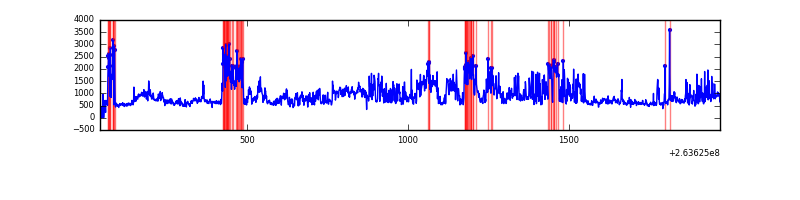 |
Top three noisy pixels from each quadrant. If the there are fewer than three noisy pixels in the level2.evt file, extra rows are filled as -1
| Pixel properties | Quadrant properties | ||||||
|---|---|---|---|---|---|---|---|
| Quadrant | DetID | PixID | Counts | Sigma | Mean | Median | Sigma |
| A | 12 | 189 | 26106 | 490.4 | 242 | 236 | 52.8 |
| A | 8 | 15 | 17329 | 324.02 | 242 | 236 | 52.8 |
| A | 12 | 96 | 6261 | 114.21 | 242 | 236 | 52.8 |
| B | 10 | 244 | 117400 | 2388.95 | 242 | 234 | 49.0 |
| B | 0 | 189 | 11920 | 238.26 | 242 | 234 | 49.0 |
| B | 3 | 209 | 10966 | 218.81 | 242 | 234 | 49.0 |
| C | 3 | 233 | 56453 | 964.67 | 241 | 242 | 58.3 |
| C | 13 | 61 | 1659 | 24.32 | 241 | 242 | 58.3 |
| C | 10 | 22 | 1534 | 22.17 | 241 | 242 | 58.3 |
| D | 10 | 172 | 700616 | 12185.17 | 235 | 229 | 57.5 |
| D | 8 | 195 | 125865 | 2185.79 | 235 | 229 | 57.5 |
| D | 1 | 52 | 38143 | 659.62 | 235 | 229 | 57.5 |
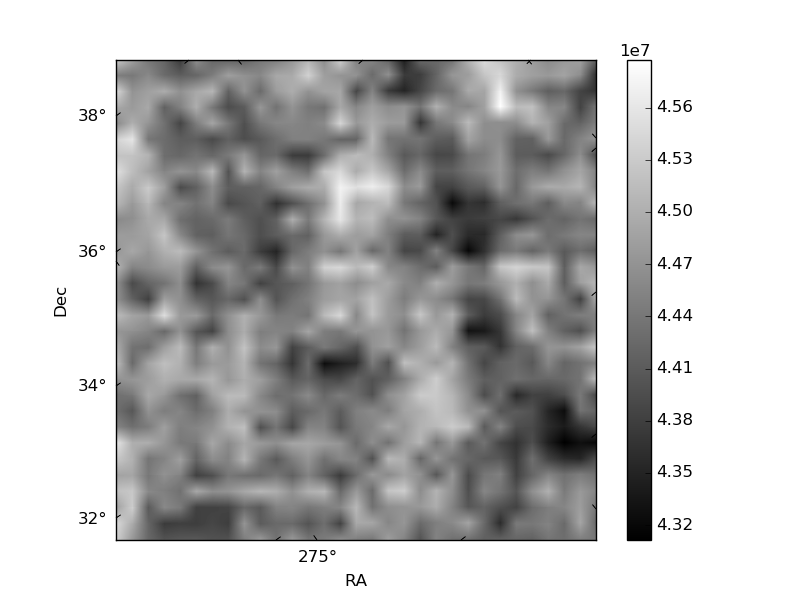
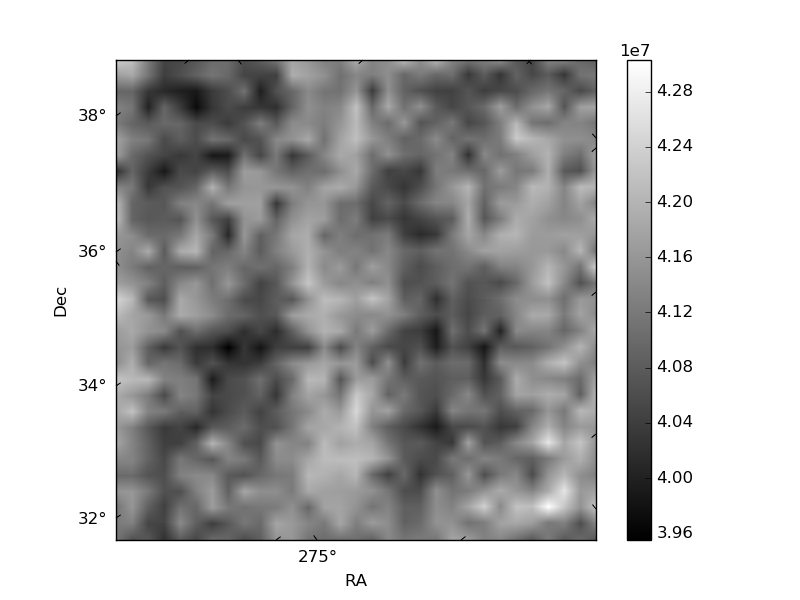
Histogram calculated using DETX and DETY for each event in the final _common_clean file
| Quadrant A | 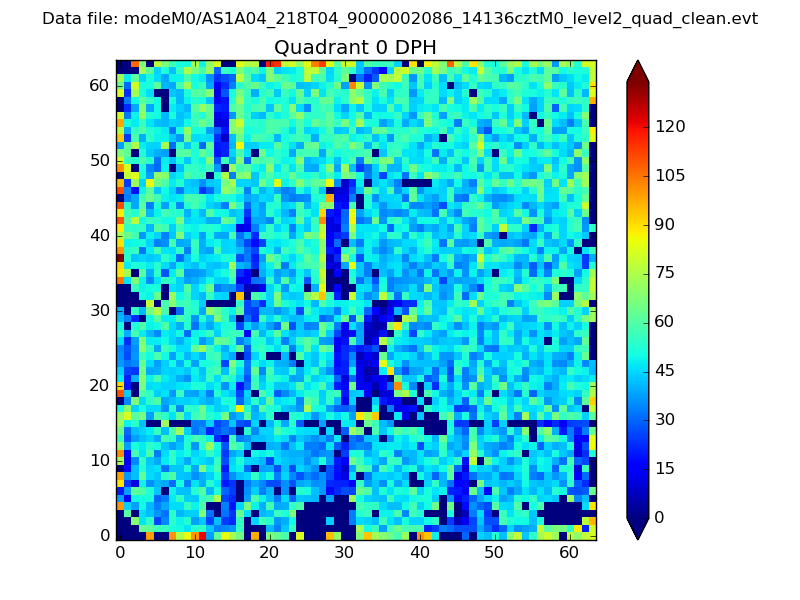 |
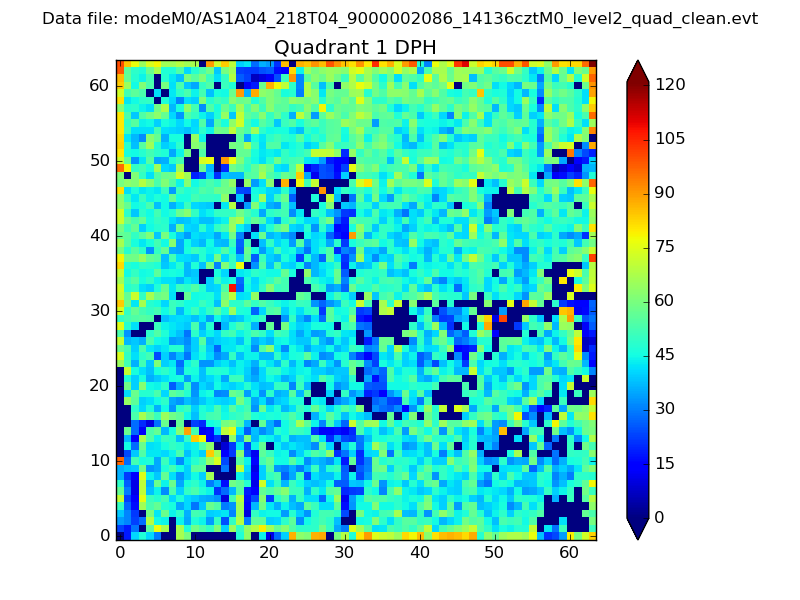 |
Quadrant B |
|---|---|---|---|
| Quadrant D | 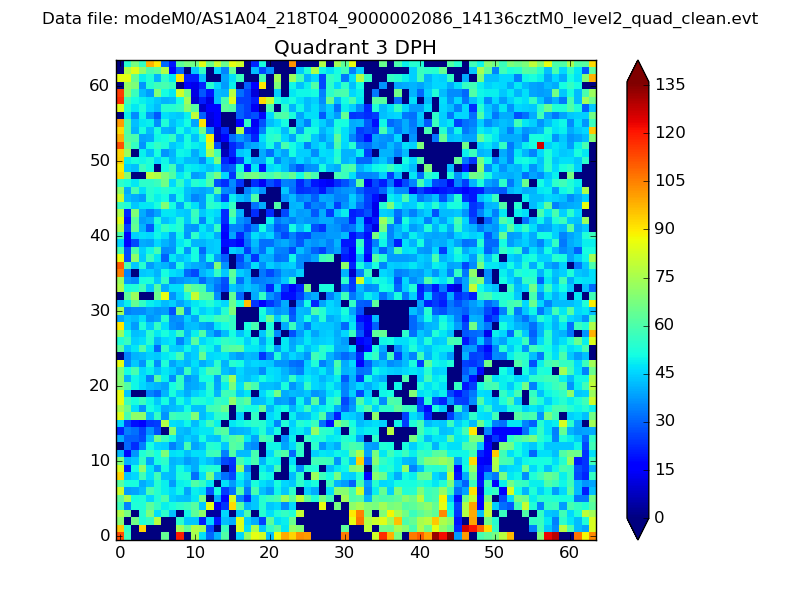 |
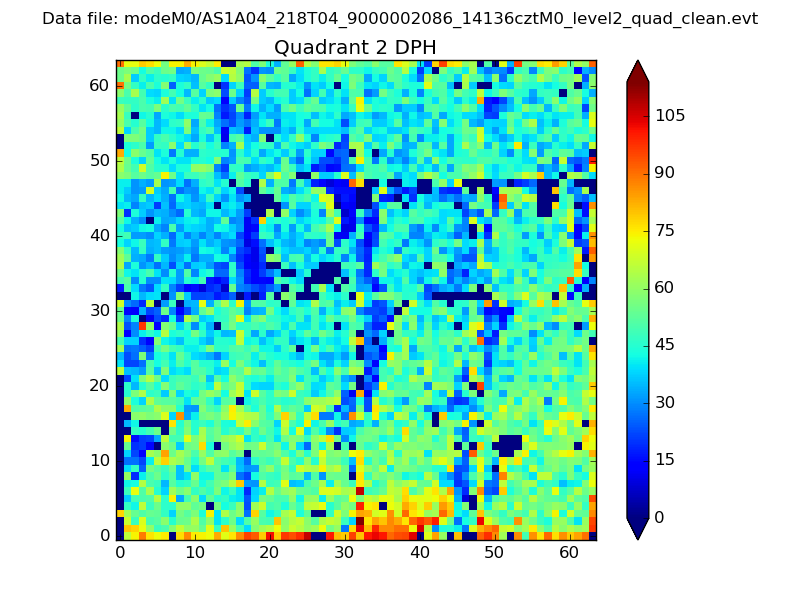 |
Quadrant C |
| Plot type | Count rate plots | Images |
|---|---|---|
| Comparison with Poisson distribution Blue bars denote a histogram of data divided into 1 sec bins. Red curve is a Poisson curve with rate = median count rate of data. |
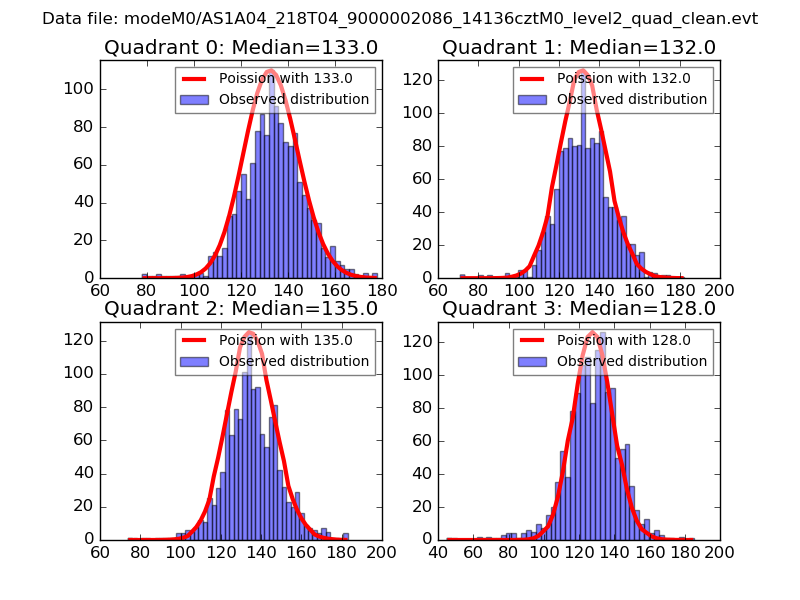 |
 |
| Quadrant-wise count rates Data is divided into 100 sec bins |
 |
|
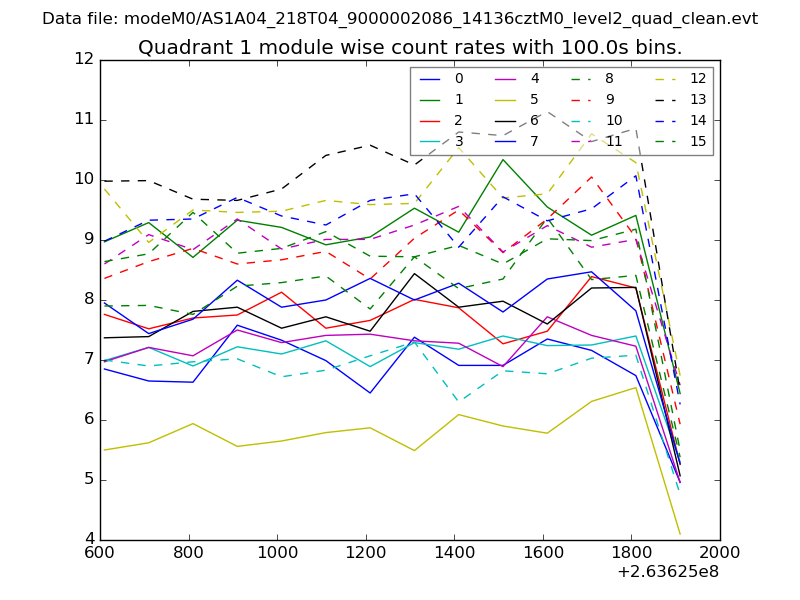
| Module-wise count rates for Quadrant A Data is divided into 100 sec bins |
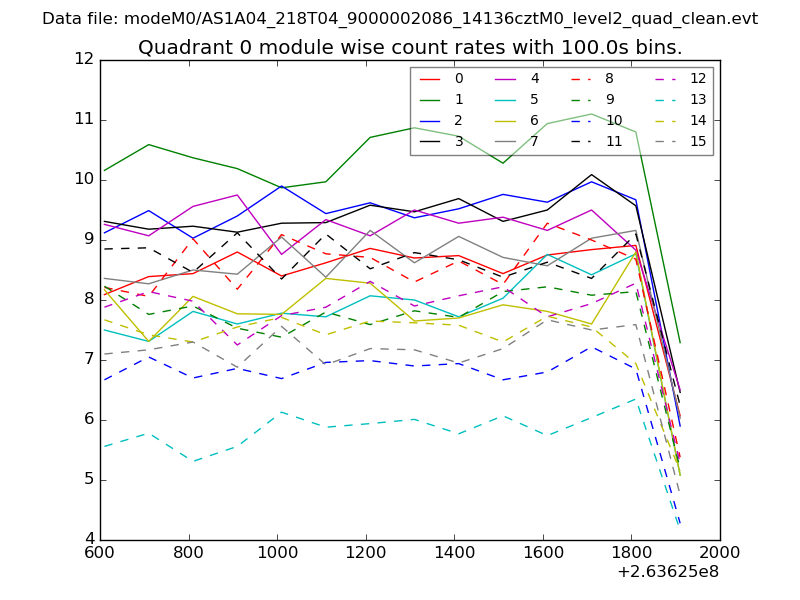 |
 |
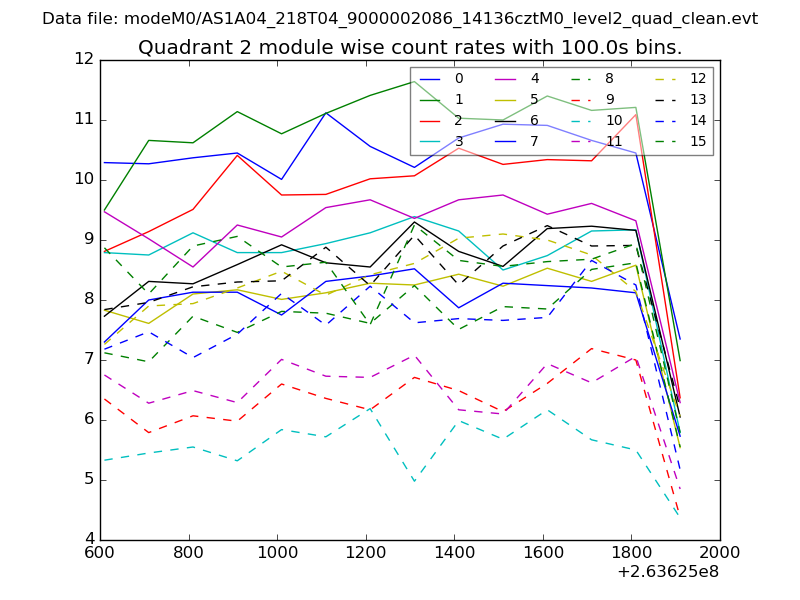
| Module-wise count rates for Quadrant B Data is divided into 100 sec bins |
 |
 |
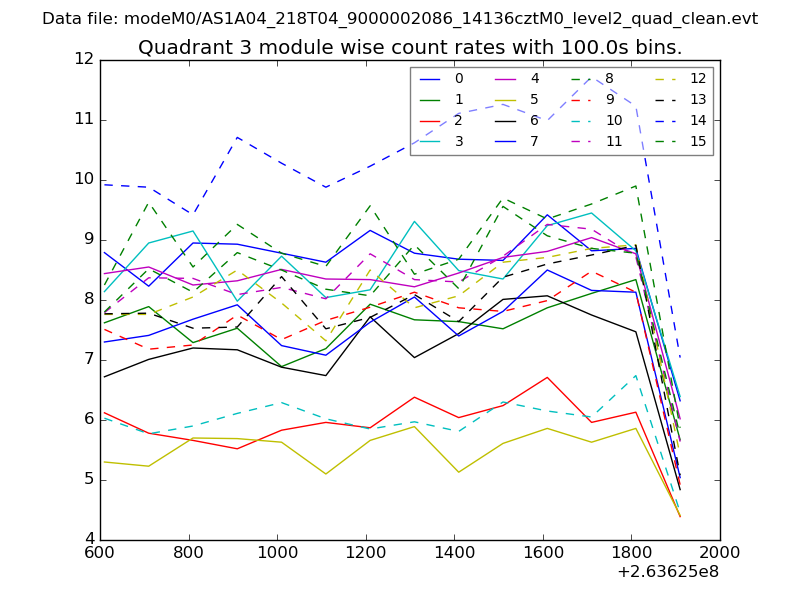
| Module-wise count rates for Quadrant C Data is divided into 100 sec bins |
 |
 |
| Module-wise count rates for Quadrant D Data is divided into 100 sec bins |
 |
 |
| Parameter | Plot |
|---|---|
| CZT HV Monitor | 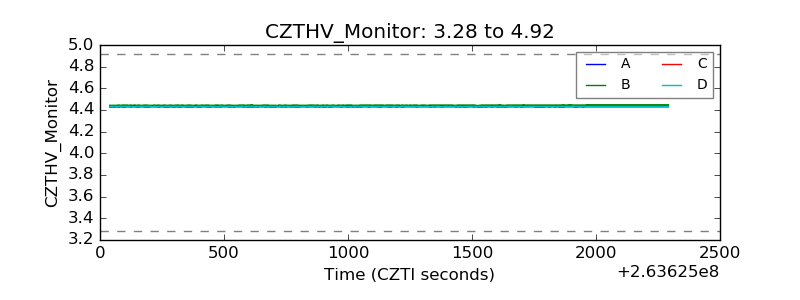 |
| D_VDD | 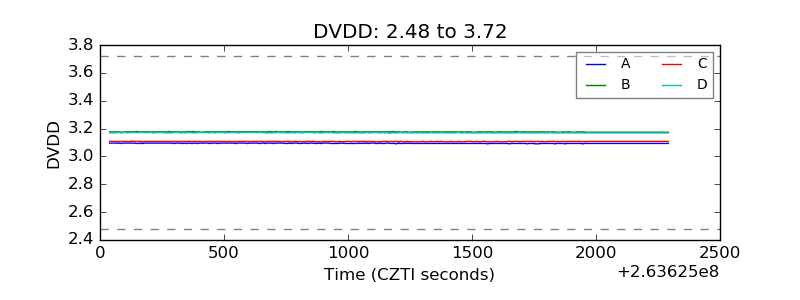 |
| Temperature 1 | 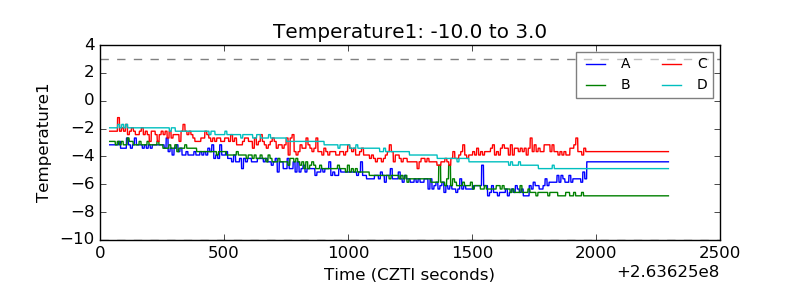 |
| Veto HV Monitor | 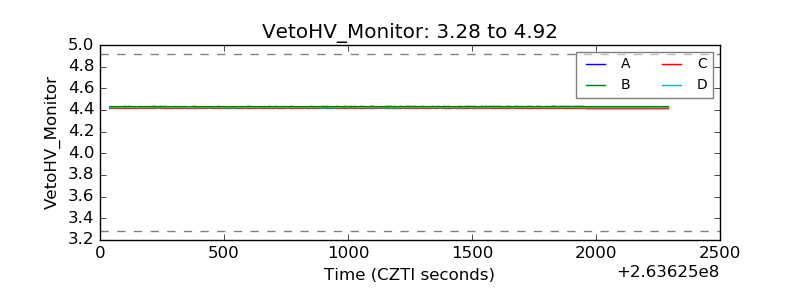 |
| Veto LLD | 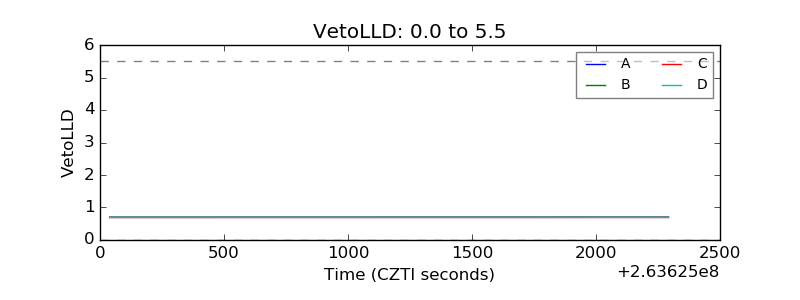 |
| Alpha Counter |  |
| _CPM_Rate | 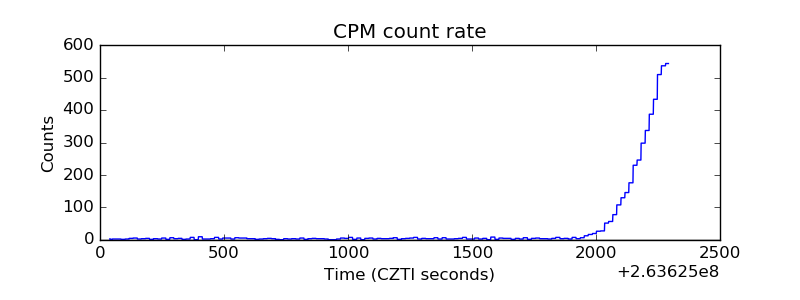 |
| CZT Counter |  |
| +2.5 Volts monitor |  |
| +5 Volts monitor |  |
| _ROLL_ROT | 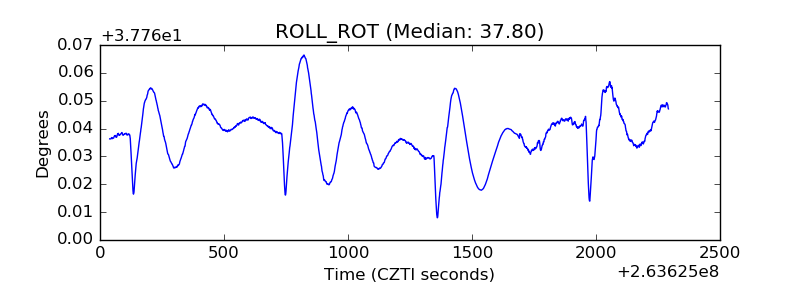 |
| _Roll_DEC | 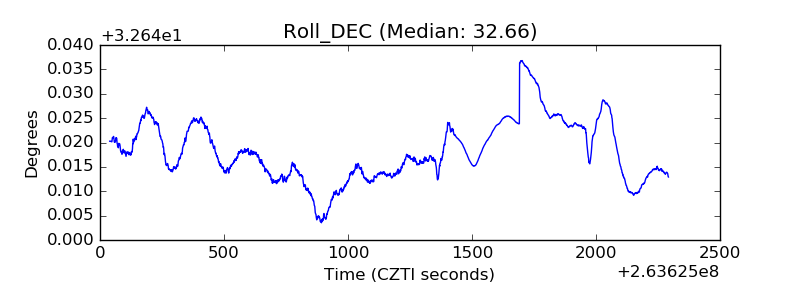 |
| _Roll_RA | 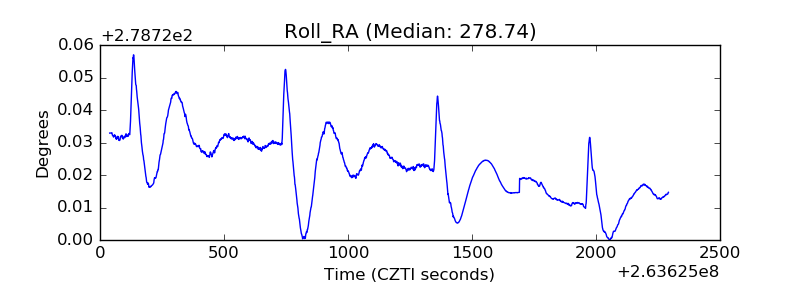 |
| Veto Counter | 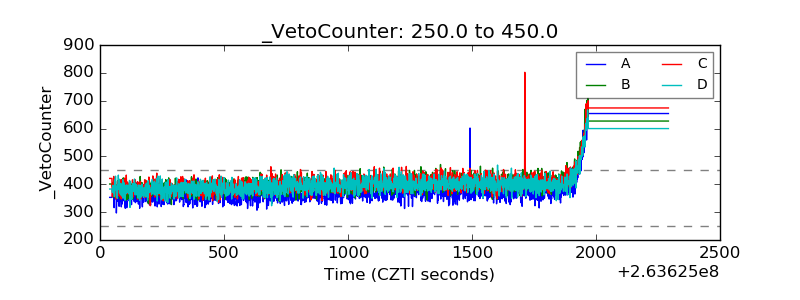 |