| Param | Original file | Final file |
|---|---|---|
| Filename | modeM0/AS1A04_218T04_9000002086_14138cztM0_level2.evt | modeM0/AS1A04_218T04_9000002086_14138cztM0_level2_quad_clean.evt |
| Size (bytes) | 489,165,120 | 70,994,880 |
| Size | 466.5 MB | 67.7 MB |
| Events in quadrant A | 2,658,582 | 448,920 |
| Events in quadrant B | 2,737,188 | 445,512 |
| Events in quadrant C | 2,705,375 | 452,518 |
| Events in quadrant D | 6,343,971 | 421,999 |
| Mode M0 | |||
|---|---|---|---|
| Quadrant | BADHDUFLAG | Total packets | Discarded packets |
| A | 0 | 11263 | 27 |
| B | 0 | 11387 | 32 |
| C | 0 | 11217 | 51 |
| D | 0 | 22482 | 50 |
| Mode SS | |||
|---|---|---|---|
| Quadrant | BADHDUFLAG | Total packets | Discarded packets |
| A | 0 | 110 | 0 |
| B | 0 | 110 | 0 |
| C | 0 | 110 | 0 |
| D | 0 | 110 | 0 |
| Mode M9 | |||
|---|---|---|---|
| Quadrant | BADHDUFLAG | Total packets | Discarded packets |
| A | 0 | 9 | 0 |
| B | 0 | 9 | 0 |
| C | 0 | 9 | 0 |
| D | 0 | 10 | 0 |
| Quadrant | Total seconds | Saturated seconds | Saturation percentage |
|---|---|---|---|
| A | 5443 | 36 | 0.661400% |
| B | 5442 | 41 | 0.753399% |
| C | 5432 | 29 | 0.533873% |
| D | 5439 | 1197 | 22.007722% |
Noise dominated data is calculated using 1-second bins in cleaned event files. If a bin has >2000 counts, and if more than 50% of those come from <1% of pixels, then it is considered to be noise-dominated and hence unusable.
| Quadrant | # 1 sec bins | Bins with >0 counts | Bins with >2000 counts | High rate bins dominated by noise | Noise dominated (total time) | Noise dominated (detector-on time) | Marked lightcurve |
|---|---|---|---|---|---|---|---|
| A | 6748 | 5461 | 2 | 2 | 0.03% | 0.04% | 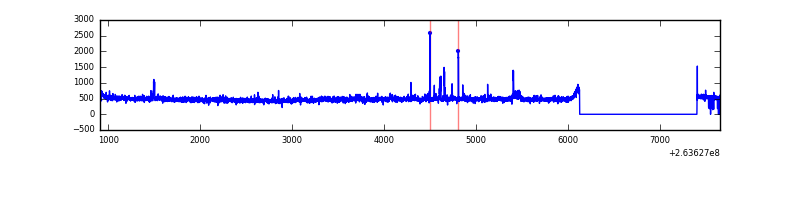 |
| B | 6747 | 5456 | 2 | 2 | 0.03% | 0.04% | 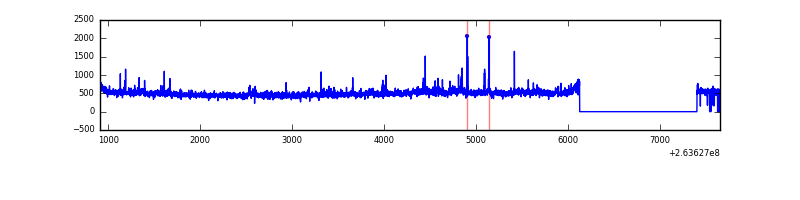 |
| C | 6745 | 5455 | 0 | 0 | 0.00% | 0.00% | 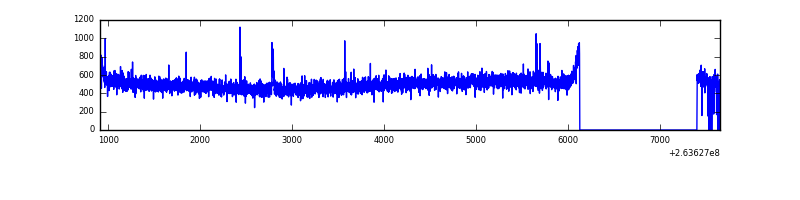 |
| D | 6748 | 5459 | 1010 | 1010 | 14.97% | 18.50% | 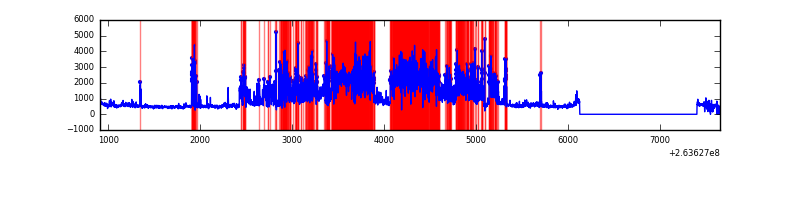 |
Top three noisy pixels from each quadrant. If the there are fewer than three noisy pixels in the level2.evt file, extra rows are filled as -1
| Pixel properties | Quadrant properties | ||||||
|---|---|---|---|---|---|---|---|
| Quadrant | DetID | PixID | Counts | Sigma | Mean | Median | Sigma |
| A | 12 | 189 | 75654 | 565.4 | 659 | 645 | 132.7 |
| A | 8 | 15 | 40497 | 300.4 | 659 | 645 | 132.7 |
| A | 0 | 226 | 5924 | 39.79 | 659 | 645 | 132.7 |
| B | 10 | 244 | 85944 | 672.46 | 654 | 637 | 126.9 |
| B | 0 | 189 | 43395 | 337.05 | 654 | 637 | 126.9 |
| B | 0 | 214 | 29655 | 228.74 | 654 | 637 | 126.9 |
| C | 3 | 233 | 210650 | 1408.54 | 637 | 640 | 149.1 |
| C | 7 | 220 | 7130 | 43.53 | 637 | 640 | 149.1 |
| C | 13 | 61 | 4537 | 26.14 | 637 | 640 | 149.1 |
| D | 7 | 80 | 3619406 | 25532.0 | 590 | 575 | 141.7 |
| D | 8 | 195 | 196052 | 1379.15 | 590 | 575 | 141.7 |
| D | 2 | 152 | 106739 | 749.02 | 590 | 575 | 141.7 |
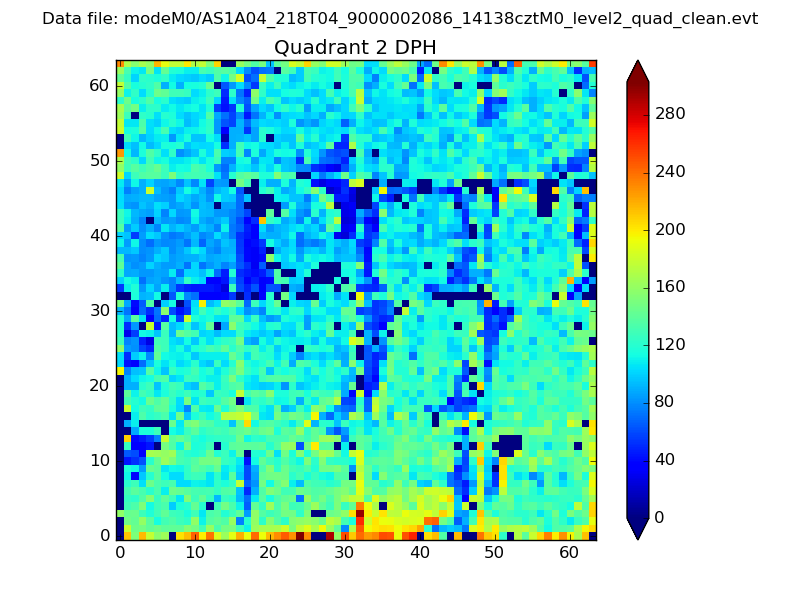
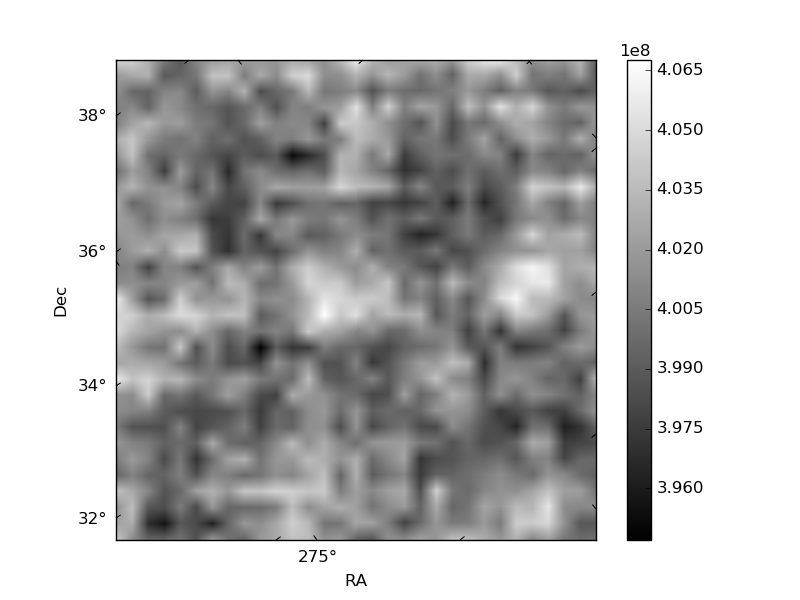
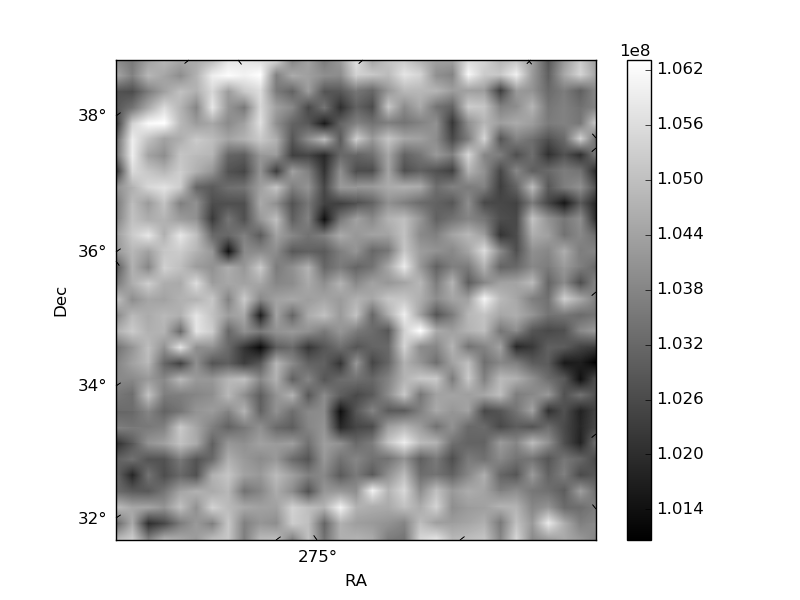
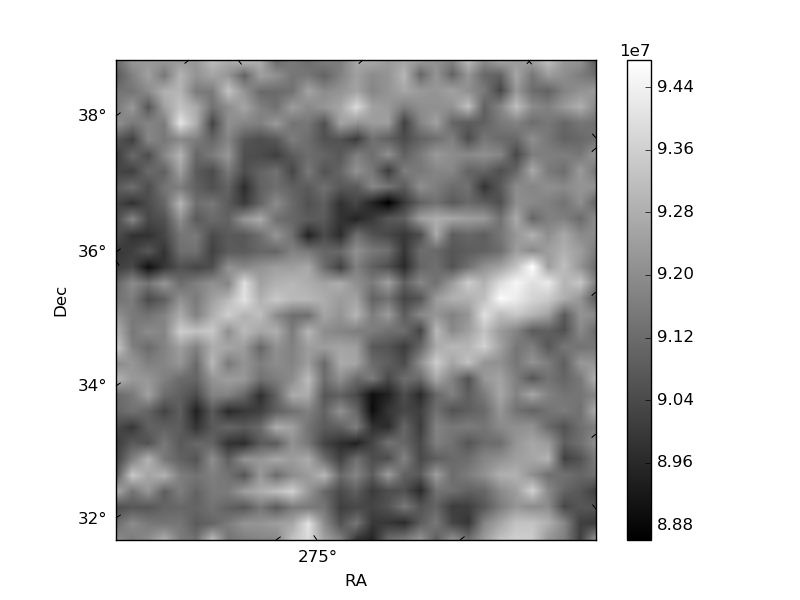
Histogram calculated using DETX and DETY for each event in the final _common_clean file
| Quadrant A | 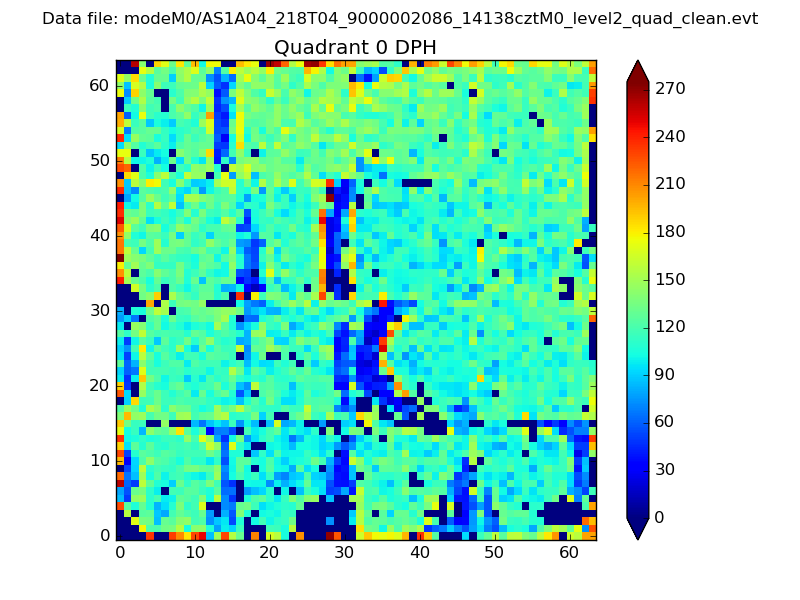 |
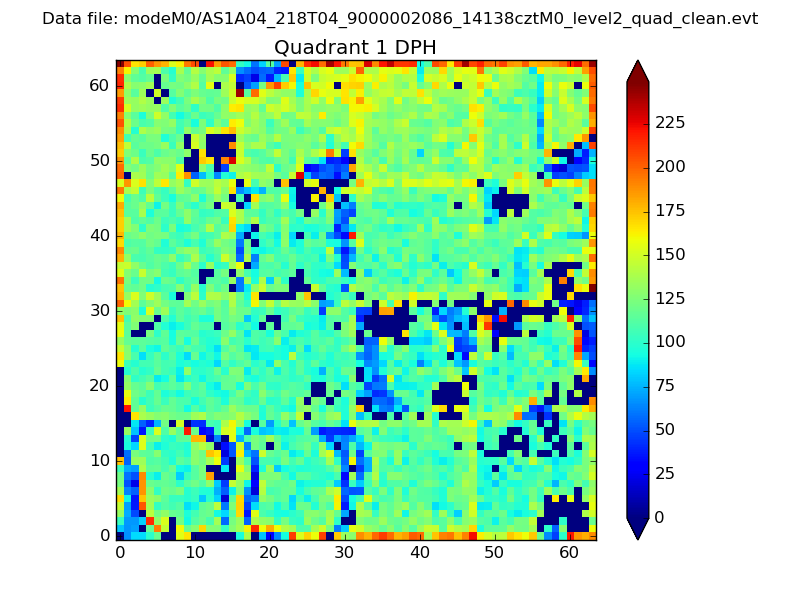 |
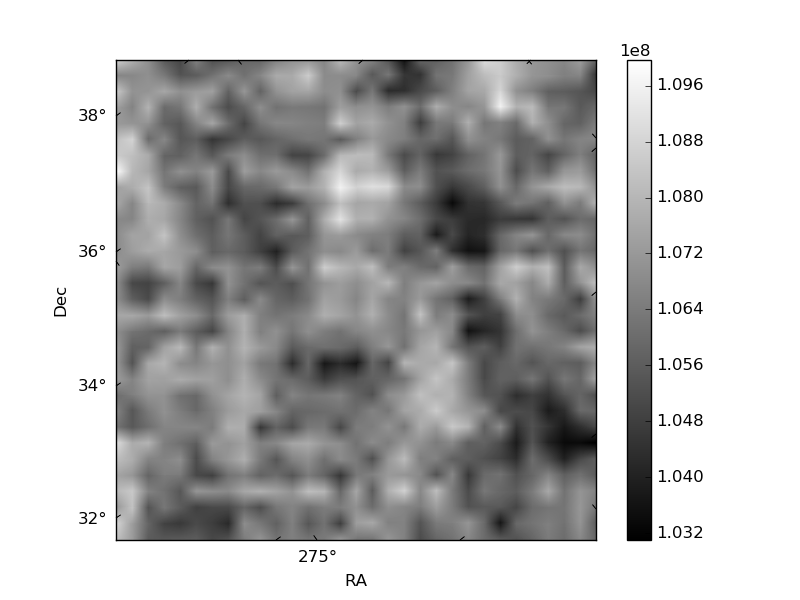
Quadrant B |
|---|---|---|---|
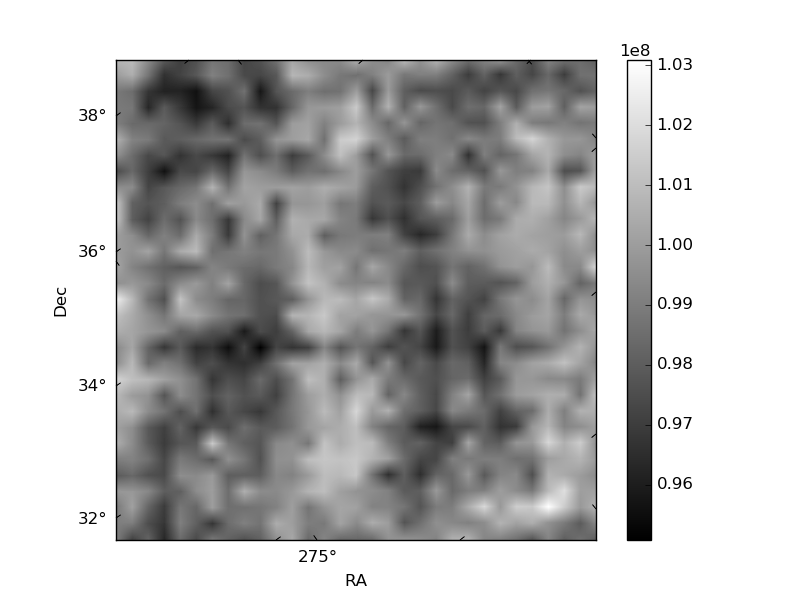
| Quadrant D | 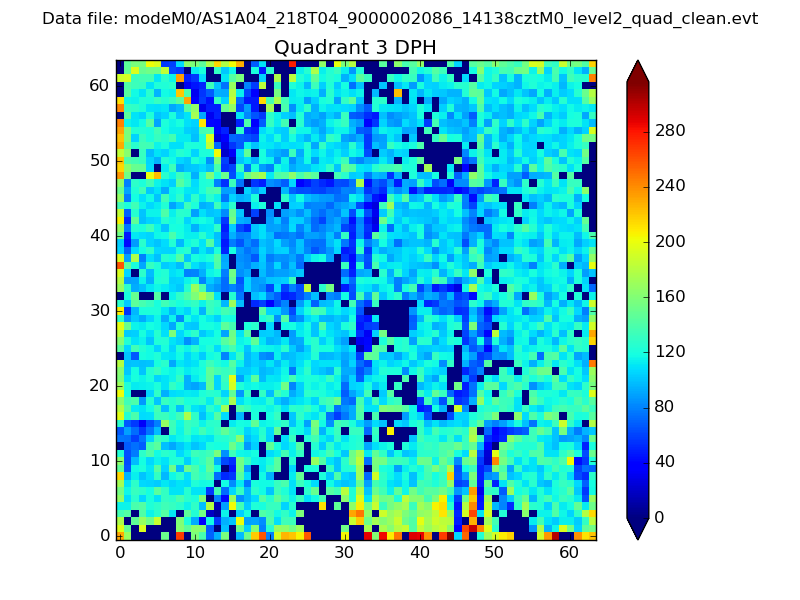 |
 |
Quadrant C |
| Plot type | Count rate plots | Images |
|---|---|---|
| Comparison with Poisson distribution Blue bars denote a histogram of data divided into 1 sec bins. Red curve is a Poisson curve with rate = median count rate of data. |
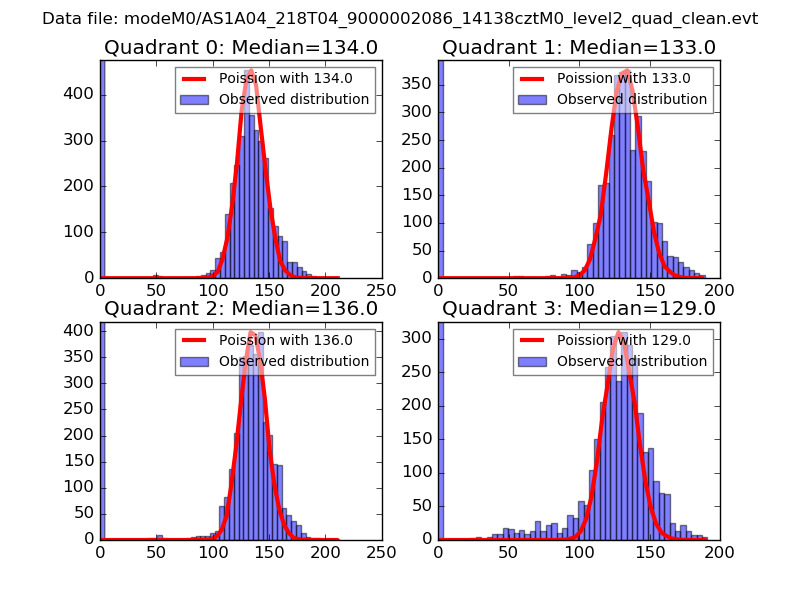 |
 |
| Quadrant-wise count rates Data is divided into 100 sec bins |
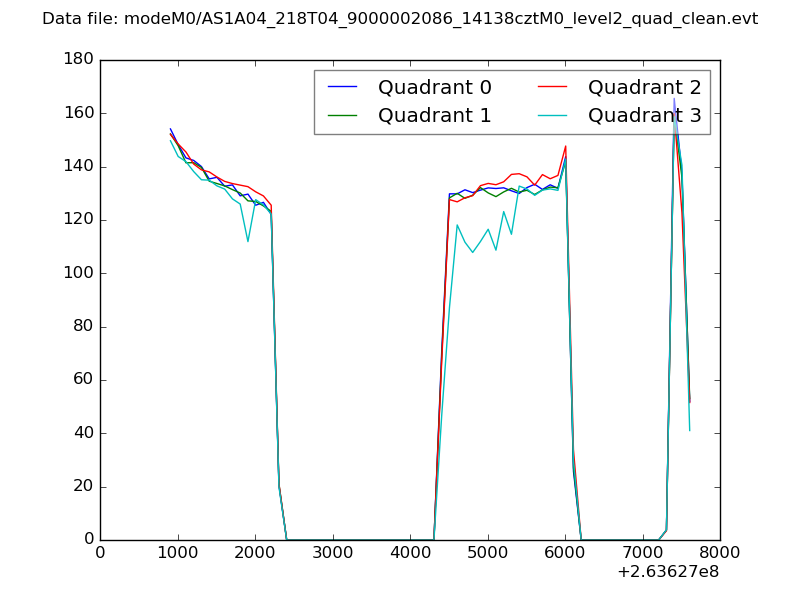 |
|
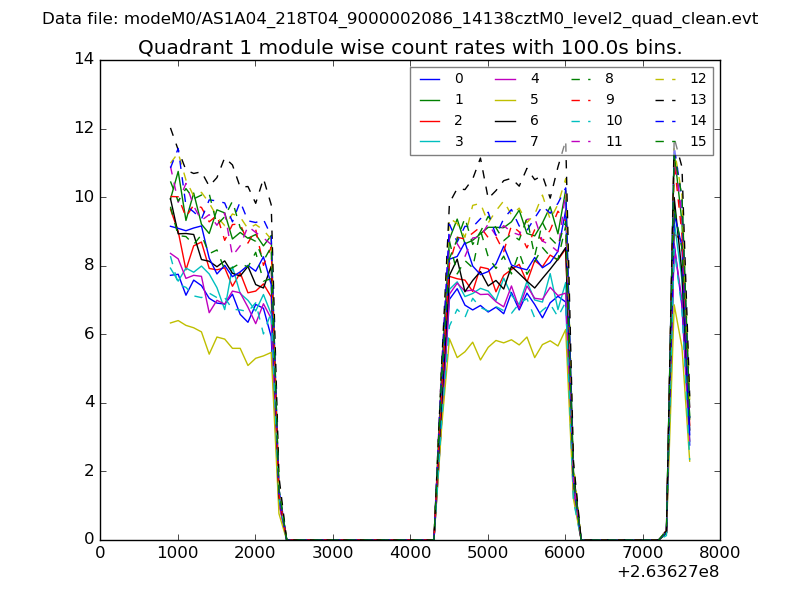
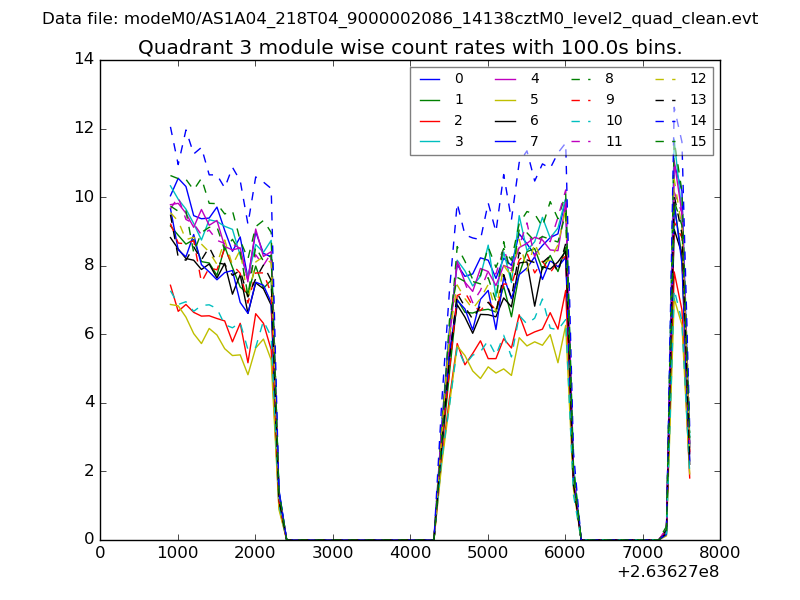
| Module-wise count rates for Quadrant A Data is divided into 100 sec bins |
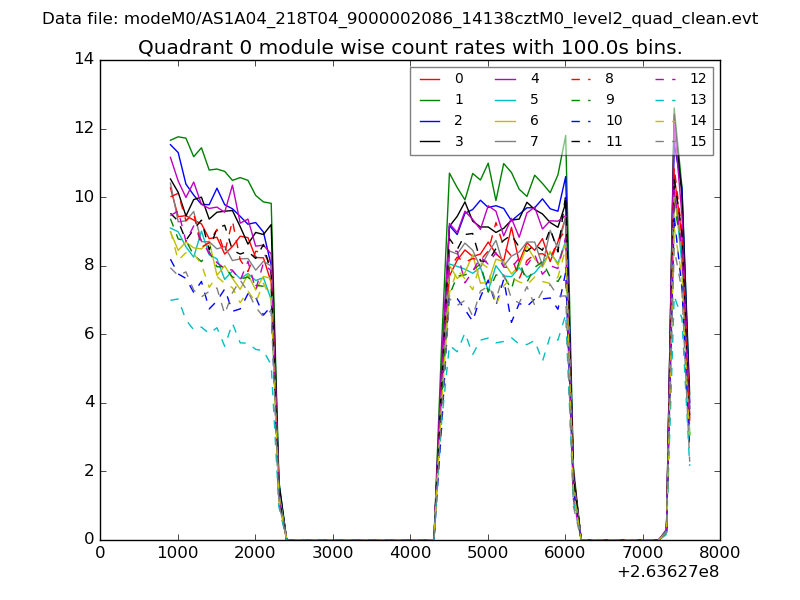 |
 |
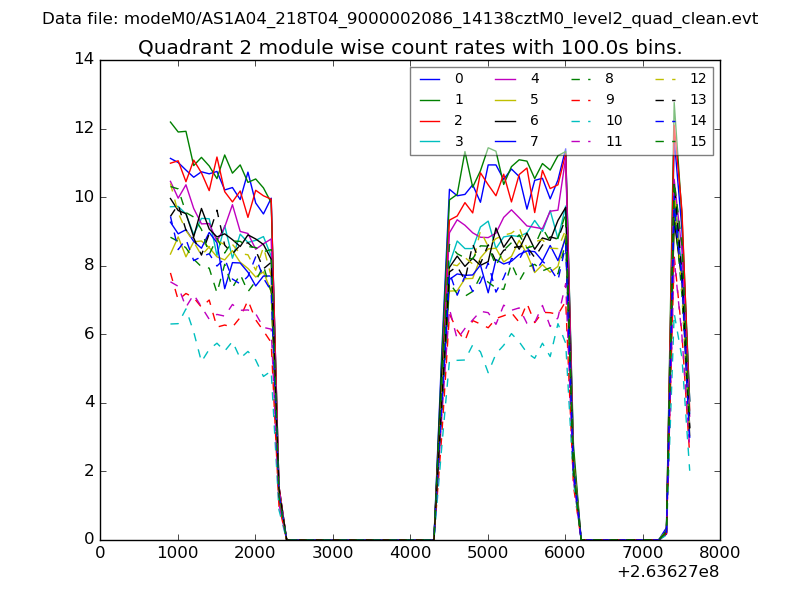
| Module-wise count rates for Quadrant B Data is divided into 100 sec bins |
 |
 |
| Module-wise count rates for Quadrant C Data is divided into 100 sec bins |
 |
 |
| Module-wise count rates for Quadrant D Data is divided into 100 sec bins |
 |
 |
| Parameter | Plot |
|---|---|
| CZT HV Monitor | 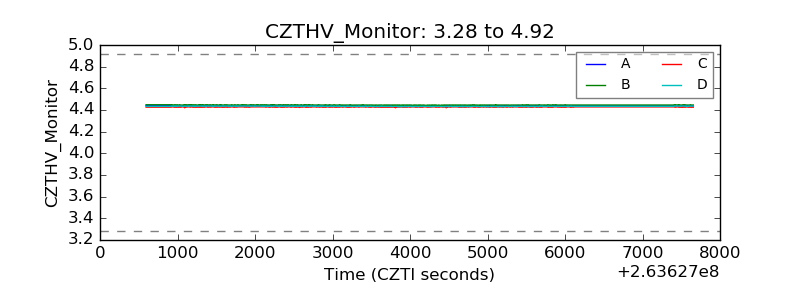 |
| D_VDD | 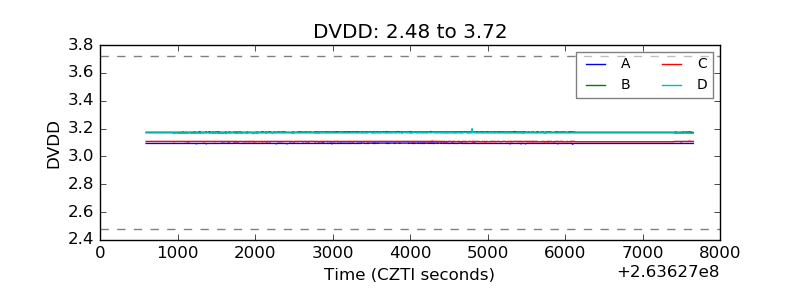 |
| Temperature 1 | 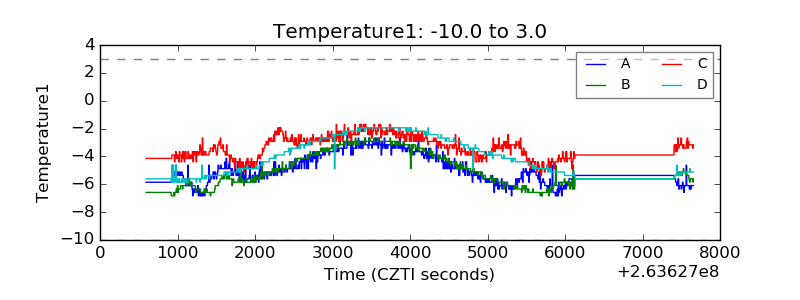 |
| Veto HV Monitor | 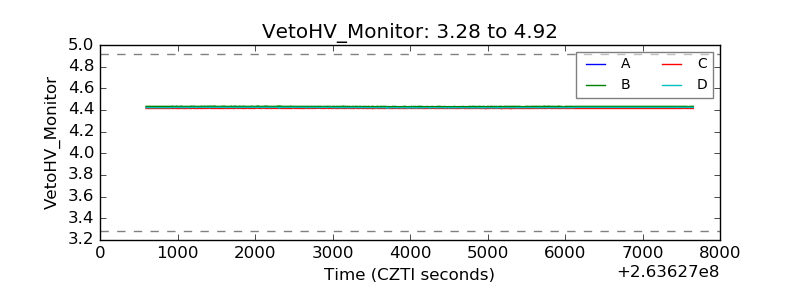 |
| Veto LLD | 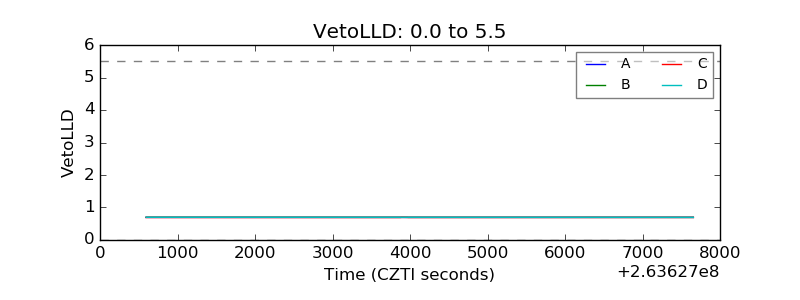 |
| Alpha Counter | 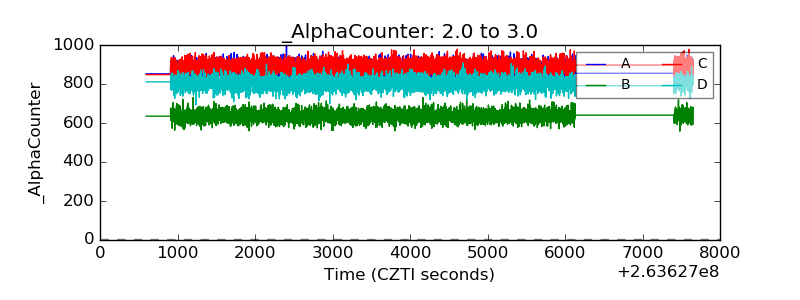 |
| _CPM_Rate | 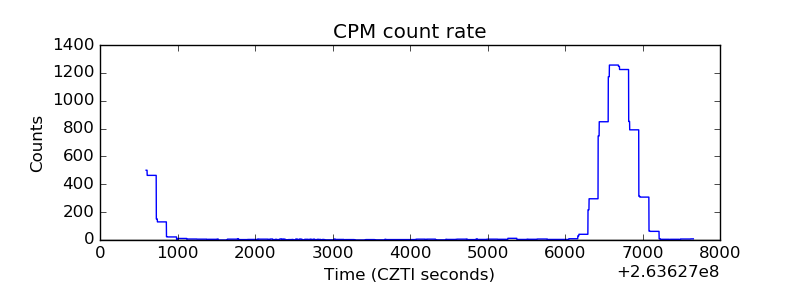 |
| CZT Counter | 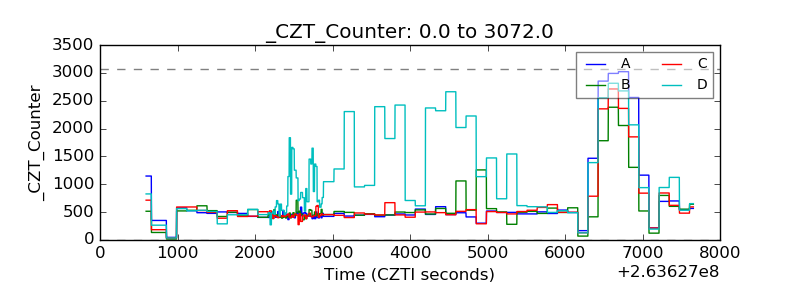 |
| +2.5 Volts monitor | 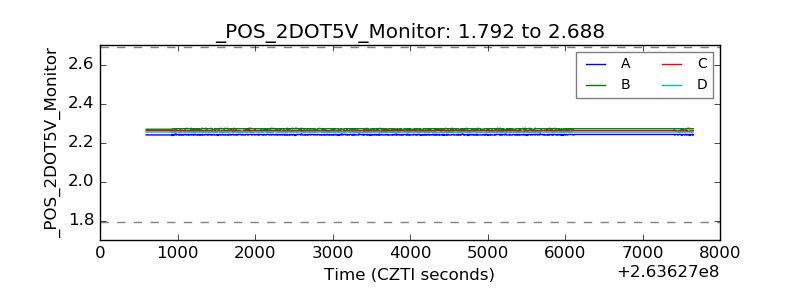 |
| +5 Volts monitor | 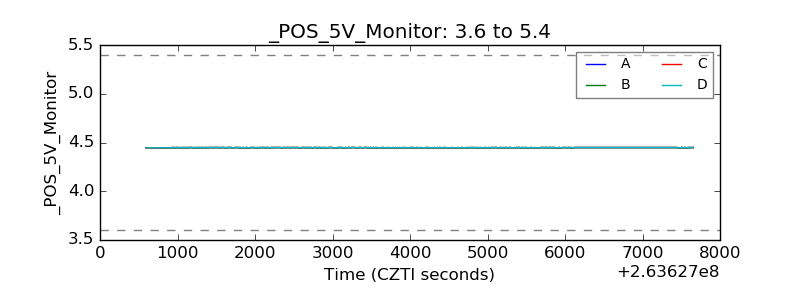 |
| _ROLL_ROT | 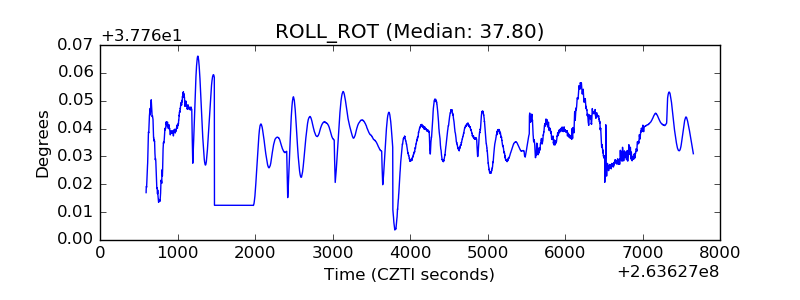 |
| _Roll_DEC |  |
| _Roll_RA | 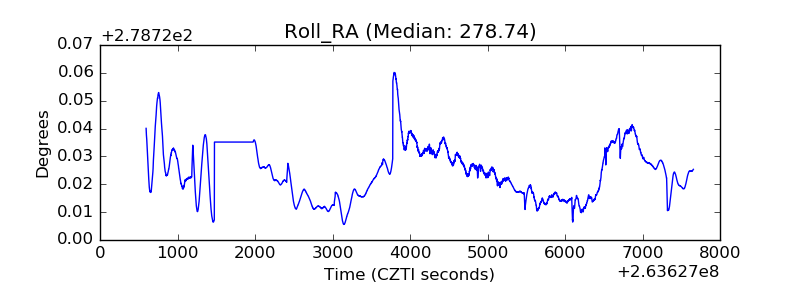 |
| Veto Counter | 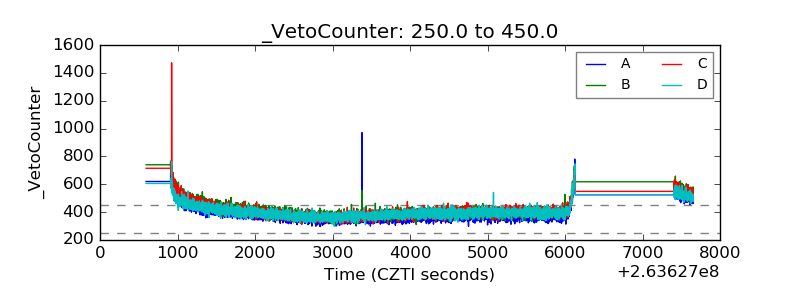 |