| Param | Original file | Final file |
|---|---|---|
| Filename | modeM0/AS1A04_218T04_9000002086_14139cztM0_level2.evt | modeM0/AS1A04_218T04_9000002086_14139cztM0_level2_quad_clean.evt |
| Size (bytes) | 472,152,960 | 73,992,960 |
| Size | 450.3 MB | 70.6 MB |
| Events in quadrant A | 3,048,953 | 458,709 |
| Events in quadrant B | 3,150,347 | 458,320 |
| Events in quadrant C | 3,168,176 | 464,042 |
| Events in quadrant D | 4,515,797 | 431,312 |
| Mode M0 | |||
|---|---|---|---|
| Quadrant | BADHDUFLAG | Total packets | Discarded packets |
| A | 0 | 12779 | 2 |
| B | 0 | 13056 | 1 |
| C | 0 | 12851 | 1 |
| D | 0 | 17475 | 1 |
| Mode SS | |||
|---|---|---|---|
| Quadrant | BADHDUFLAG | Total packets | Discarded packets |
| A | 0 | 124 | 0 |
| B | 0 | 124 | 0 |
| C | 0 | 124 | 0 |
| D | 0 | 124 | 0 |
| Mode M9 | |||
|---|---|---|---|
| Quadrant | BADHDUFLAG | Total packets | Discarded packets |
| A | 0 | 12 | 0 |
| B | 0 | 12 | 0 |
| C | 0 | 12 | 0 |
| D | 0 | 12 | 0 |
| Quadrant | Total seconds | Saturated seconds | Saturation percentage |
|---|---|---|---|
| A | 6131 | 46 | 0.750285% |
| B | 6131 | 54 | 0.880770% |
| C | 6131 | 30 | 0.489317% |
| D | 6131 | 263 | 4.289675% |
Noise dominated data is calculated using 1-second bins in cleaned event files. If a bin has >2000 counts, and if more than 50% of those come from <1% of pixels, then it is considered to be noise-dominated and hence unusable.
| Quadrant | # 1 sec bins | Bins with >0 counts | Bins with >2000 counts | High rate bins dominated by noise | Noise dominated (total time) | Noise dominated (detector-on time) | Marked lightcurve |
|---|---|---|---|---|---|---|---|
| A | 7307 | 6133 | 1 | 1 | 0.01% | 0.02% | 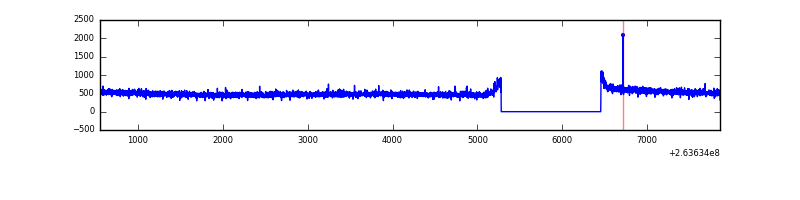 |
| B | 7307 | 6133 | 0 | 0 | 0.00% | 0.00% | 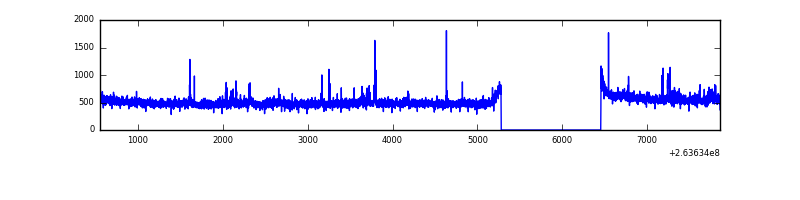 |
| C | 7307 | 6133 | 1 | 1 | 0.01% | 0.02% | 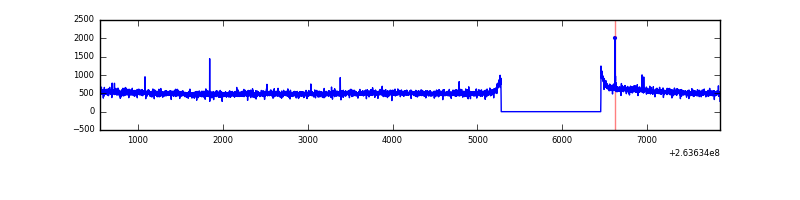 |
| D | 7307 | 6133 | 188 | 188 | 2.57% | 3.07% | 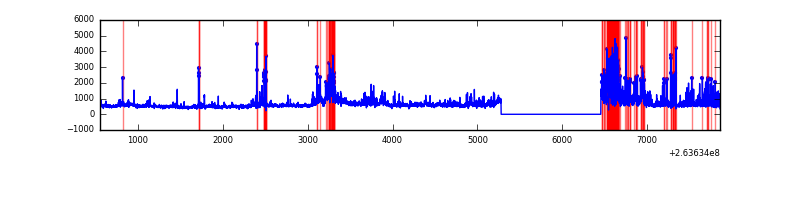 |
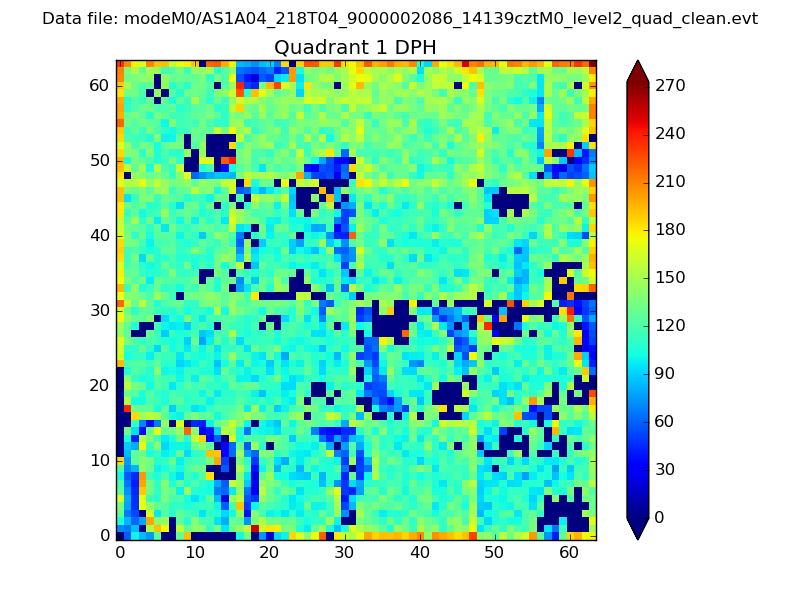
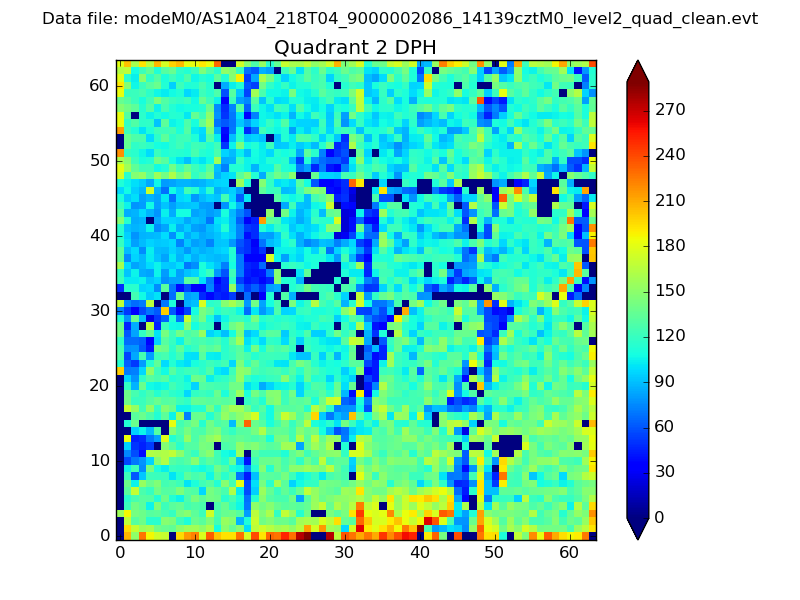
Top three noisy pixels from each quadrant. If the there are fewer than three noisy pixels in the level2.evt file, extra rows are filled as -1
| Pixel properties | Quadrant properties | ||||||
|---|---|---|---|---|---|---|---|
| Quadrant | DetID | PixID | Counts | Sigma | Mean | Median | Sigma |
| A | 0 | 226 | 6951 | 39.19 | 788 | 774 | 157.6 |
| A | 12 | 189 | 6689 | 37.52 | 788 | 774 | 157.6 |
| A | 12 | 194 | 5967 | 32.94 | 788 | 774 | 157.6 |
| B | 0 | 214 | 42553 | 283.35 | 776 | 757 | 147.5 |
| B | 0 | 189 | 25201 | 165.71 | 776 | 757 | 147.5 |
| B | 12 | 111 | 17063 | 110.54 | 776 | 757 | 147.5 |
| C | 3 | 233 | 218760 | 1252.1 | 755 | 758 | 174.1 |
| C | 14 | 234 | 6490 | 32.92 | 755 | 758 | 174.1 |
| C | 13 | 61 | 5292 | 26.04 | 755 | 758 | 174.1 |
| D | 7 | 80 | 751866 | 4232.46 | 746 | 729 | 177.5 |
| D | 1 | 52 | 506821 | 2851.7 | 746 | 729 | 177.5 |
| D | 8 | 195 | 140938 | 790.04 | 746 | 729 | 177.5 |
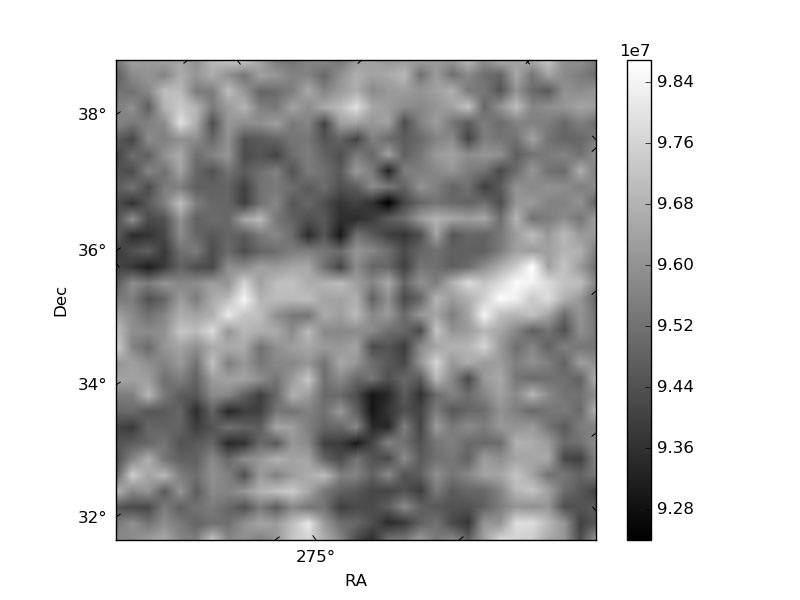
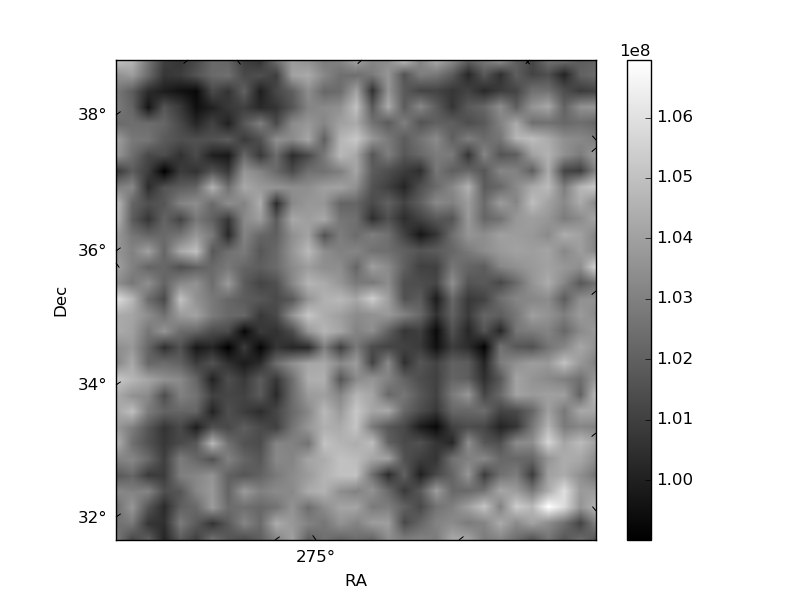
Histogram calculated using DETX and DETY for each event in the final _common_clean file
| Quadrant A | 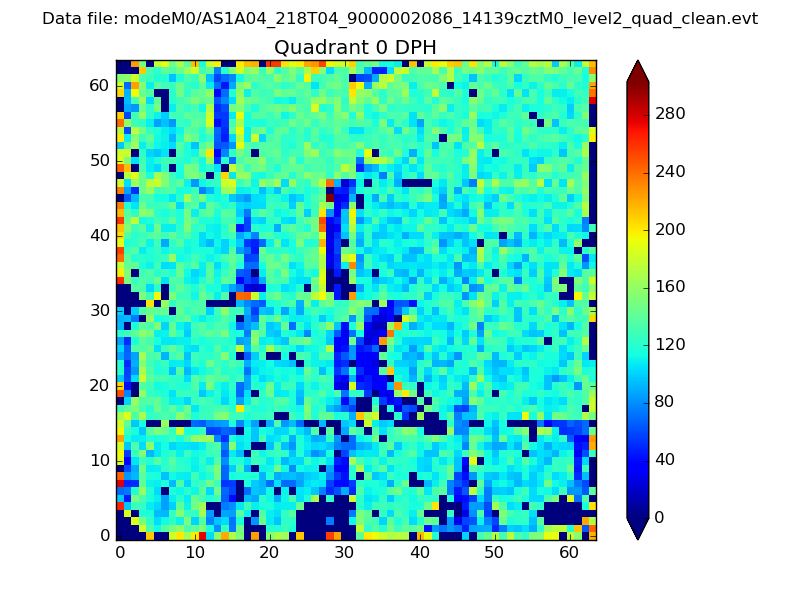 |
 |
Quadrant B |
|---|---|---|---|
| Quadrant D | 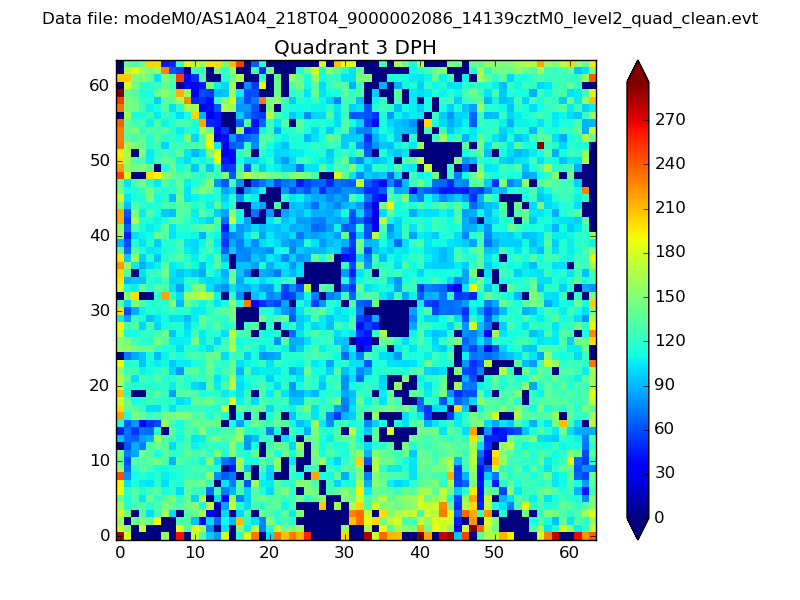 |
 |
Quadrant C |
| Plot type | Count rate plots | Images |
|---|---|---|
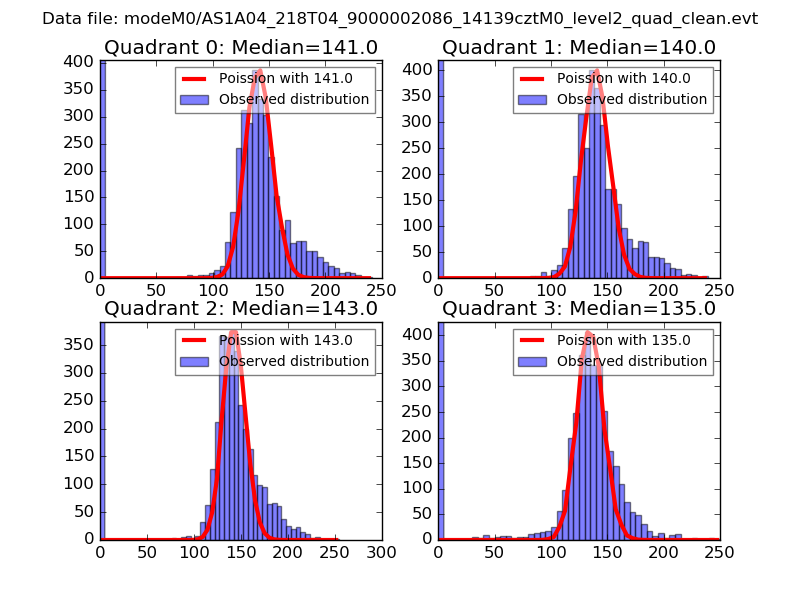
| Comparison with Poisson distribution Blue bars denote a histogram of data divided into 1 sec bins. Red curve is a Poisson curve with rate = median count rate of data. |
 |
 |
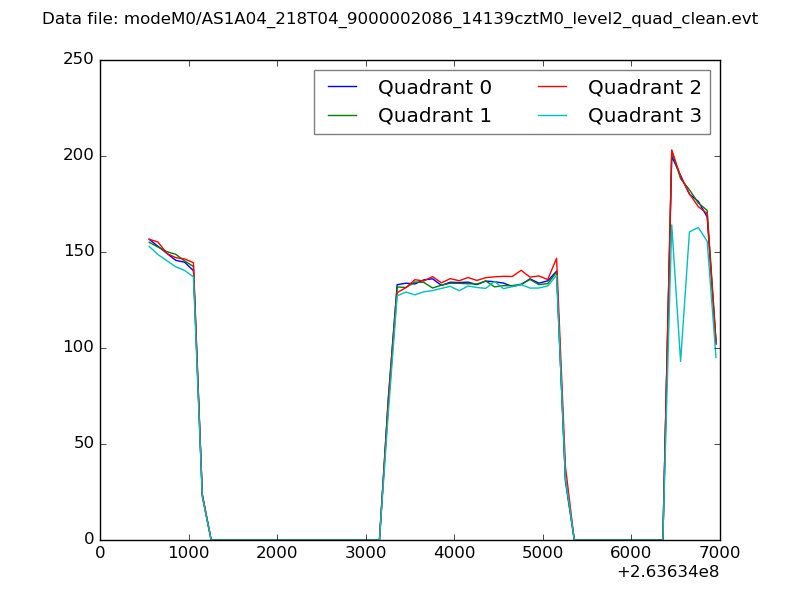
| Quadrant-wise count rates Data is divided into 100 sec bins |
 |
|
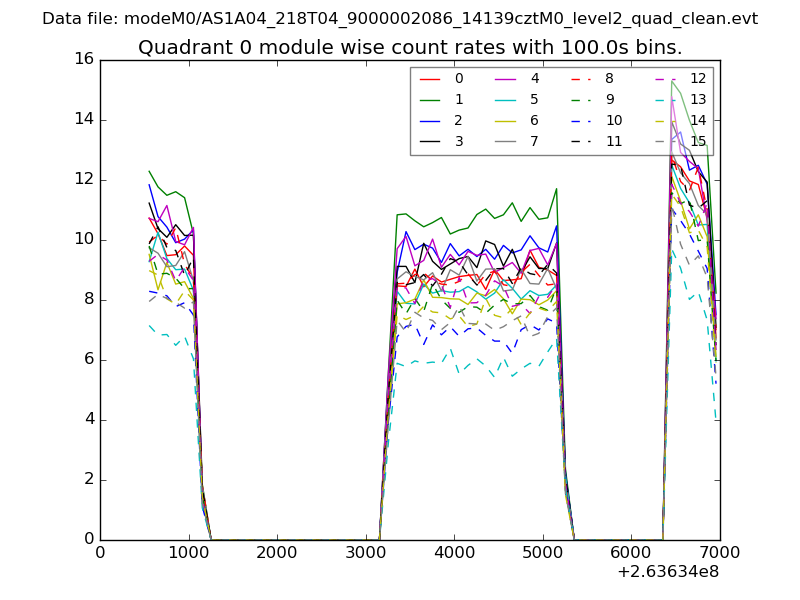
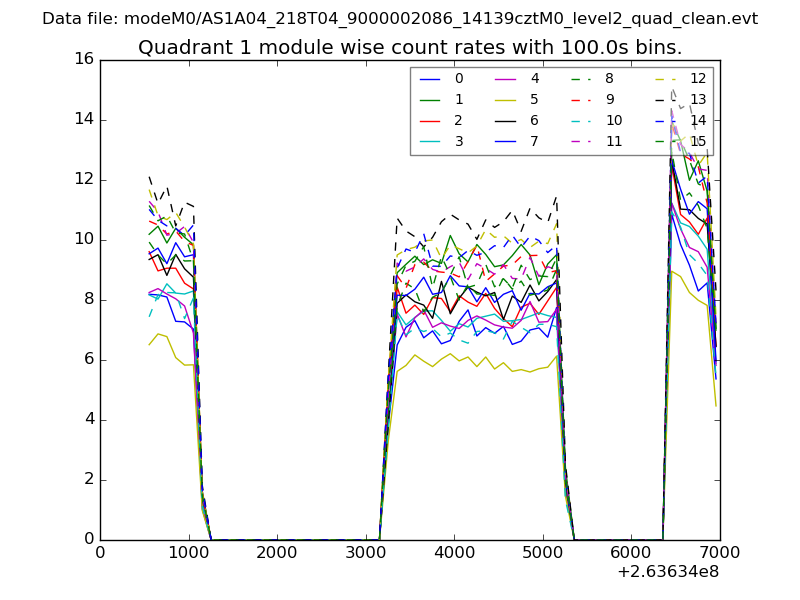
| Module-wise count rates for Quadrant A Data is divided into 100 sec bins |
 |
 |
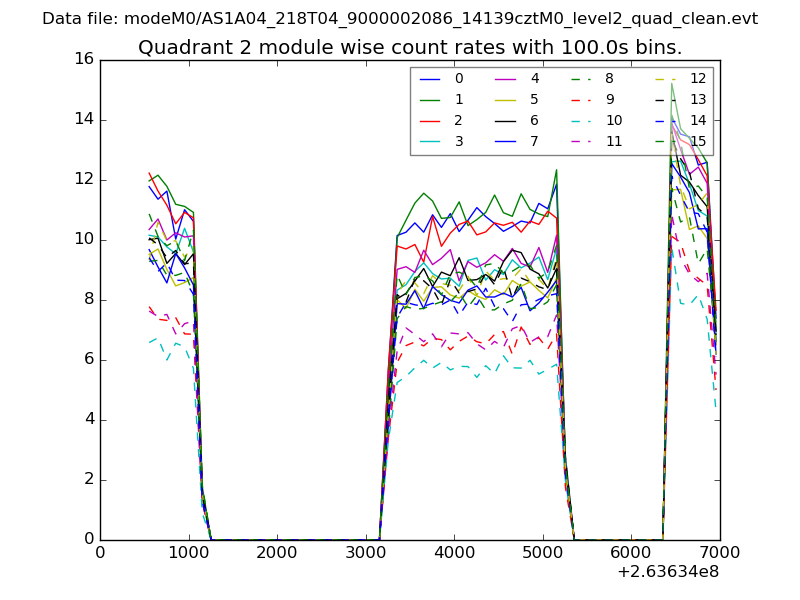
| Module-wise count rates for Quadrant B Data is divided into 100 sec bins |
 |
 |
| Module-wise count rates for Quadrant C Data is divided into 100 sec bins |
 |
 |
| Module-wise count rates for Quadrant D Data is divided into 100 sec bins |
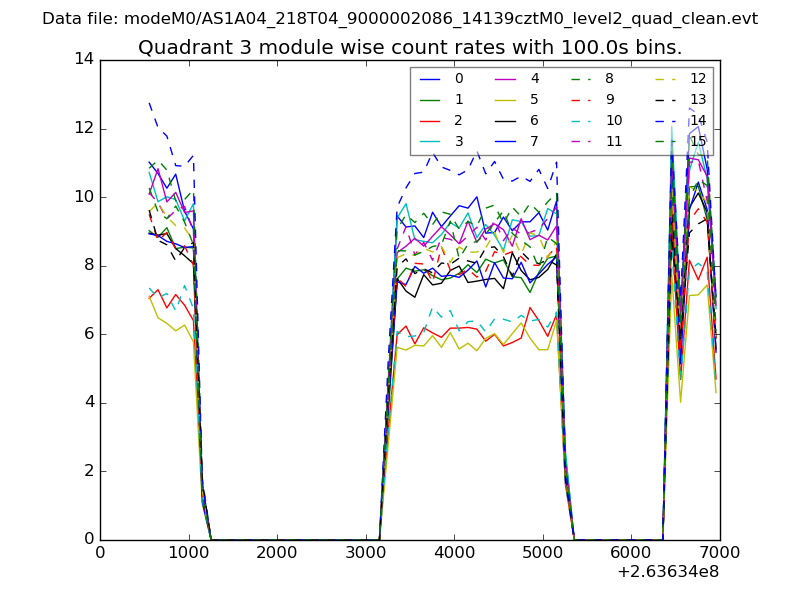 |
 |
| Parameter | Plot |
|---|---|
| CZT HV Monitor | 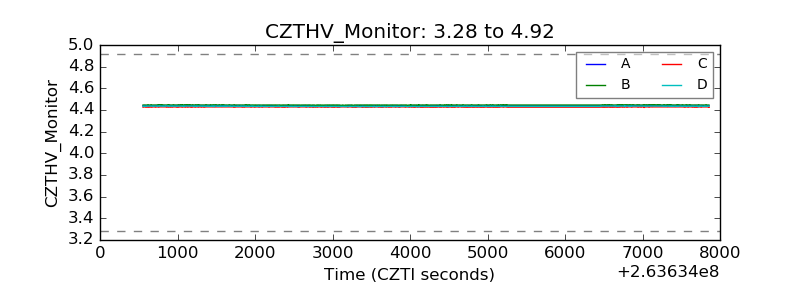 |
| D_VDD | 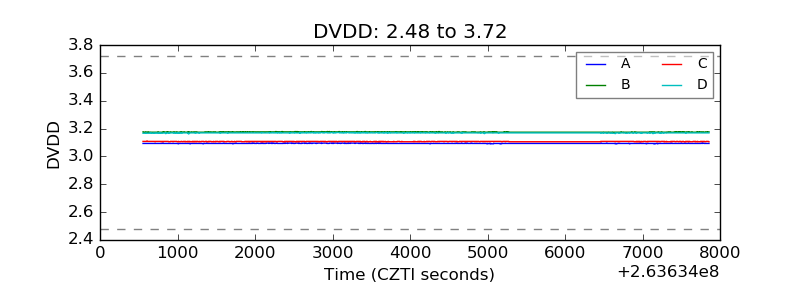 |
| Temperature 1 | 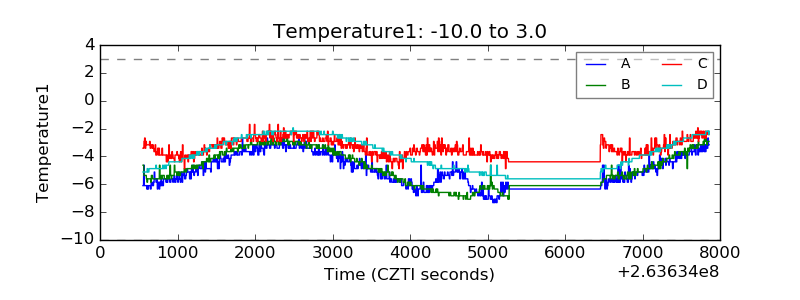 |
| Veto HV Monitor | 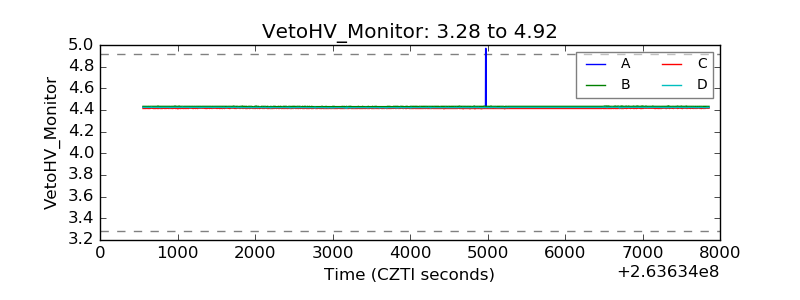 |
| Veto LLD |  |
| Alpha Counter | 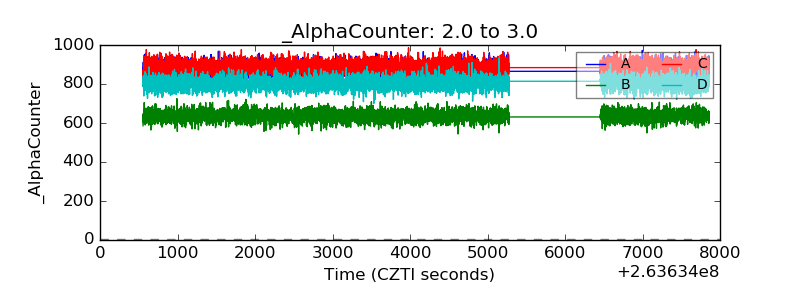 |
| _CPM_Rate | 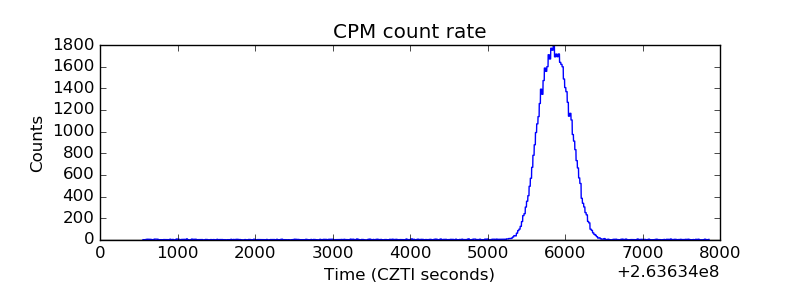 |
| CZT Counter | 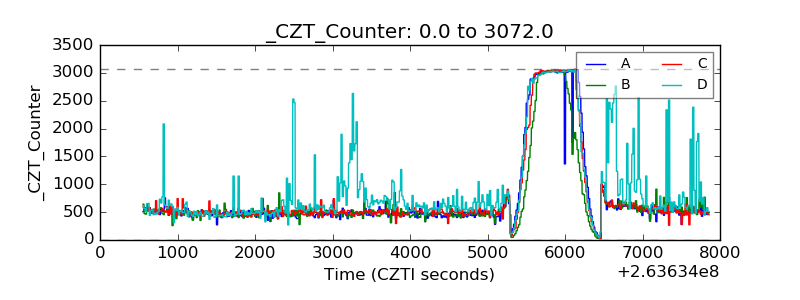 |
| +2.5 Volts monitor |  |
| +5 Volts monitor | 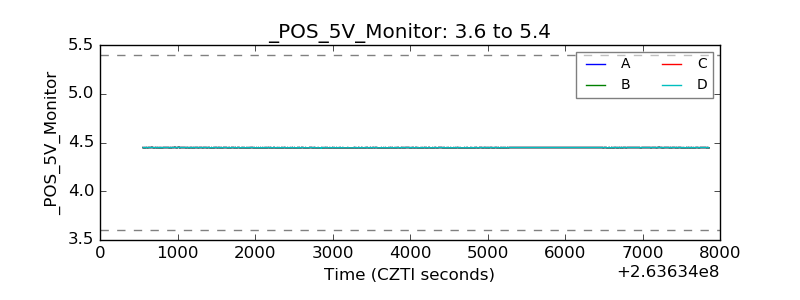 |
| _ROLL_ROT | 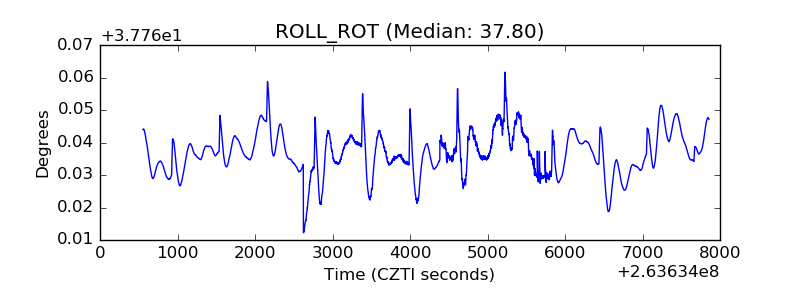 |
| _Roll_DEC | 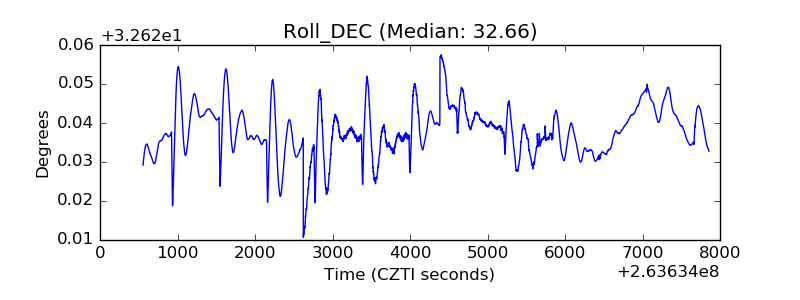 |
| _Roll_RA | 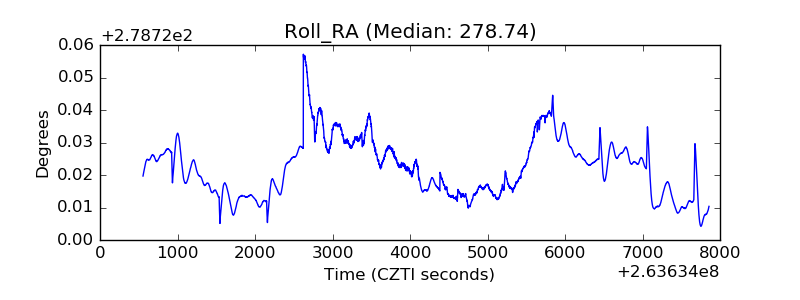 |
| Veto Counter | 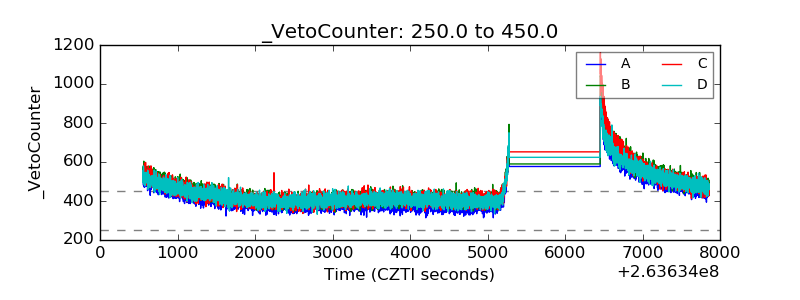 |