| Param | Original file | Final file |
|---|---|---|
| Filename | modeM0/AS1A04_218T04_9000002086_14140cztM0_level2.evt | modeM0/AS1A04_218T04_9000002086_14140cztM0_level2_quad_clean.evt |
| Size (bytes) | 583,395,840 | 73,506,240 |
| Size | 556.4 MB | 70.1 MB |
| Events in quadrant A | 3,513,482 | 454,830 |
| Events in quadrant B | 3,541,537 | 456,009 |
| Events in quadrant C | 3,611,581 | 462,503 |
| Events in quadrant D | 6,564,651 | 401,984 |
| Mode M0 | |||
|---|---|---|---|
| Quadrant | BADHDUFLAG | Total packets | Discarded packets |
| A | 0 | 14303 | 3 |
| B | 0 | 14490 | 2 |
| C | 0 | 14389 | 2 |
| D | 0 | 24060 | 2 |
| Mode SS | |||
|---|---|---|---|
| Quadrant | BADHDUFLAG | Total packets | Discarded packets |
| A | 0 | 130 | 0 |
| B | 0 | 130 | 0 |
| C | 0 | 130 | 0 |
| D | 0 | 130 | 0 |
| Mode M9 | |||
|---|---|---|---|
| Quadrant | BADHDUFLAG | Total packets | Discarded packets |
| A | 0 | 16 | 0 |
| B | 0 | 16 | 0 |
| C | 0 | 16 | 0 |
| D | 0 | 17 | 0 |
| Quadrant | Total seconds | Saturated seconds | Saturation percentage |
|---|---|---|---|
| A | 6455 | 139 | 2.153369% |
| B | 6455 | 128 | 1.982959% |
| C | 6455 | 79 | 1.223857% |
| D | 6455 | 864 | 13.384973% |
Noise dominated data is calculated using 1-second bins in cleaned event files. If a bin has >2000 counts, and if more than 50% of those come from <1% of pixels, then it is considered to be noise-dominated and hence unusable.
| Quadrant | # 1 sec bins | Bins with >0 counts | Bins with >2000 counts | High rate bins dominated by noise | Noise dominated (total time) | Noise dominated (detector-on time) | Marked lightcurve |
|---|---|---|---|---|---|---|---|
| A | 7681 | 6457 | 26 | 26 | 0.34% | 0.40% | 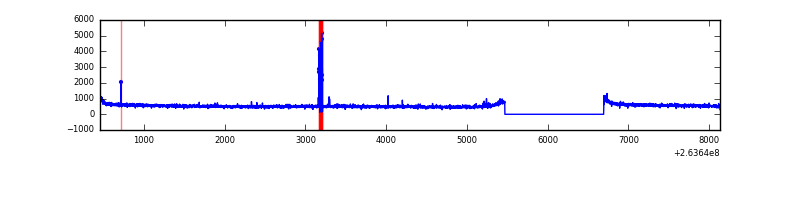 |
| B | 7681 | 6457 | 0 | 0 | 0.00% | 0.00% | 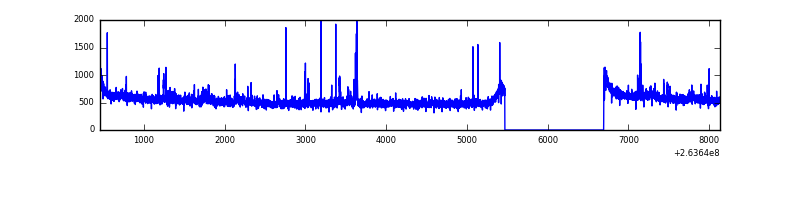 |
| C | 7681 | 6457 | 2 | 2 | 0.03% | 0.03% | 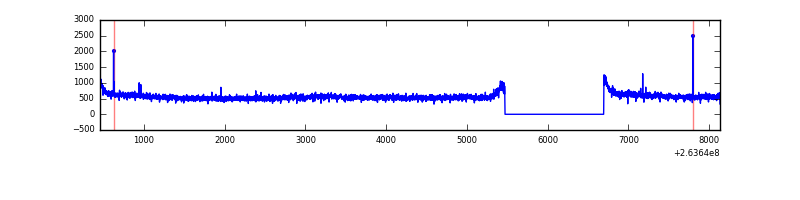 |
| D | 7681 | 6457 | 688 | 688 | 8.96% | 10.66% | 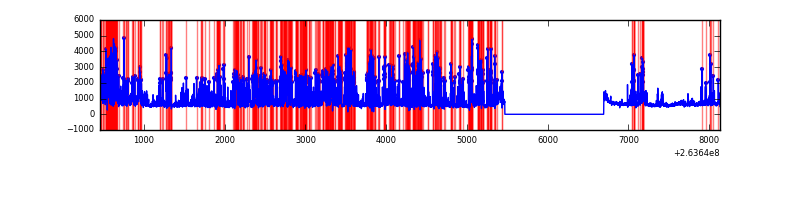 |
Top three noisy pixels from each quadrant. If the there are fewer than three noisy pixels in the level2.evt file, extra rows are filled as -1
| Pixel properties | Quadrant properties | ||||||
|---|---|---|---|---|---|---|---|
| Quadrant | DetID | PixID | Counts | Sigma | Mean | Median | Sigma |
| A | 11 | 29 | 83405 | 474.05 | 878 | 862 | 174.1 |
| A | 12 | 189 | 30688 | 171.29 | 878 | 862 | 174.1 |
| A | 9 | 143 | 10919 | 57.76 | 878 | 862 | 174.1 |
| B | 0 | 214 | 51554 | 310.81 | 867 | 848 | 163.1 |
| B | 0 | 189 | 35770 | 214.06 | 867 | 848 | 163.1 |
| B | 3 | 209 | 21878 | 128.91 | 867 | 848 | 163.1 |
| C | 3 | 233 | 309862 | 1591.18 | 844 | 851 | 194.2 |
| C | 14 | 234 | 11080 | 52.67 | 844 | 851 | 194.2 |
| C | 13 | 61 | 6164 | 27.36 | 844 | 851 | 194.2 |
| D | 7 | 80 | 3122020 | 16503.92 | 809 | 794 | 189.1 |
| D | 8 | 195 | 125238 | 658.02 | 809 | 794 | 189.1 |
| D | 1 | 52 | 60202 | 314.13 | 809 | 794 | 189.1 |
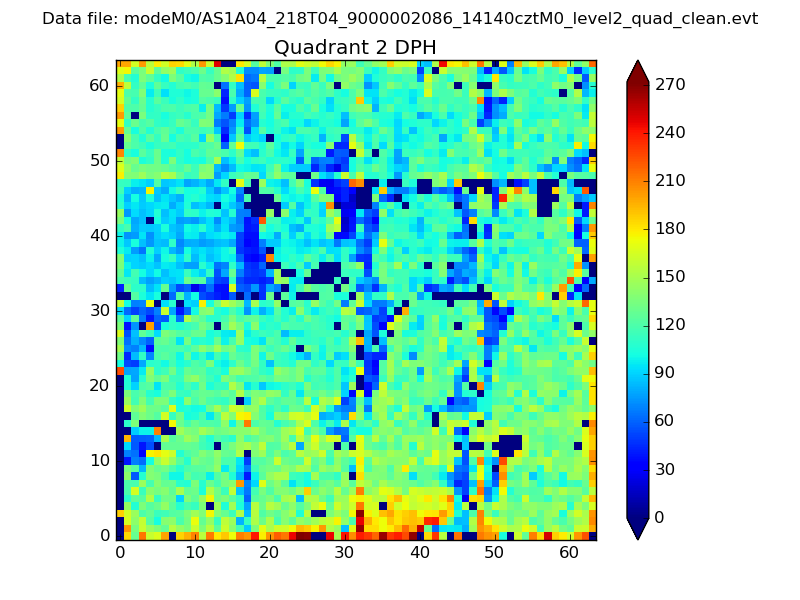
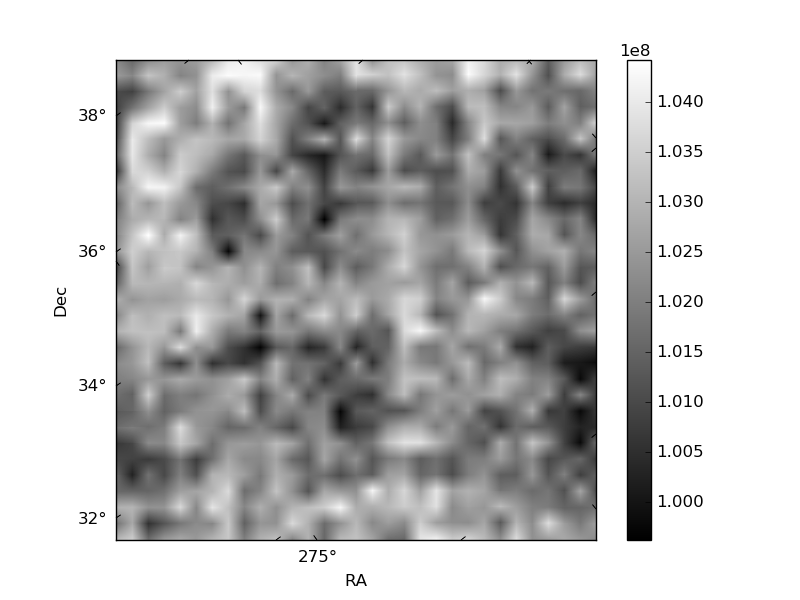
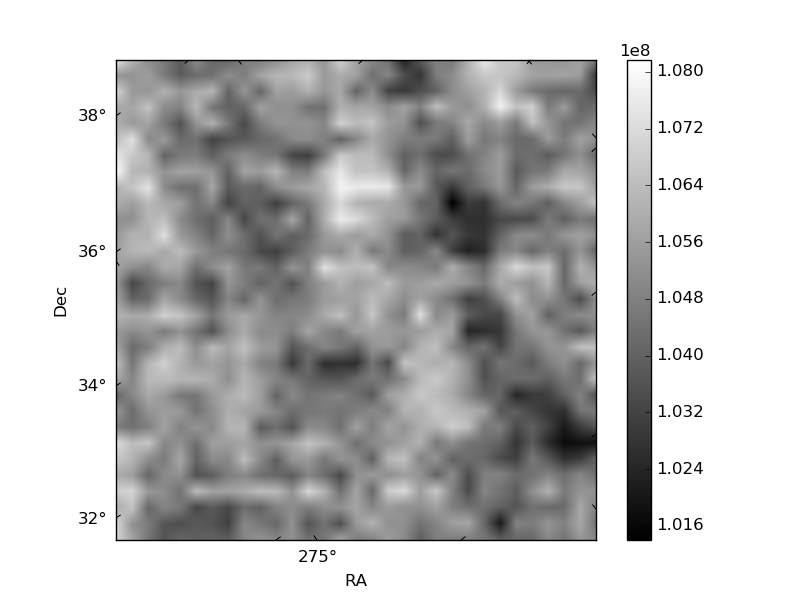
Histogram calculated using DETX and DETY for each event in the final _common_clean file
| Quadrant A | 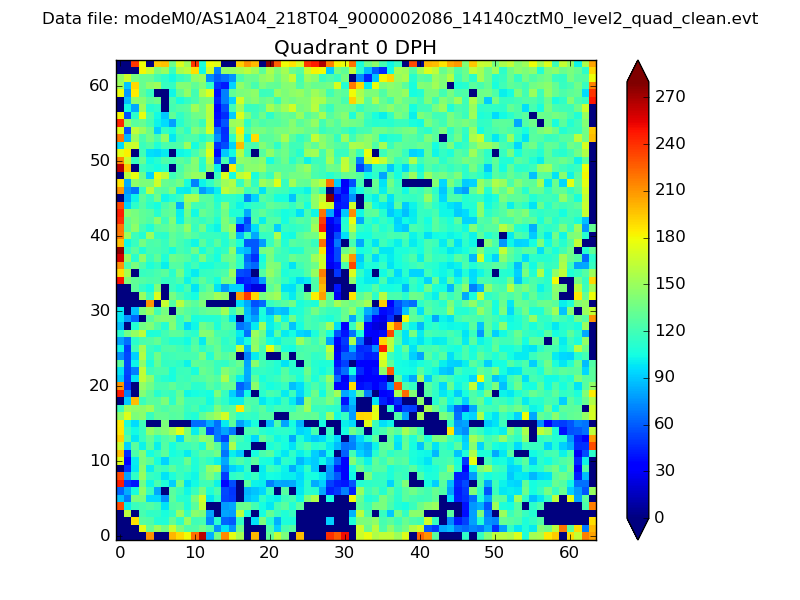 |
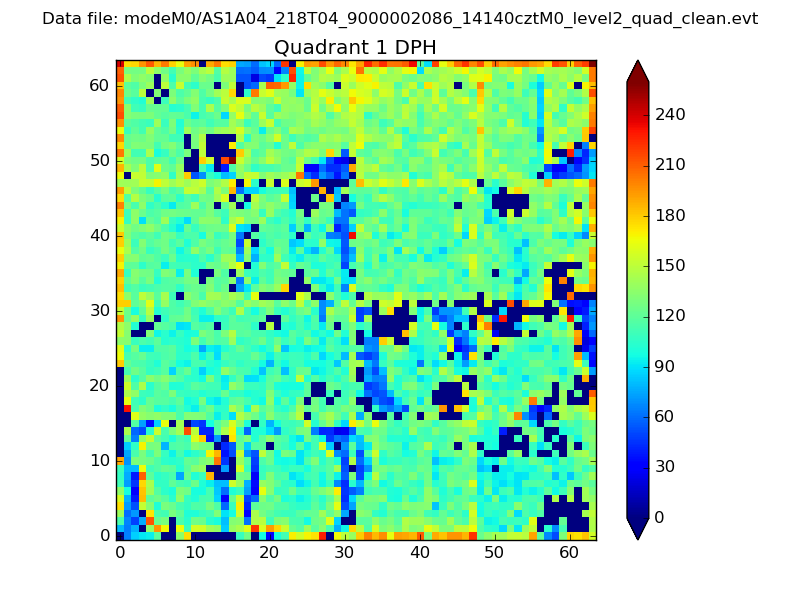 |
Quadrant B |
|---|---|---|---|
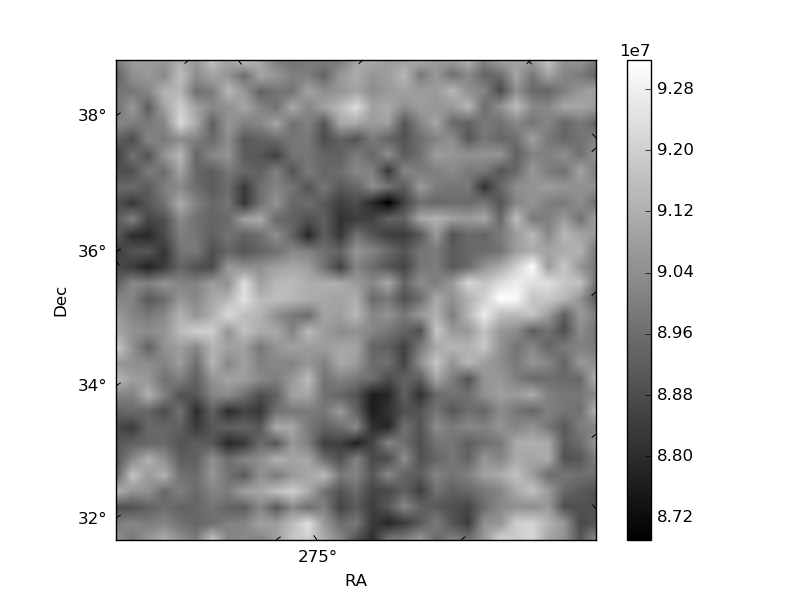
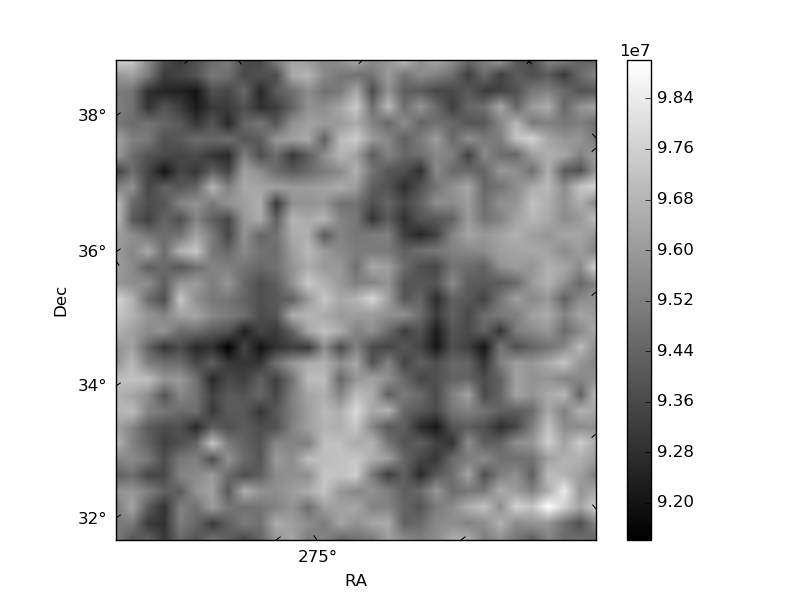
| Quadrant D | 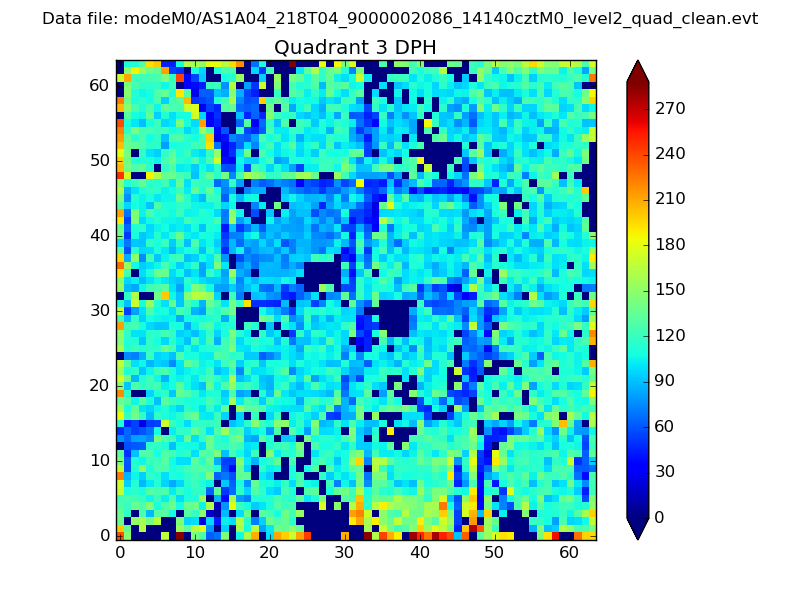 |
 |
Quadrant C |
| Plot type | Count rate plots | Images |
|---|---|---|
| Comparison with Poisson distribution Blue bars denote a histogram of data divided into 1 sec bins. Red curve is a Poisson curve with rate = median count rate of data. |
 |
 |
| Quadrant-wise count rates Data is divided into 100 sec bins |
 |
|
| Module-wise count rates for Quadrant A Data is divided into 100 sec bins |
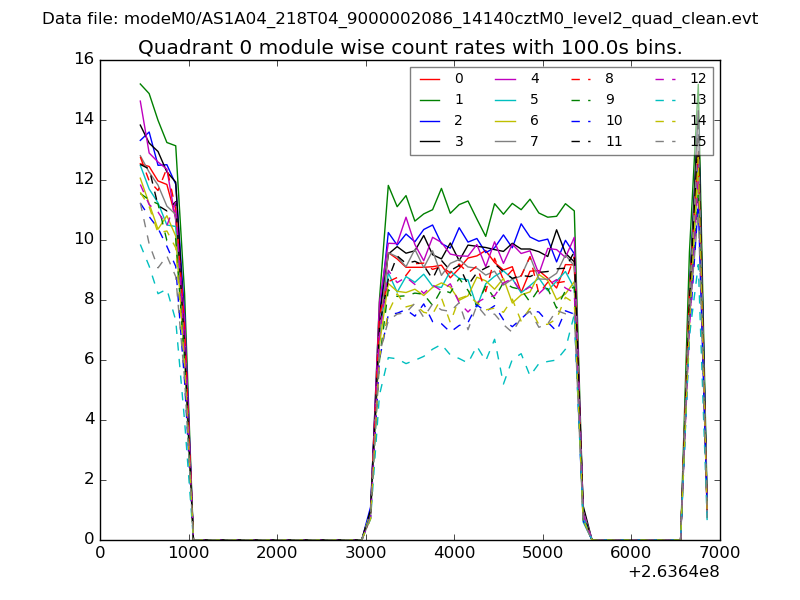 |
 |
| Module-wise count rates for Quadrant B Data is divided into 100 sec bins |
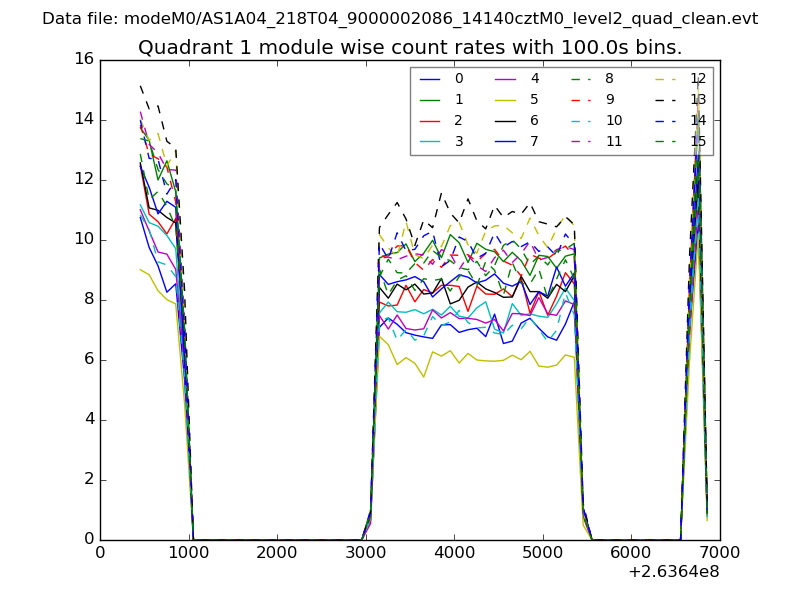 |
 |
| Module-wise count rates for Quadrant C Data is divided into 100 sec bins |
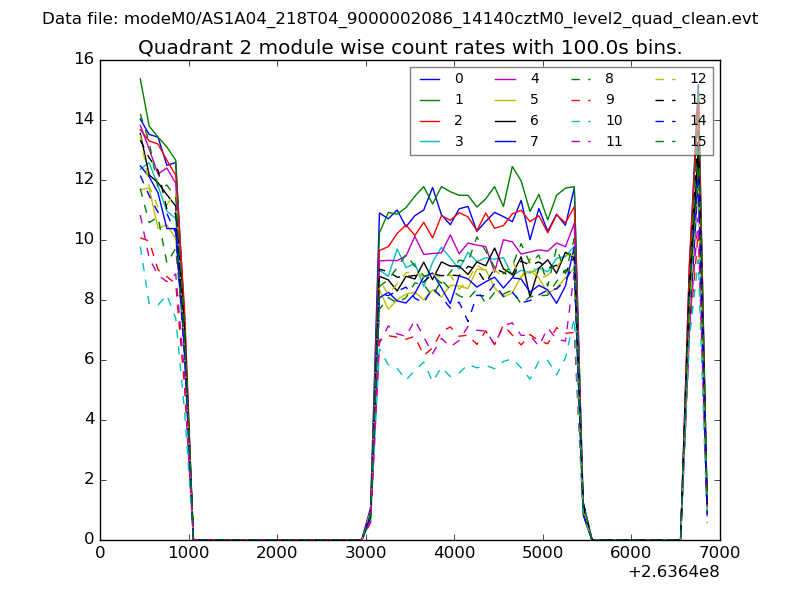 |
 |
| Module-wise count rates for Quadrant D Data is divided into 100 sec bins |
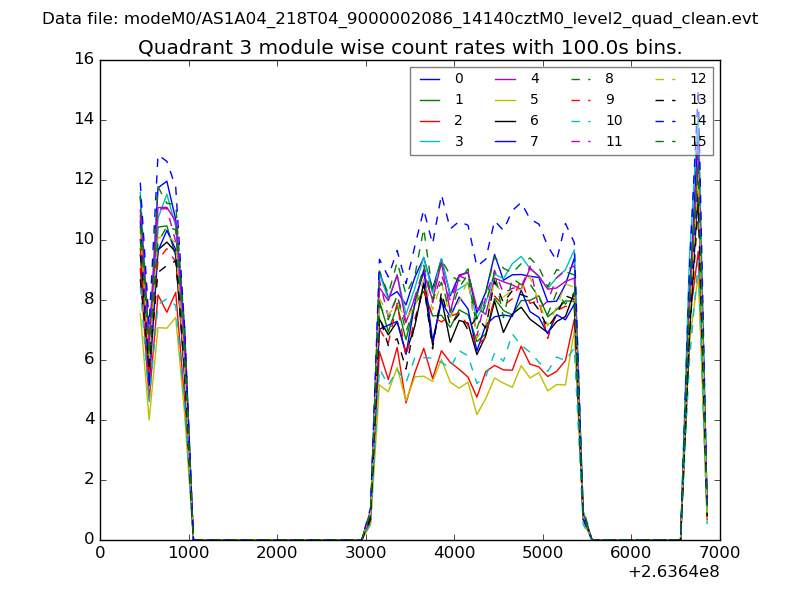 |
 |
| Parameter | Plot |
|---|---|
| CZT HV Monitor | 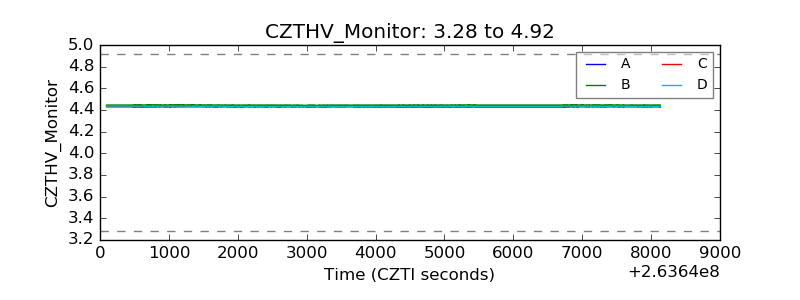 |
| D_VDD | 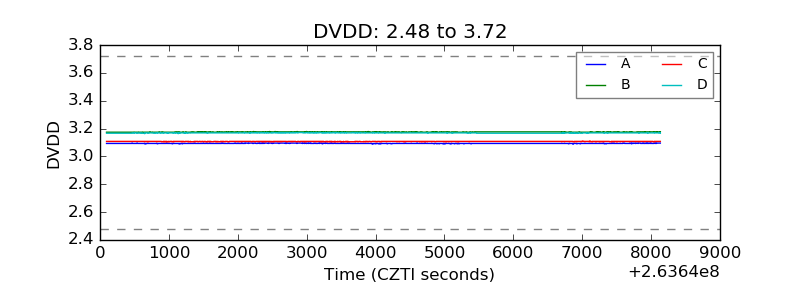 |
| Temperature 1 | 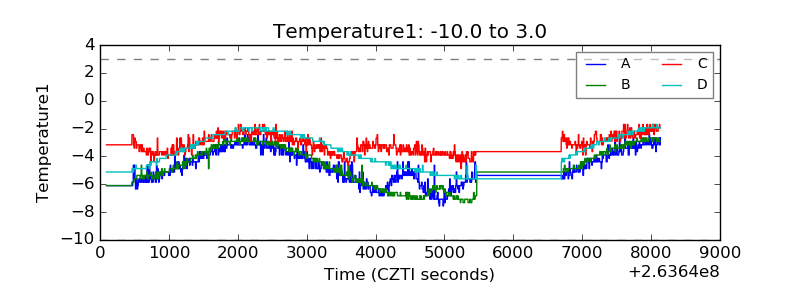 |
| Veto HV Monitor | 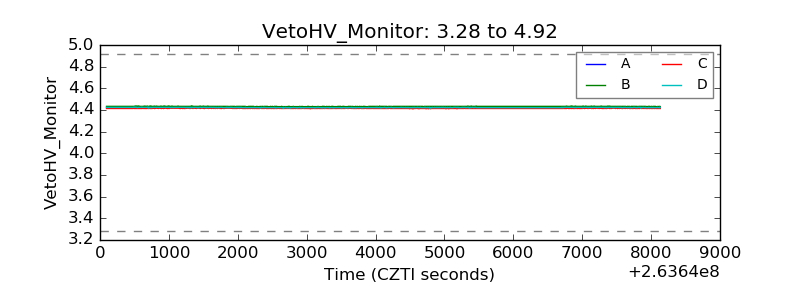 |
| Veto LLD | 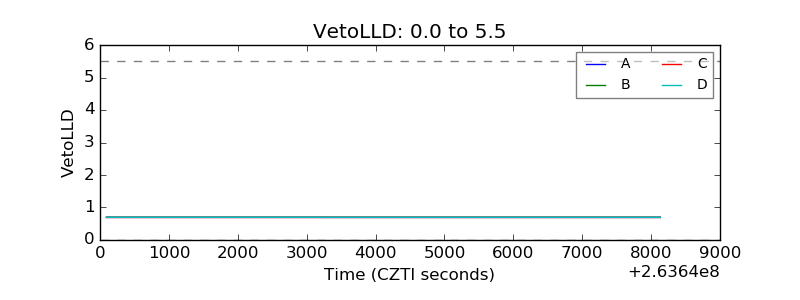 |
| Alpha Counter |  |
| _CPM_Rate | 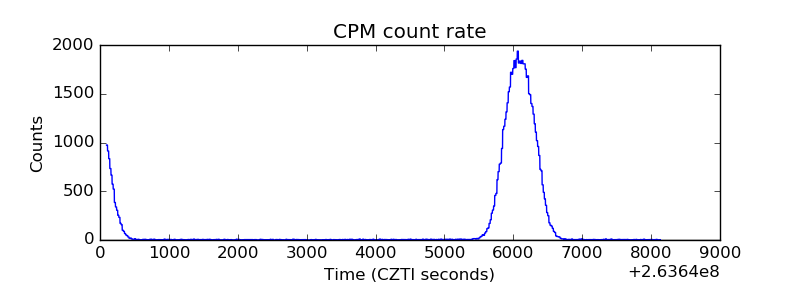 |
| CZT Counter | 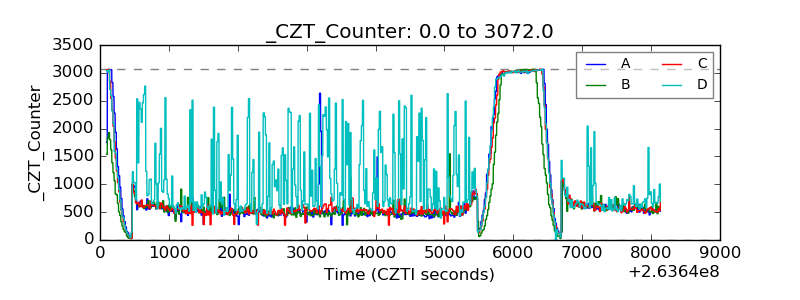 |
| +2.5 Volts monitor |  |
| +5 Volts monitor |  |
| _ROLL_ROT | 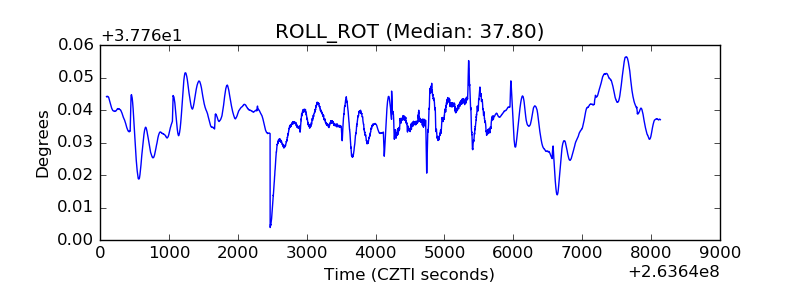 |
| _Roll_DEC | 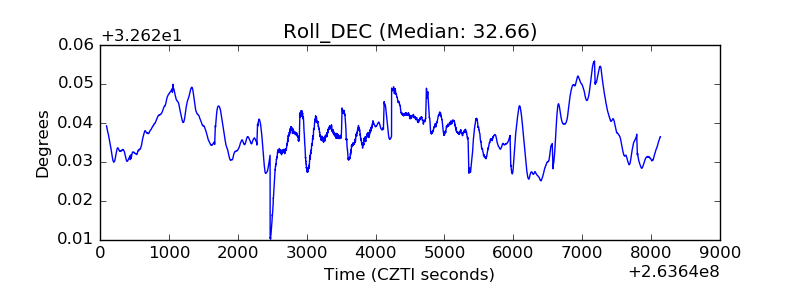 |
| _Roll_RA |  |
| Veto Counter | 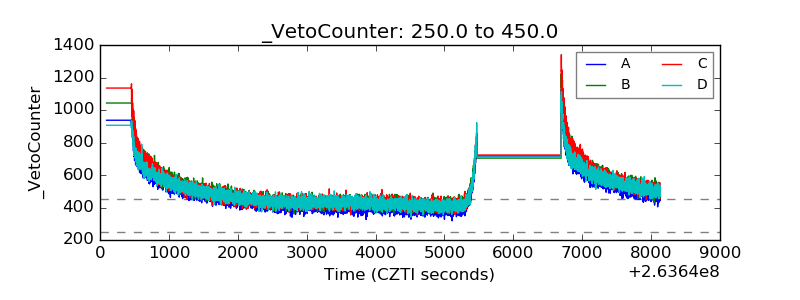 |