| Param | Original file | Final file |
|---|---|---|
| Filename | modeM0/AS1A04_218T04_9000002086_14141cztM0_level2.evt | modeM0/AS1A04_218T04_9000002086_14141cztM0_level2_quad_clean.evt |
| Size (bytes) | 524,007,360 | 69,713,280 |
| Size | 499.7 MB | 66.5 MB |
| Events in quadrant A | 3,495,765 | 417,084 |
| Events in quadrant B | 3,614,492 | 414,101 |
| Events in quadrant C | 3,707,893 | 420,797 |
| Events in quadrant D | 4,609,842 | 404,532 |
| Mode M0 | |||
|---|---|---|---|
| Quadrant | BADHDUFLAG | Total packets | Discarded packets |
| A | 0 | 14317 | 3 |
| B | 0 | 14730 | 2 |
| C | 0 | 14755 | 2 |
| D | 0 | 18749 | 2 |
| Mode SS | |||
|---|---|---|---|
| Quadrant | BADHDUFLAG | Total packets | Discarded packets |
| A | 0 | 132 | 0 |
| B | 0 | 132 | 0 |
| C | 0 | 132 | 0 |
| D | 0 | 132 | 0 |
| Mode M9 | |||
|---|---|---|---|
| Quadrant | BADHDUFLAG | Total packets | Discarded packets |
| A | 0 | 17 | 0 |
| B | 0 | 17 | 0 |
| C | 0 | 17 | 0 |
| D | 0 | 18 | 0 |
| Quadrant | Total seconds | Saturated seconds | Saturation percentage |
|---|---|---|---|
| A | 6514 | 123 | 1.888241% |
| B | 6514 | 142 | 2.179920% |
| C | 6514 | 101 | 1.550507% |
| D | 6514 | 175 | 2.686521% |
Noise dominated data is calculated using 1-second bins in cleaned event files. If a bin has >2000 counts, and if more than 50% of those come from <1% of pixels, then it is considered to be noise-dominated and hence unusable.
| Quadrant | # 1 sec bins | Bins with >0 counts | Bins with >2000 counts | High rate bins dominated by noise | Noise dominated (total time) | Noise dominated (detector-on time) | Marked lightcurve |
|---|---|---|---|---|---|---|---|
| A | 7800 | 6516 | 0 | 0 | 0.00% | 0.00% | 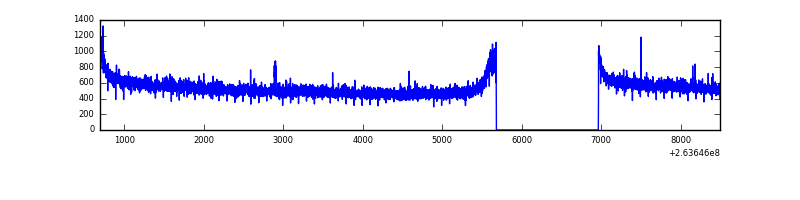 |
| B | 7800 | 6516 | 0 | 0 | 0.00% | 0.00% | 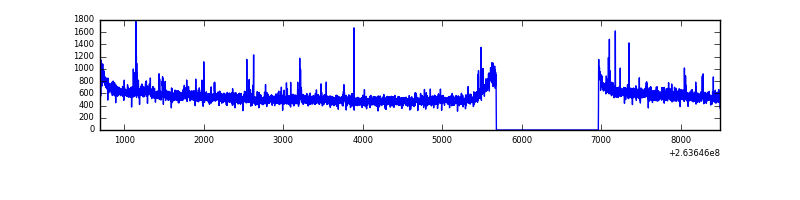 |
| C | 7800 | 6516 | 2 | 2 | 0.03% | 0.03% |  |
| D | 7800 | 6516 | 52 | 52 | 0.67% | 0.80% | 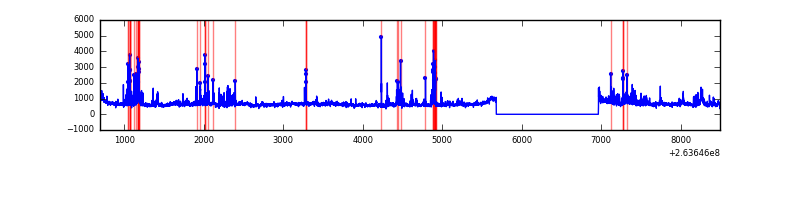 |
Top three noisy pixels from each quadrant. If the there are fewer than three noisy pixels in the level2.evt file, extra rows are filled as -1
| Pixel properties | Quadrant properties | ||||||
|---|---|---|---|---|---|---|---|
| Quadrant | DetID | PixID | Counts | Sigma | Mean | Median | Sigma |
| A | 2 | 79 | 9720 | 48.72 | 904 | 887 | 181.3 |
| A | 0 | 226 | 8045 | 39.48 | 904 | 887 | 181.3 |
| A | 8 | 15 | 7542 | 36.71 | 904 | 887 | 181.3 |
| B | 0 | 189 | 43499 | 254.11 | 891 | 870 | 167.8 |
| B | 3 | 209 | 33286 | 193.23 | 891 | 870 | 167.8 |
| B | 0 | 214 | 29397 | 170.05 | 891 | 870 | 167.8 |
| C | 3 | 233 | 302691 | 1520.96 | 871 | 879 | 198.4 |
| C | 13 | 61 | 6363 | 27.64 | 871 | 879 | 198.4 |
| C | 14 | 234 | 5694 | 24.26 | 871 | 879 | 198.4 |
| D | 8 | 195 | 618931 | 3036.49 | 870 | 851 | 203.6 |
| D | 7 | 80 | 337605 | 1654.4 | 870 | 851 | 203.6 |
| D | 2 | 152 | 164440 | 803.68 | 870 | 851 | 203.6 |
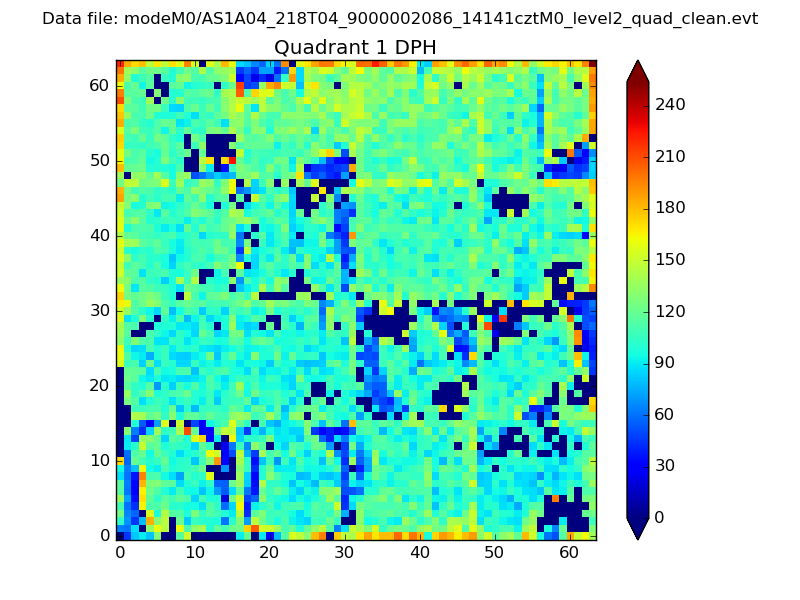
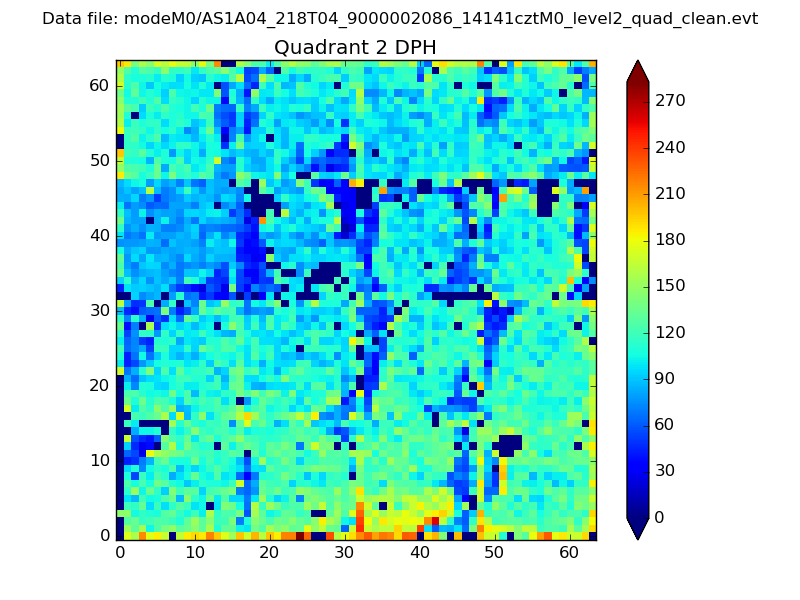
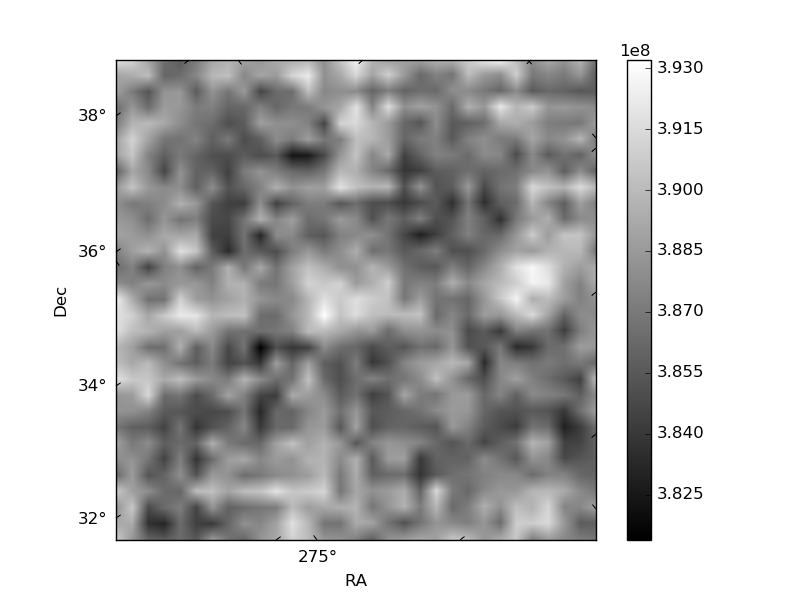
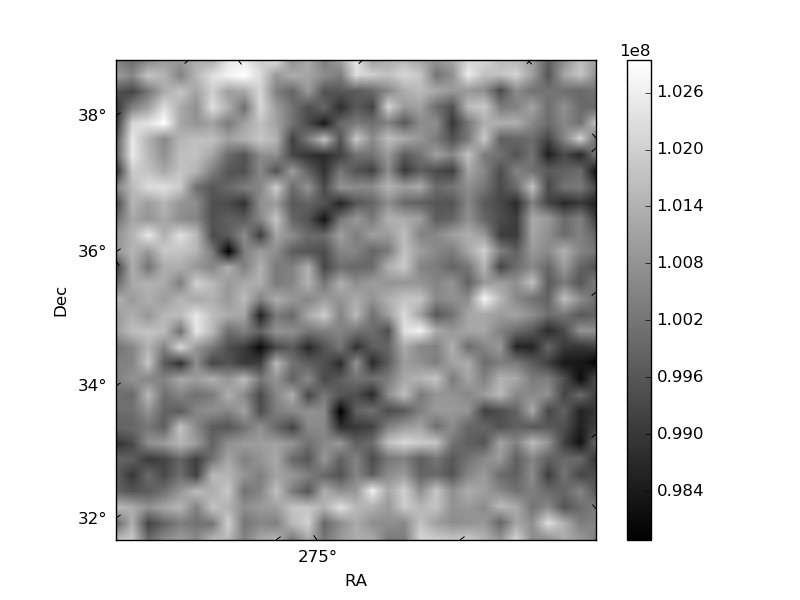
Histogram calculated using DETX and DETY for each event in the final _common_clean file
| Quadrant A | 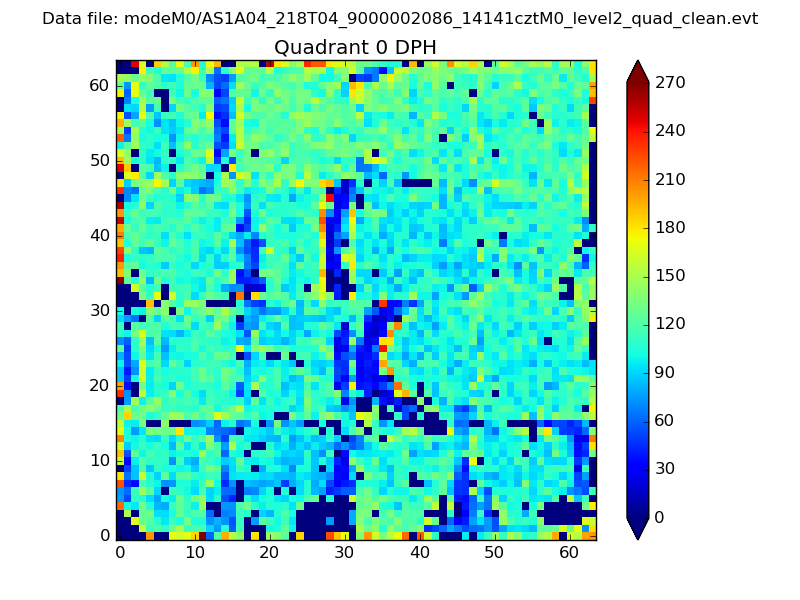 |
 |
Quadrant B |
|---|---|---|---|
| Quadrant D | 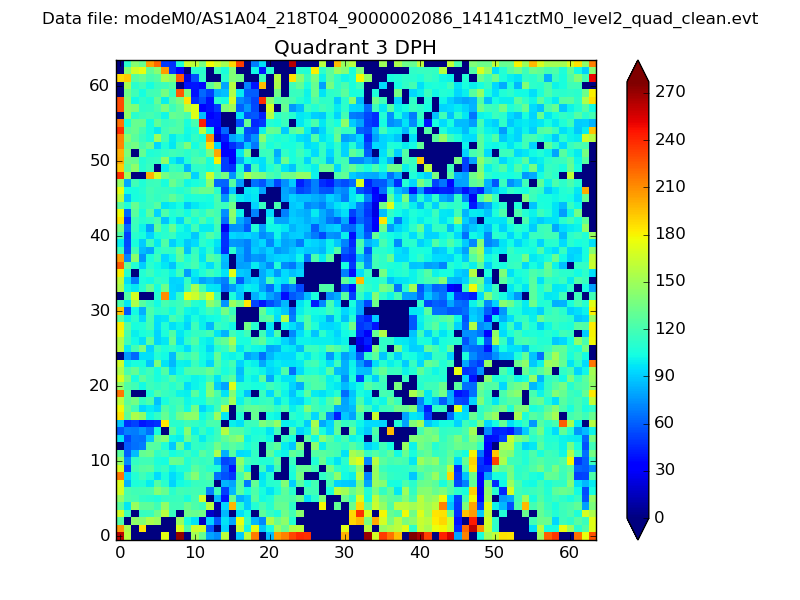 |
 |
Quadrant C |
| Plot type | Count rate plots | Images |
|---|---|---|
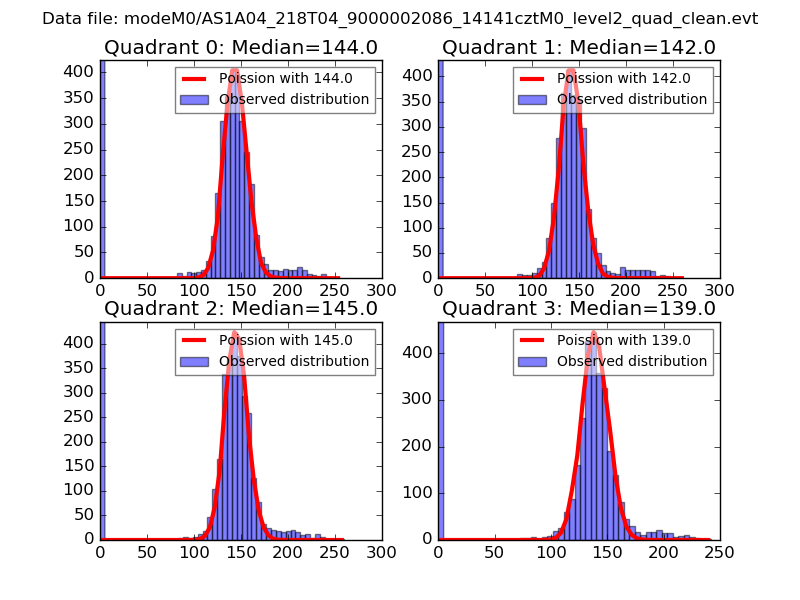
| Comparison with Poisson distribution Blue bars denote a histogram of data divided into 1 sec bins. Red curve is a Poisson curve with rate = median count rate of data. |
 |
 |
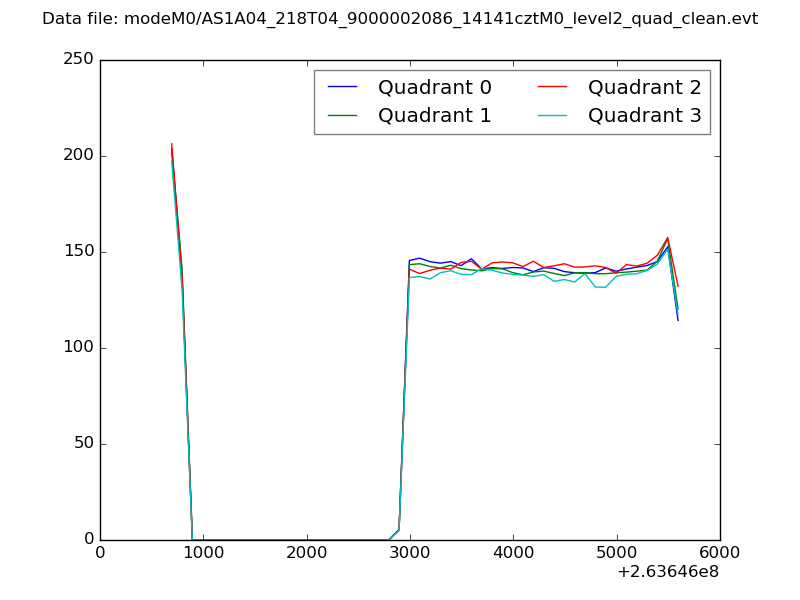
| Quadrant-wise count rates Data is divided into 100 sec bins |
 |
|
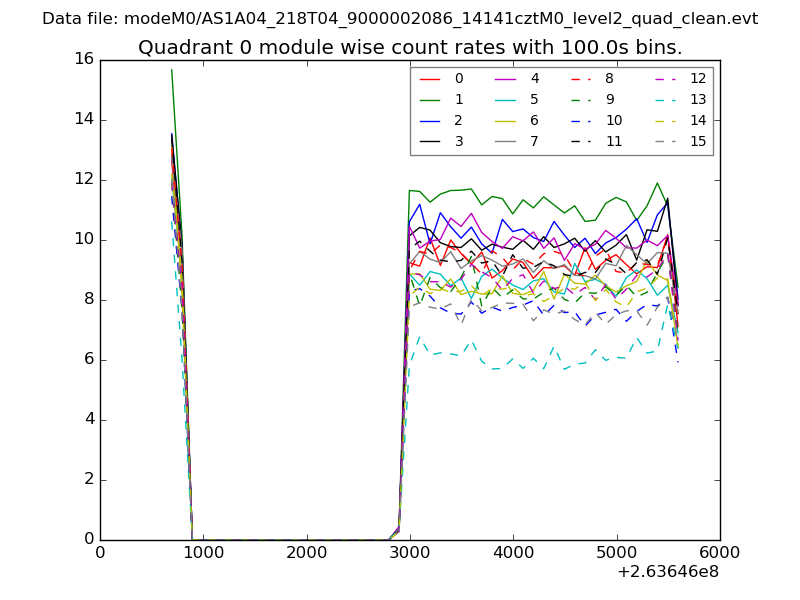
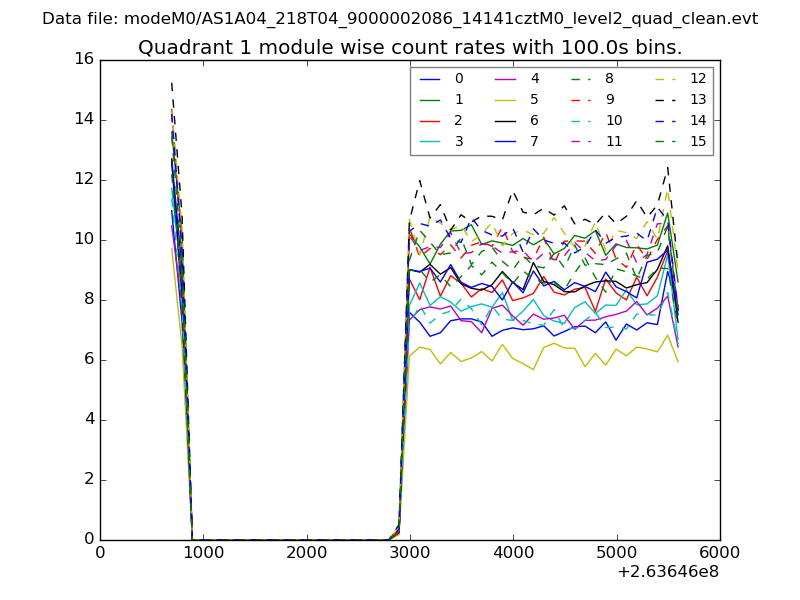
| Module-wise count rates for Quadrant A Data is divided into 100 sec bins |
 |
 |
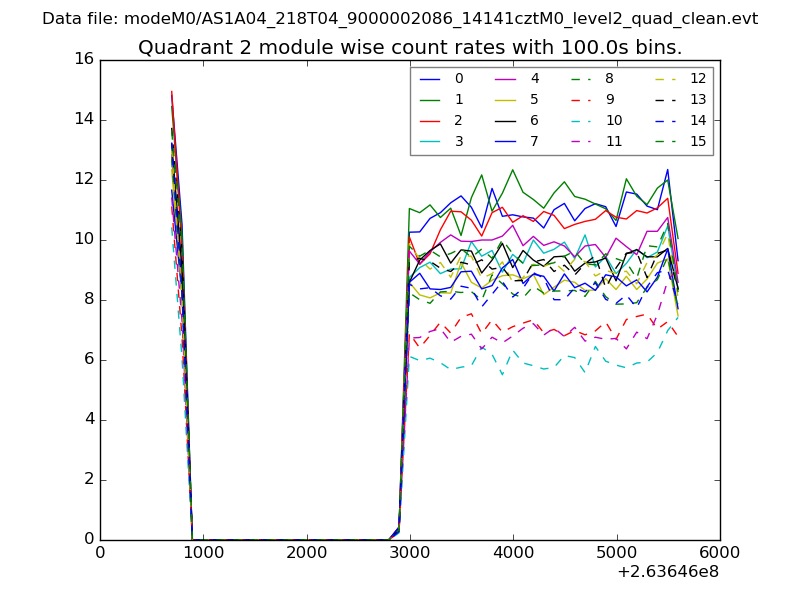
| Module-wise count rates for Quadrant B Data is divided into 100 sec bins |
 |
 |
| Module-wise count rates for Quadrant C Data is divided into 100 sec bins |
 |
 |
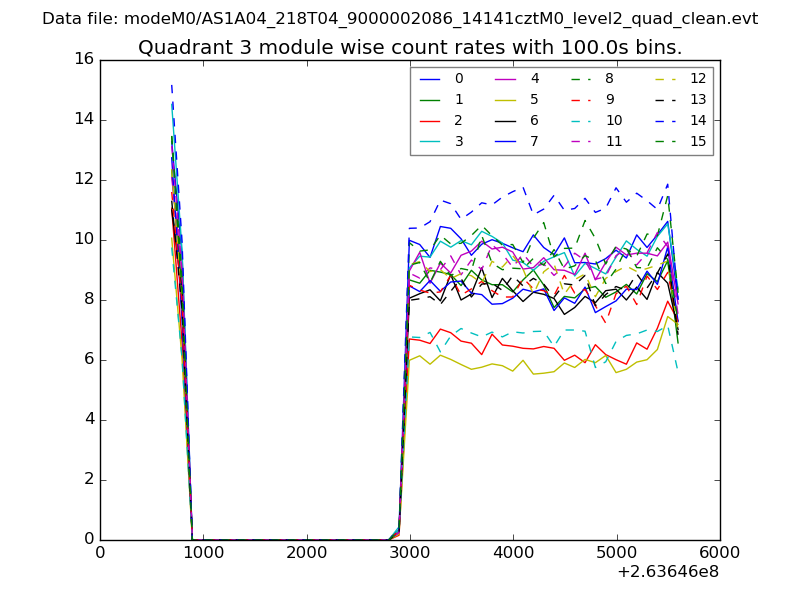
| Module-wise count rates for Quadrant D Data is divided into 100 sec bins |
 |
 |
| Parameter | Plot |
|---|---|
| CZT HV Monitor | 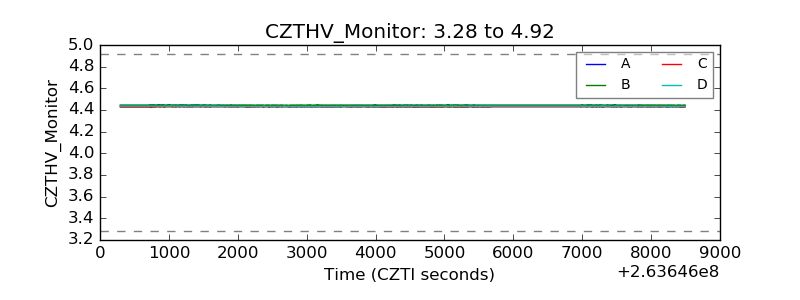 |
| D_VDD | 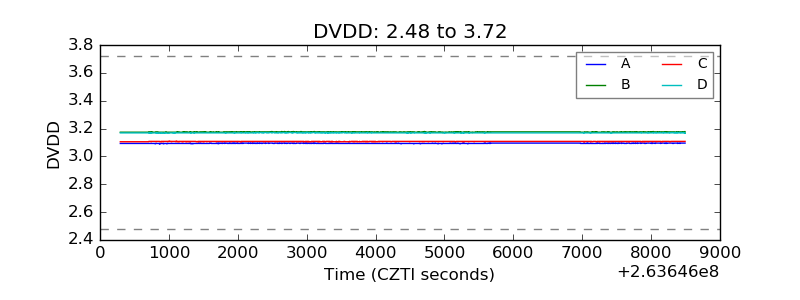 |
| Temperature 1 | 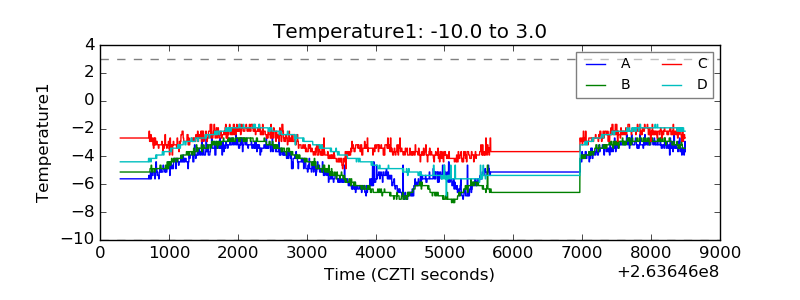 |
| Veto HV Monitor | 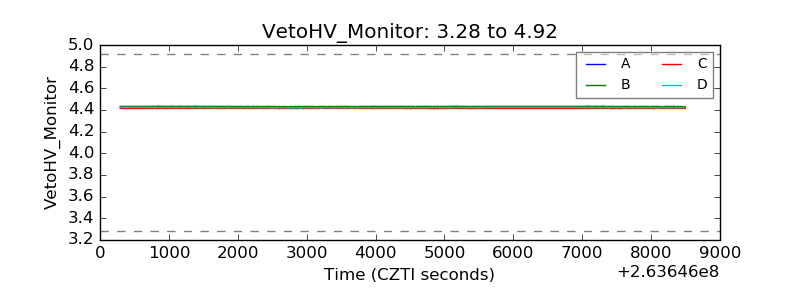 |
| Veto LLD | 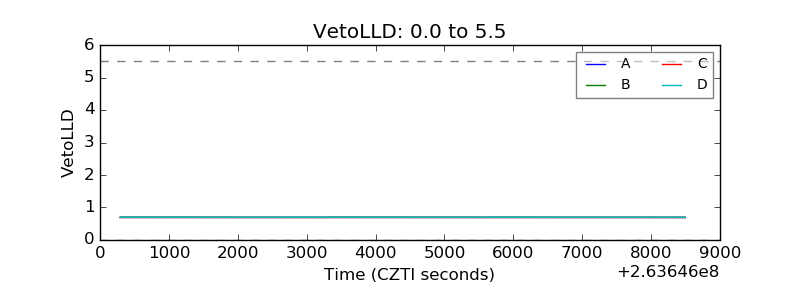 |
| Alpha Counter | 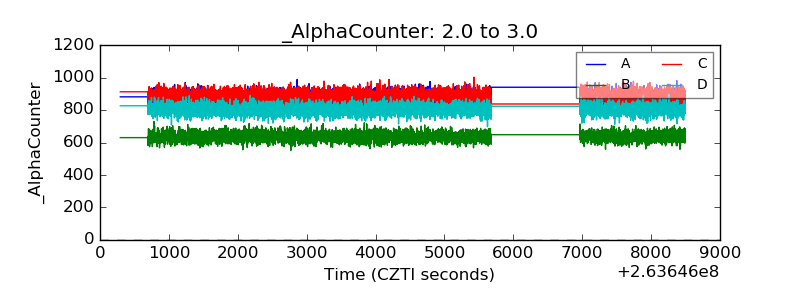 |
| _CPM_Rate | 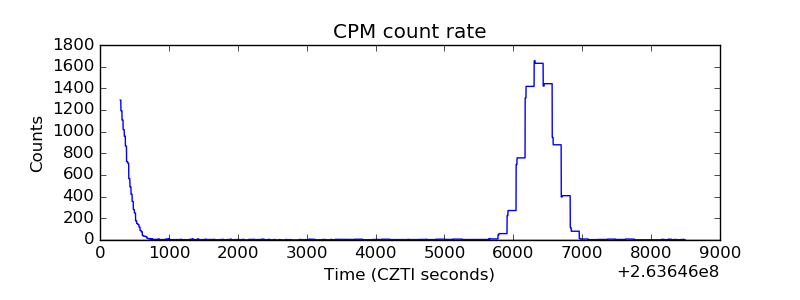 |
| CZT Counter | 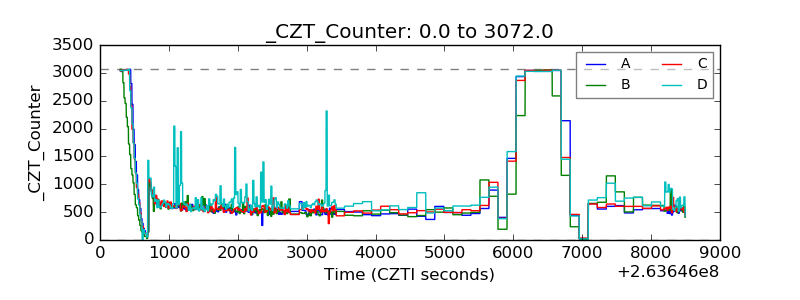 |
| +2.5 Volts monitor |  |
| +5 Volts monitor | 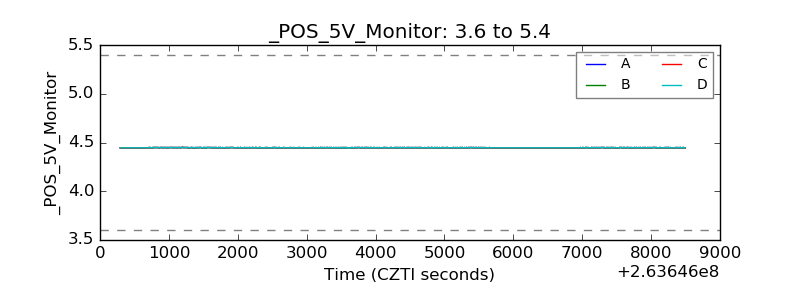 |
| _ROLL_ROT | 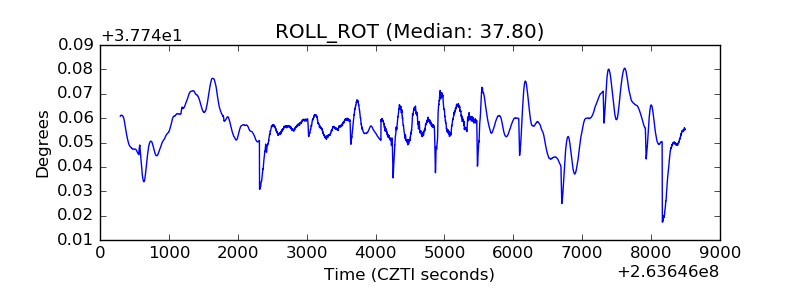 |
| _Roll_DEC | 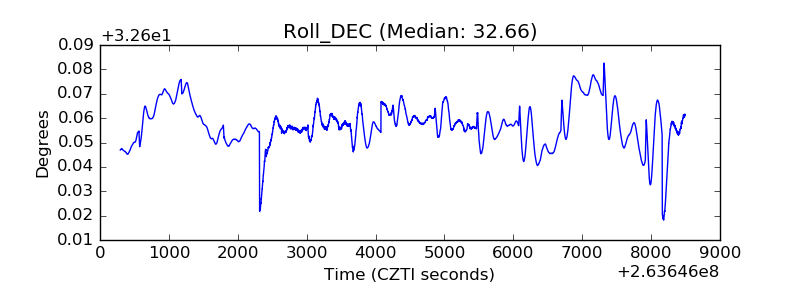 |
| _Roll_RA | 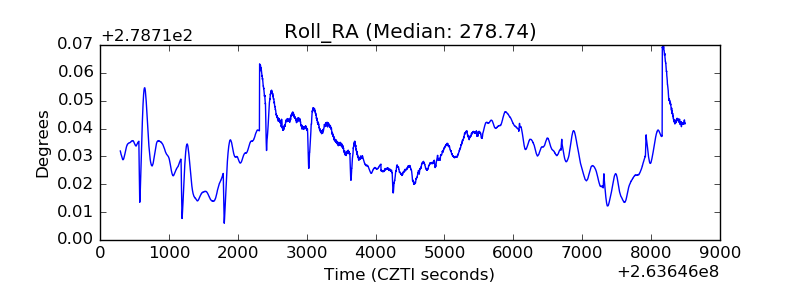 |
| Veto Counter |  |