| Param | Original file | Final file |
|---|---|---|
| Filename | modeM0/AS1A04_218T04_9000002086_14142cztM0_level2.evt | modeM0/AS1A04_218T04_9000002086_14142cztM0_level2_quad_clean.evt |
| Size (bytes) | 494,357,760 | 72,993,600 |
| Size | 471.5 MB | 69.6 MB |
| Events in quadrant A | 3,371,198 | 443,432 |
| Events in quadrant B | 3,448,461 | 440,608 |
| Events in quadrant C | 3,576,540 | 448,735 |
| Events in quadrant D | 4,145,169 | 435,050 |
| Mode M0 | |||
|---|---|---|---|
| Quadrant | BADHDUFLAG | Total packets | Discarded packets |
| A | 0 | 13799 | 3 |
| B | 0 | 14143 | 2 |
| C | 0 | 14365 | 2 |
| D | 0 | 16876 | 2 |
| Mode SS | |||
|---|---|---|---|
| Quadrant | BADHDUFLAG | Total packets | Discarded packets |
| A | 0 | 128 | 0 |
| B | 0 | 128 | 0 |
| C | 0 | 128 | 0 |
| D | 0 | 128 | 0 |
| Mode M9 | |||
|---|---|---|---|
| Quadrant | BADHDUFLAG | Total packets | Discarded packets |
| A | 0 | 15 | 0 |
| B | 0 | 15 | 0 |
| C | 0 | 15 | 0 |
| D | 0 | 16 | 0 |
| Quadrant | Total seconds | Saturated seconds | Saturation percentage |
|---|---|---|---|
| A | 6343 | 134 | 2.112565% |
| B | 6343 | 137 | 2.159861% |
| C | 6343 | 116 | 1.828788% |
| D | 6343 | 135 | 2.128330% |
Noise dominated data is calculated using 1-second bins in cleaned event files. If a bin has >2000 counts, and if more than 50% of those come from <1% of pixels, then it is considered to be noise-dominated and hence unusable.
| Quadrant | # 1 sec bins | Bins with >0 counts | Bins with >2000 counts | High rate bins dominated by noise | Noise dominated (total time) | Noise dominated (detector-on time) | Marked lightcurve |
|---|---|---|---|---|---|---|---|
| A | 7604 | 6345 | 0 | 0 | 0.00% | 0.00% | 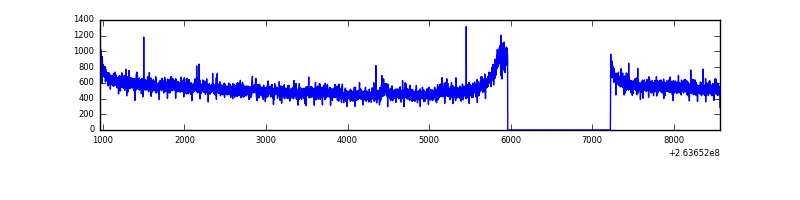 |
| B | 7604 | 6345 | 4 | 4 | 0.05% | 0.06% | 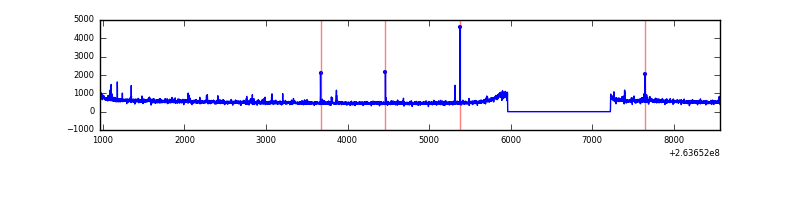 |
| C | 7604 | 6345 | 0 | 0 | 0.00% | 0.00% | 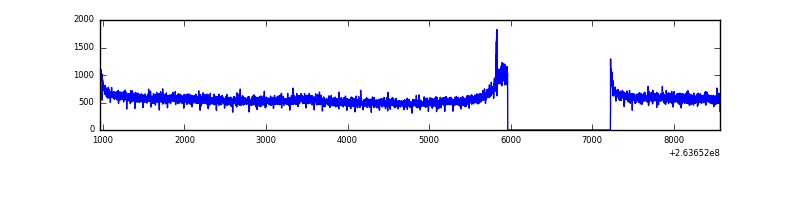 |
| D | 7604 | 6345 | 15 | 15 | 0.20% | 0.24% | 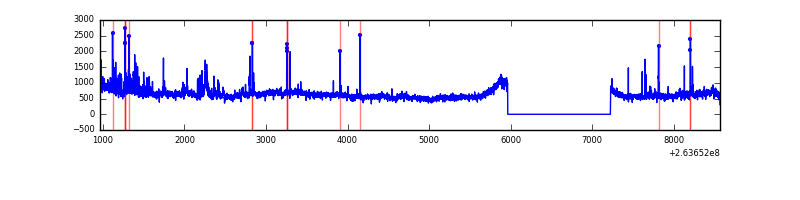 |
Top three noisy pixels from each quadrant. If the there are fewer than three noisy pixels in the level2.evt file, extra rows are filled as -1
| Pixel properties | Quadrant properties | ||||||
|---|---|---|---|---|---|---|---|
| Quadrant | DetID | PixID | Counts | Sigma | Mean | Median | Sigma |
| A | 12 | 189 | 39502 | 223.27 | 864 | 847 | 173.1 |
| A | 9 | 143 | 8048 | 41.59 | 864 | 847 | 173.1 |
| A | 0 | 226 | 7646 | 39.27 | 864 | 847 | 173.1 |
| B | 0 | 189 | 34430 | 208.16 | 856 | 838 | 161.4 |
| B | 3 | 209 | 26322 | 157.91 | 856 | 838 | 161.4 |
| B | 0 | 230 | 23819 | 142.4 | 856 | 838 | 161.4 |
| C | 3 | 233 | 292501 | 1511.18 | 840 | 848 | 193.0 |
| C | 14 | 234 | 7025 | 32.01 | 840 | 848 | 193.0 |
| C | 13 | 61 | 5936 | 26.36 | 840 | 848 | 193.0 |
| D | 8 | 195 | 623571 | 3143.35 | 839 | 819 | 198.1 |
| D | 2 | 152 | 121692 | 610.11 | 839 | 819 | 198.1 |
| D | 7 | 80 | 113651 | 569.52 | 839 | 819 | 198.1 |
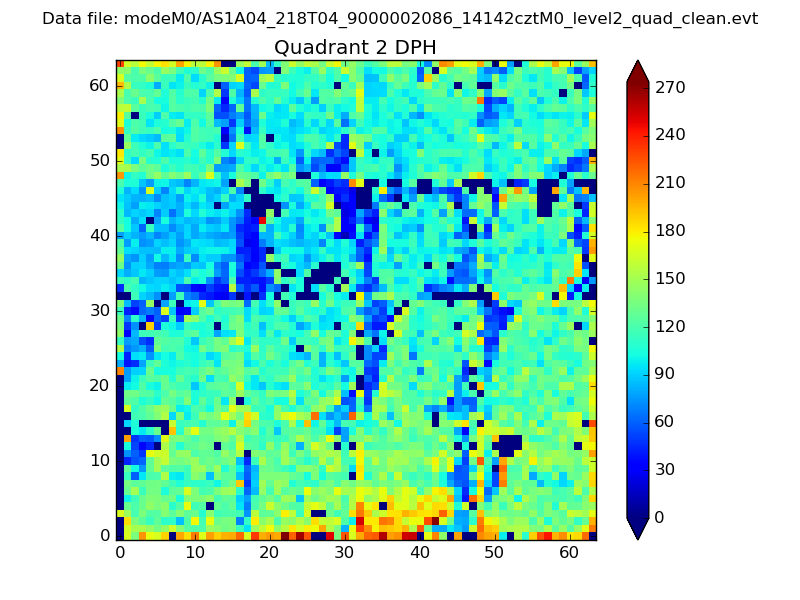
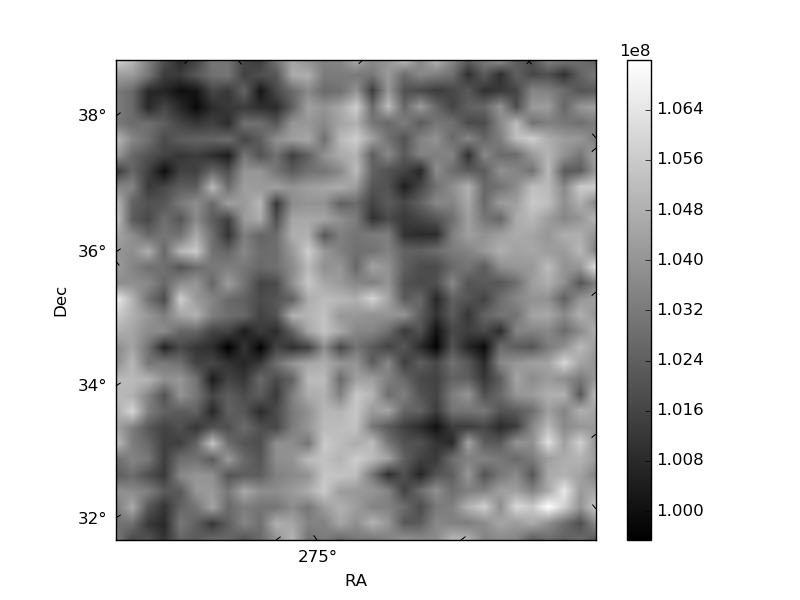
Histogram calculated using DETX and DETY for each event in the final _common_clean file
| Quadrant A | 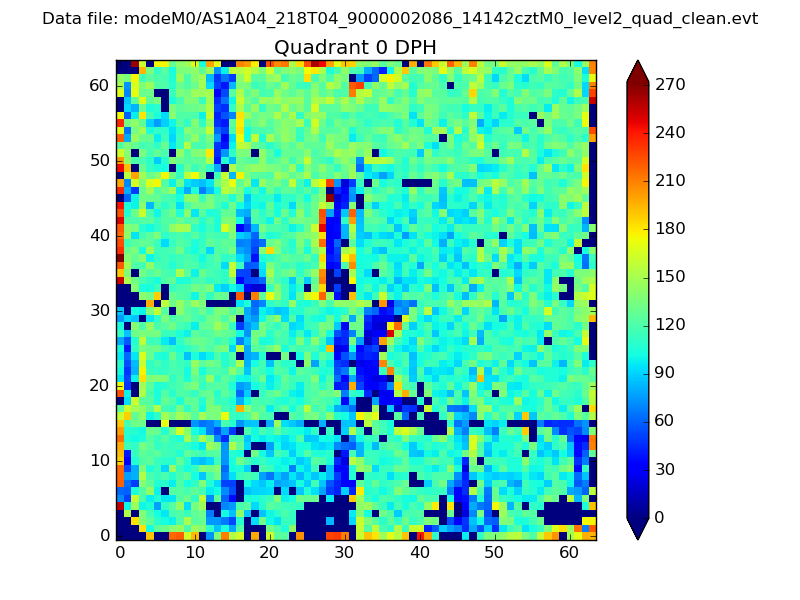 |
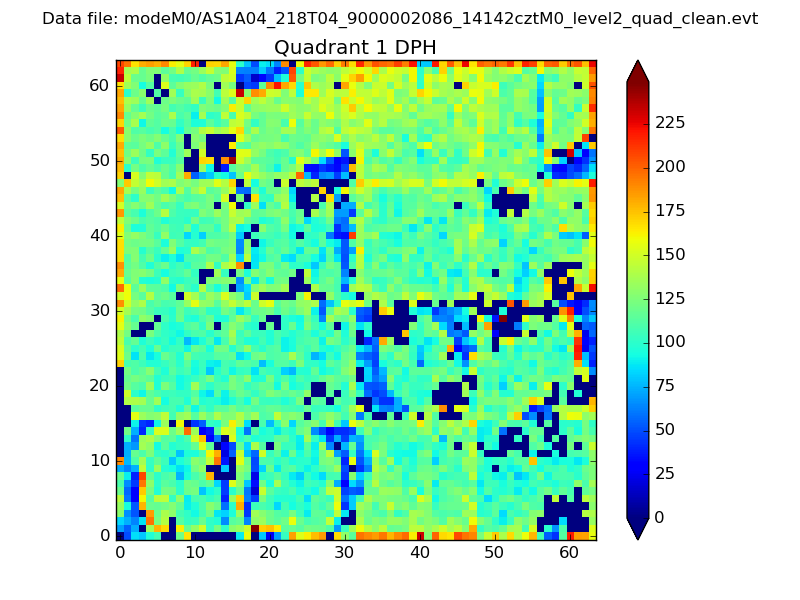 |
Quadrant B |
|---|---|---|---|
| Quadrant D | 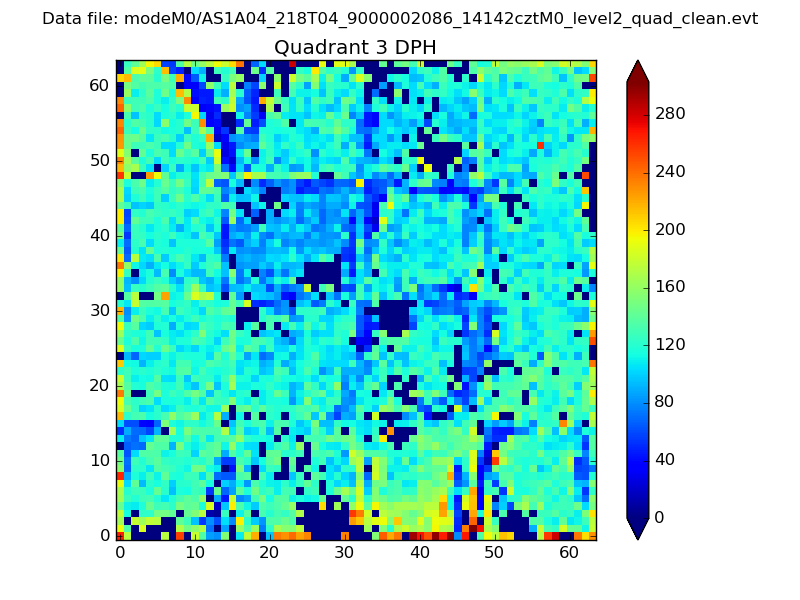 |
 |
Quadrant C |
| Plot type | Count rate plots | Images |
|---|---|---|
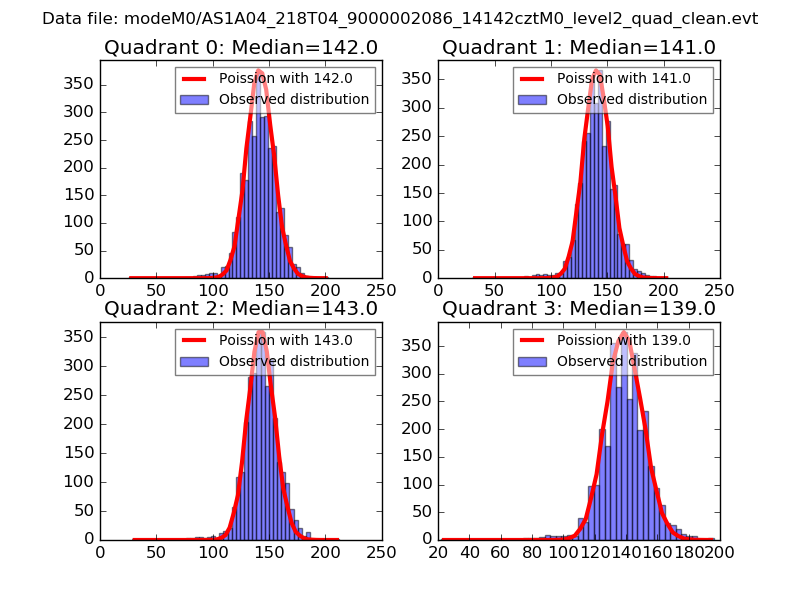
| Comparison with Poisson distribution Blue bars denote a histogram of data divided into 1 sec bins. Red curve is a Poisson curve with rate = median count rate of data. |
 |
 |
| Quadrant-wise count rates Data is divided into 100 sec bins |
 |
|
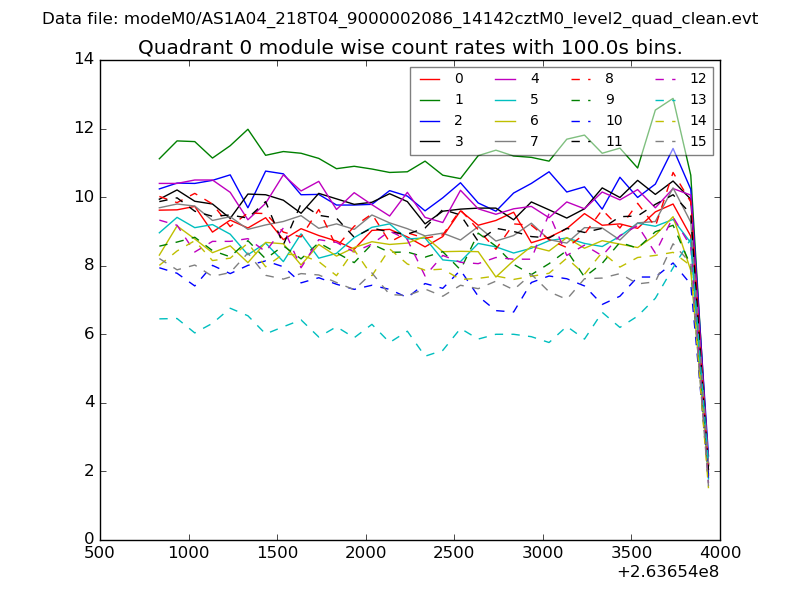
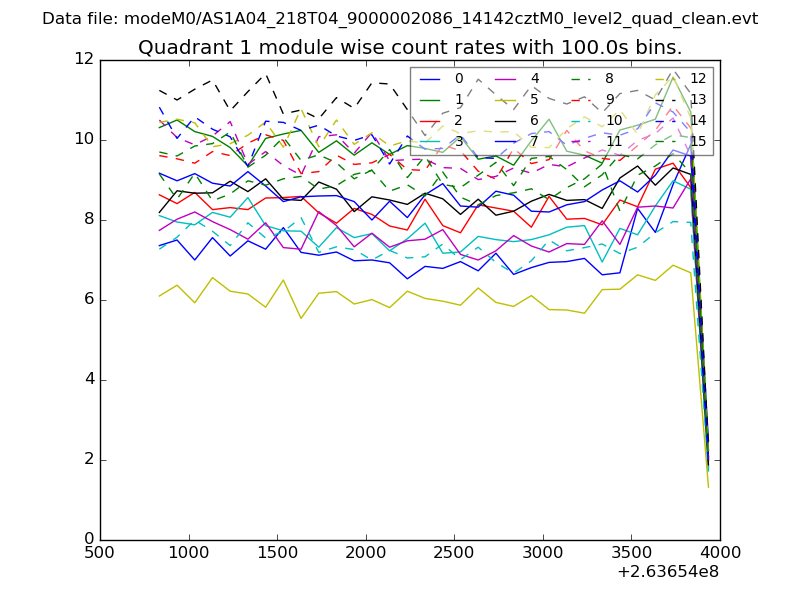
| Module-wise count rates for Quadrant A Data is divided into 100 sec bins |
 |
 |
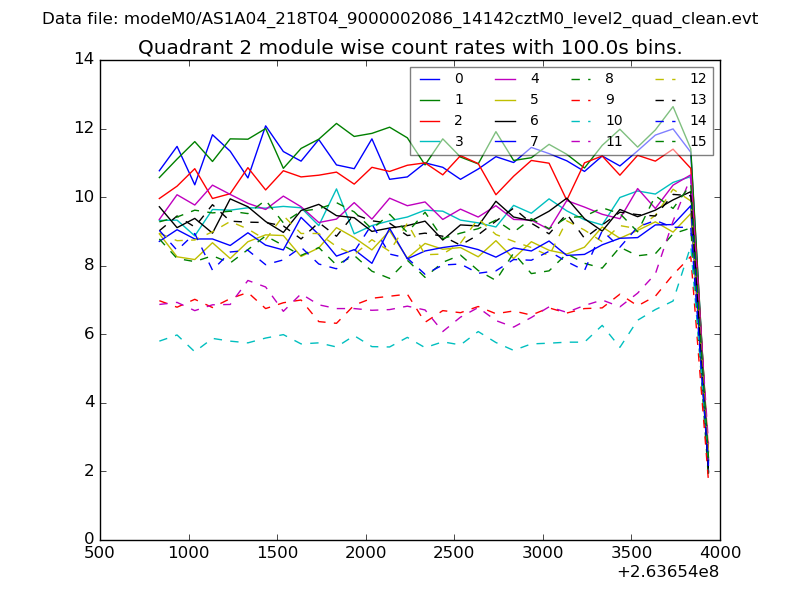
| Module-wise count rates for Quadrant B Data is divided into 100 sec bins |
 |
 |
| Module-wise count rates for Quadrant C Data is divided into 100 sec bins |
 |
 |
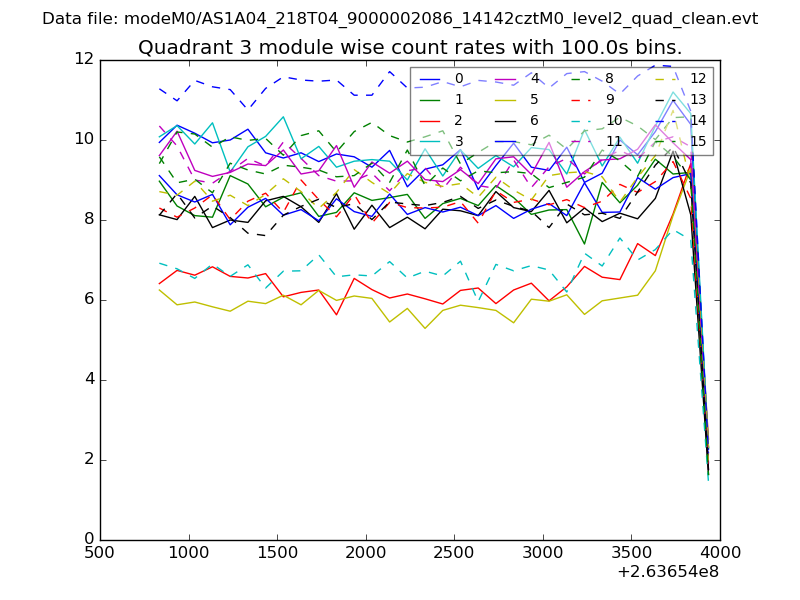
| Module-wise count rates for Quadrant D Data is divided into 100 sec bins |
 |
 |
| Parameter | Plot |
|---|---|
| CZT HV Monitor | 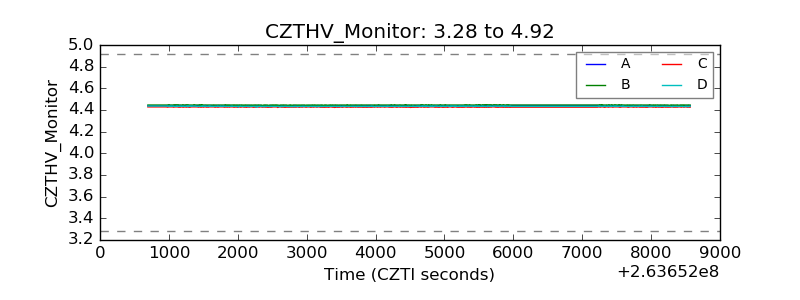 |
| D_VDD | 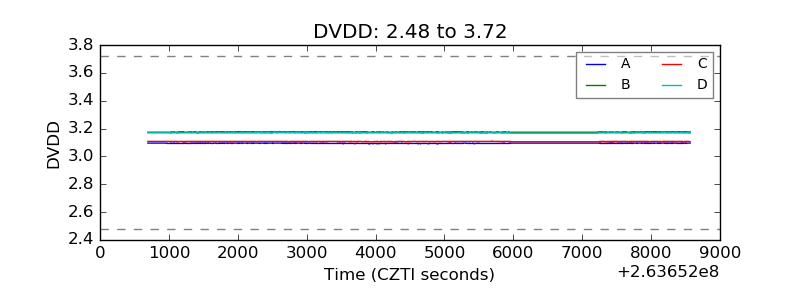 |
| Temperature 1 | 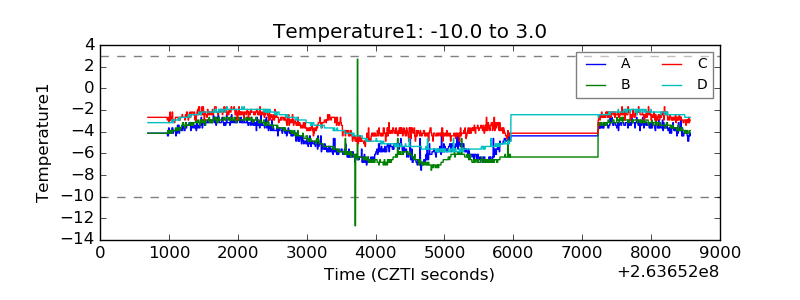 |
| Veto HV Monitor |  |
| Veto LLD | 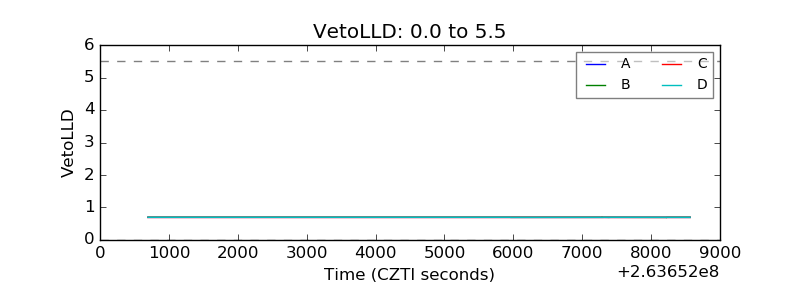 |
| Alpha Counter |  |
| _CPM_Rate |  |
| CZT Counter | 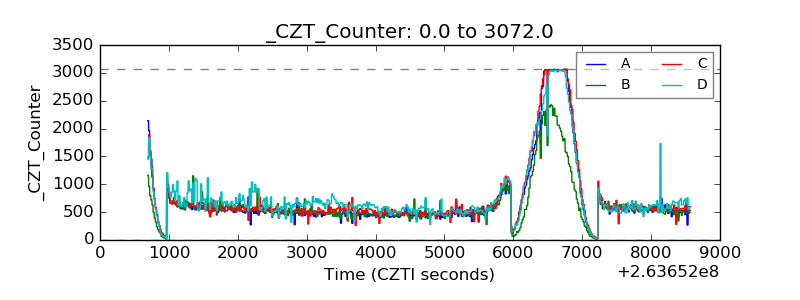 |
| +2.5 Volts monitor | 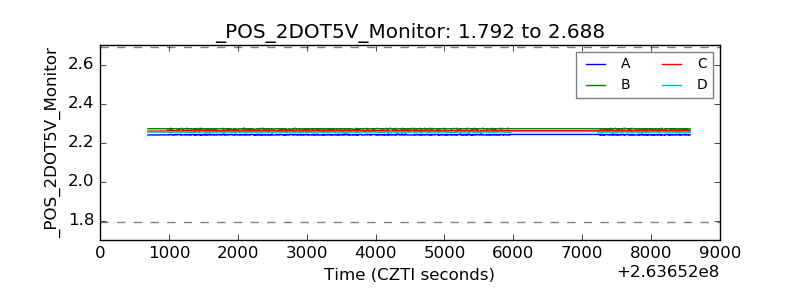 |
| +5 Volts monitor |  |
| _ROLL_ROT | 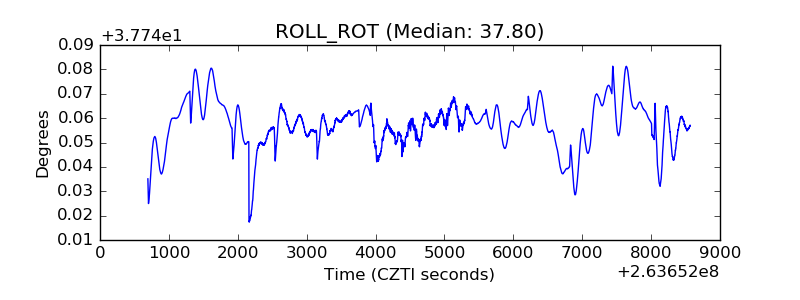 |
| _Roll_DEC | 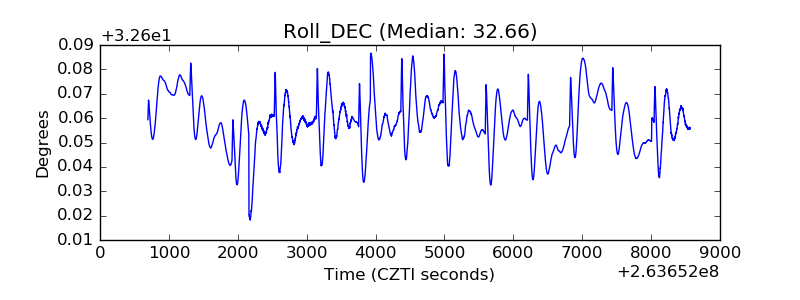 |
| _Roll_RA | 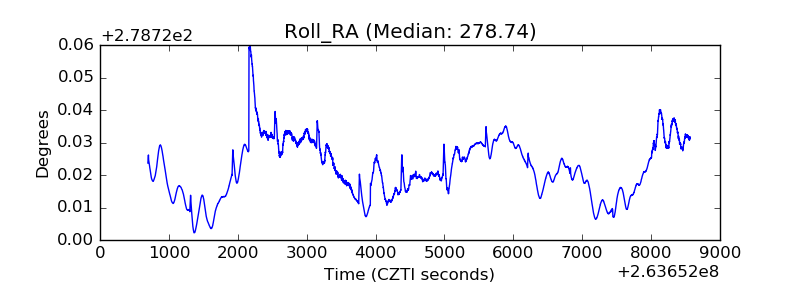 |
| Veto Counter | 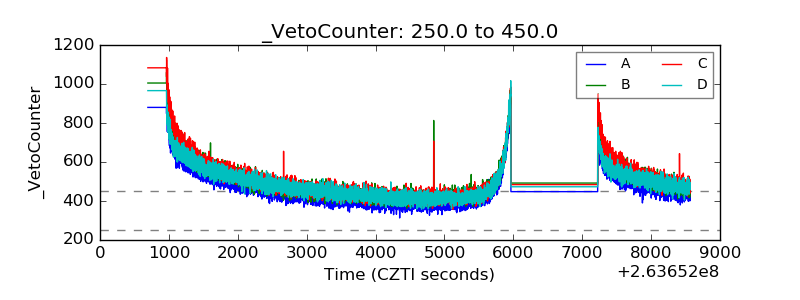 |