| Param | Original file | Final file |
|---|---|---|
| Filename | modeM0/AS1G08_033T01_9000002084cztM0_level2.fits | modeM0/AS1G08_033T01_9000002084cztM0_level2_quad_clean.evt |
| Size (bytes) | 140,054,400 | 155,819,520 |
| Size | 133.6 MB | 148.6 MB |
| Events in quadrant A | 872,148 | 1,017,038 |
| Events in quadrant B | 821,442 | 967,246 |
| Events in quadrant C | 838,514 | 916,195 |
| Events in quadrant D | 712,062 | 820,914 |
| Mode SS | |||
|---|---|---|---|
| Quadrant | BADHDUFLAG | Total packets | Discarded packets |
| A | 0 | 292 | 0 |
| B | 0 | 292 | 0 |
| C | 0 | 292 | 0 |
| D | 0 | 292 | 0 |
| Mode M0 | |||
|---|---|---|---|
| Quadrant | BADHDUFLAG | Total packets | Discarded packets |
| A | 0 | 30735 | 0 |
| B | 0 | 35944 | 0 |
| C | 0 | 30362 | 0 |
| D | 0 | 41624 | 0 |
| Mode M9 | |||
|---|---|---|---|
| Quadrant | BADHDUFLAG | Total packets | Discarded packets |
| A | 0 | 29 | 0 |
| B | 0 | 29 | 0 |
| C | 0 | 29 | 0 |
| D | 0 | 29 | 0 |
| Quadrant | Total seconds | Saturated seconds | Saturation percentage |
|---|---|---|---|
| A | 14454 | 190 | 1.314515% |
| B | 14454 | 756 | 5.230386% |
| C | 14454 | 79 | 0.546562% |
| D | 14454 | 668 | 4.621558% |
Noise dominated data is calculated using 1-second bins in cleaned event files. If a bin has >2000 counts, and if more than 50% of those come from <1% of pixels, then it is considered to be noise-dominated and hence unusable.
| Quadrant | # 1 sec bins | Bins with >0 counts | Bins with >2000 counts | High rate bins dominated by noise | Noise dominated (total time) | Noise dominated (detector-on time) | Marked lightcurve |
|---|---|---|---|---|---|---|---|
| A | 17234 | 14454 | 0 | 0 | 0.00% | 0.00% |  |
| B | 17234 | 14447 | 0 | 0 | 0.00% | 0.00% |  |
| C | 17234 | 14454 | 0 | 0 | 0.00% | 0.00% |  |
| D | 17234 | 14436 | 0 | 0 | 0.00% | 0.00% |  |
Top three noisy pixels from each quadrant. If the there are fewer than three noisy pixels in the level2.evt file, extra rows are filled as -1
| Pixel properties | Quadrant properties | ||||||
|---|---|---|---|---|---|---|---|
| Quadrant | DetID | PixID | Counts | Sigma | Mean | Median | Sigma |
| A | 0 | 29 | 832 | 10.68 | 226 | 214 | 57.9 |
| A | 7 | 110 | 743 | 9.14 | 226 | 214 | 57.9 |
| A | 9 | 19 | 674 | 7.95 | 226 | 214 | 57.9 |
| B | 2 | 9 | 701 | 11.04 | 216 | 207 | 44.8 |
| B | 3 | 17 | 573 | 8.18 | 216 | 207 | 44.8 |
| B | 5 | 232 | 566 | 8.02 | 216 | 207 | 44.8 |
| C | 1 | 80 | 634 | 7.31 | 221 | 207 | 58.4 |
| C | 1 | 81 | 619 | 7.06 | 221 | 207 | 58.4 |
| C | 12 | 241 | 592 | 6.59 | 221 | 207 | 58.4 |
| D | 4 | 246 | 587 | 7.29 | 202 | 185 | 55.2 |
| D | 6 | 231 | 547 | 6.56 | 202 | 185 | 55.2 |
| D | 7 | 3 | 504 | 5.78 | 202 | 185 | 55.2 |
Histogram calculated using DETX and DETY for each event in the final _common_clean file
| Quadrant A | 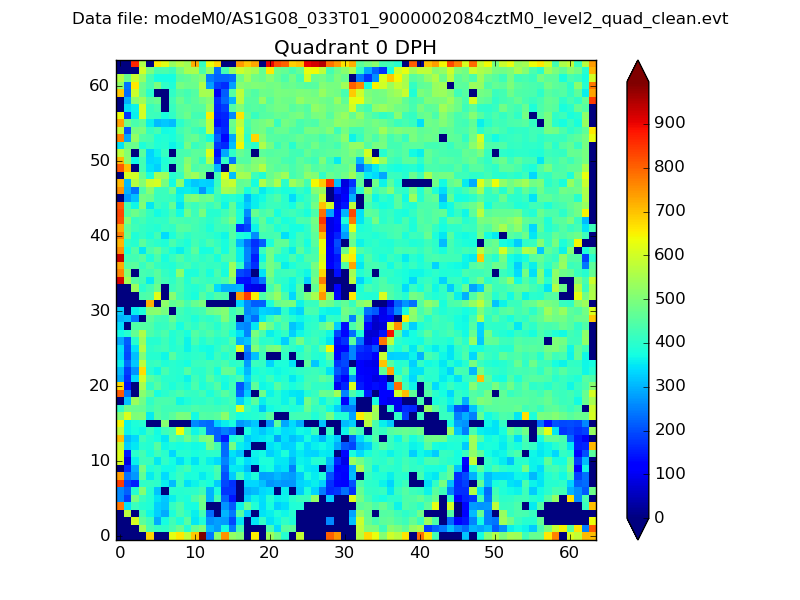 |
 |
Quadrant B |
|---|---|---|---|
| Quadrant D |  |
 |
Quadrant C |
| Plot type | Count rate plots | Images |
|---|---|---|
| Comparison with Poisson distribution Blue bars denote a histogram of data divided into 1 sec bins. Red curve is a Poisson curve with rate = median count rate of data. |
 |
 |
| Quadrant-wise count rates Data is divided into 100 sec bins |
 |
|
| Module-wise count rates for Quadrant A Data is divided into 100 sec bins |
 |
 |
| Module-wise count rates for Quadrant B Data is divided into 100 sec bins |
 |
 |
| Module-wise count rates for Quadrant C Data is divided into 100 sec bins |
 |
 |
| Module-wise count rates for Quadrant D Data is divided into 100 sec bins |
 |
 |
| Parameter | Plot |
|---|---|
| CZT HV Monitor |  |
| D_VDD |  |
| Temperature 1 |  |
| Veto HV Monitor |  |
| Veto LLD |  |
| Alpha Counter |  |
| _CPM_Rate |  |
| CZT Counter |  |
| +2.5 Volts monitor |  |
| +5 Volts monitor |  |
| _ROLL_ROT |  |
| _Roll_DEC |  |
| _Roll_RA |  |
| Veto Counter |  |