| Param | Original file | Final file |
|---|---|---|
| Filename | modeM0/AS1G08_033T01_9000002084_14128cztM0_level2.evt | modeM0/AS1G08_033T01_9000002084_14128cztM0_level2_quad_clean.evt |
| Size (bytes) | 323,179,200 | 64,396,800 |
| Size | 308.2 MB | 61.4 MB |
| Events in quadrant A | 1,940,076 | 439,792 |
| Events in quadrant B | 2,553,851 | 425,977 |
| Events in quadrant C | 1,933,807 | 419,406 |
| Events in quadrant D | 3,101,361 | 396,885 |
| Mode SS | |||
|---|---|---|---|
| Quadrant | BADHDUFLAG | Total packets | Discarded packets |
| A | 0 | 78 | 0 |
| B | 0 | 78 | 0 |
| C | 0 | 78 | 0 |
| D | 0 | 78 | 0 |
| Mode M0 | |||
|---|---|---|---|
| Quadrant | BADHDUFLAG | Total packets | Discarded packets |
| A | 0 | 8172 | 2 |
| B | 0 | 10001 | 1 |
| C | 0 | 8016 | 1 |
| D | 0 | 11786 | 1 |
| Mode M9 | |||
|---|---|---|---|
| Quadrant | BADHDUFLAG | Total packets | Discarded packets |
| A | 0 | 13 | 0 |
| B | 0 | 13 | 0 |
| C | 0 | 13 | 0 |
| D | 0 | 13 | 0 |
| Quadrant | Total seconds | Saturated seconds | Saturation percentage |
|---|---|---|---|
| A | 3788 | 65 | 1.715945% |
| B | 3788 | 246 | 6.494192% |
| C | 3788 | 23 | 0.607181% |
| D | 3788 | 207 | 5.464625% |
Noise dominated data is calculated using 1-second bins in cleaned event files. If a bin has >2000 counts, and if more than 50% of those come from <1% of pixels, then it is considered to be noise-dominated and hence unusable.
| Quadrant | # 1 sec bins | Bins with >0 counts | Bins with >2000 counts | High rate bins dominated by noise | Noise dominated (total time) | Noise dominated (detector-on time) | Marked lightcurve |
|---|---|---|---|---|---|---|---|
| A | 5069 | 3790 | 0 | 0 | 0.00% | 0.00% | 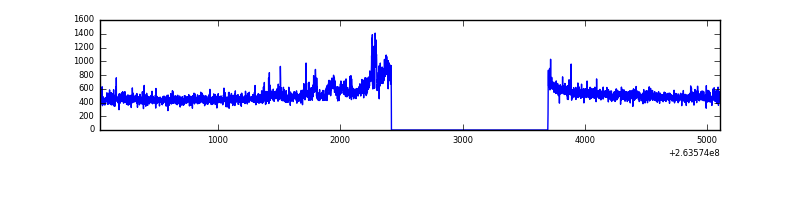 |
| B | 5069 | 3790 | 166 | 166 | 3.27% | 4.38% | 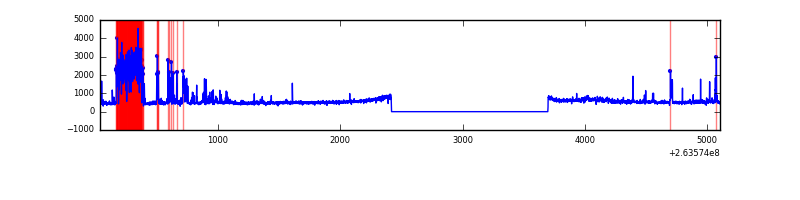 |
| C | 5069 | 3790 | 0 | 0 | 0.00% | 0.00% | 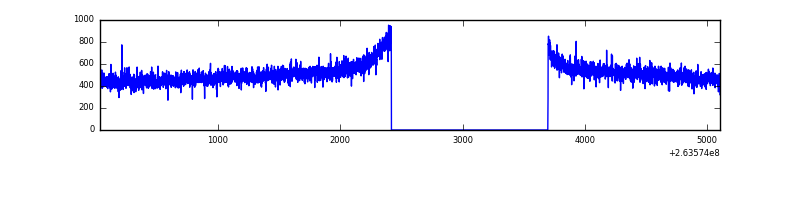 |
| D | 5069 | 3790 | 150 | 150 | 2.96% | 3.96% | 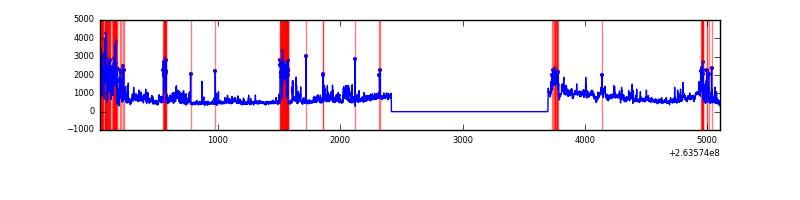 |
Top three noisy pixels from each quadrant. If the there are fewer than three noisy pixels in the level2.evt file, extra rows are filled as -1
| Pixel properties | Quadrant properties | ||||||
|---|---|---|---|---|---|---|---|
| Quadrant | DetID | PixID | Counts | Sigma | Mean | Median | Sigma |
| A | 12 | 189 | 67896 | 689.51 | 482 | 472 | 97.8 |
| A | 9 | 143 | 8620 | 83.33 | 482 | 472 | 97.8 |
| A | 12 | 96 | 4473 | 40.92 | 482 | 472 | 97.8 |
| B | 0 | 85 | 578720 | 6410.93 | 474 | 462 | 90.2 |
| B | 10 | 252 | 51121 | 561.64 | 474 | 462 | 90.2 |
| B | 0 | 190 | 29842 | 325.73 | 474 | 462 | 90.2 |
| C | 3 | 233 | 115209 | 1062.8 | 465 | 467 | 108.0 |
| C | 13 | 61 | 3383 | 27.01 | 465 | 467 | 108.0 |
| C | 5 | 96 | 3155 | 24.9 | 465 | 467 | 108.0 |
| D | 1 | 52 | 881193 | 8000.52 | 455 | 445 | 110.1 |
| D | 7 | 80 | 231438 | 2098.29 | 455 | 445 | 110.1 |
| D | 8 | 195 | 193058 | 1749.65 | 455 | 445 | 110.1 |
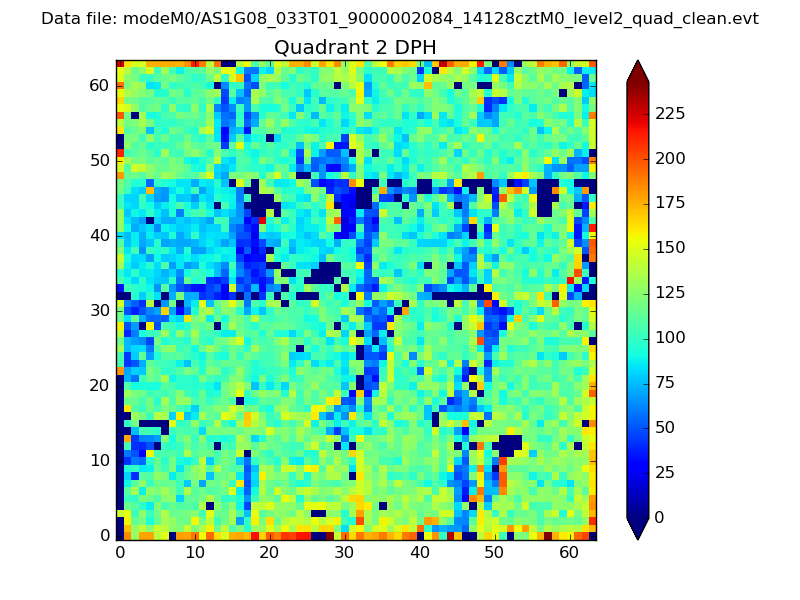
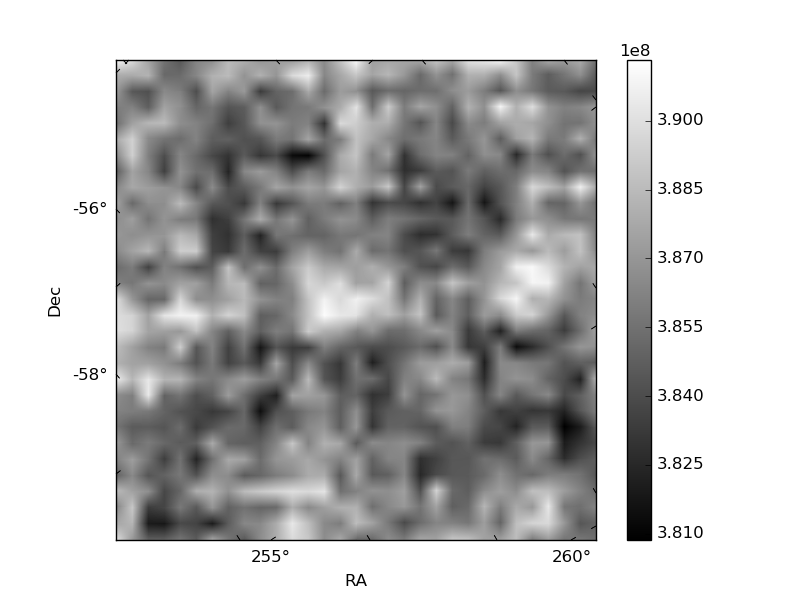
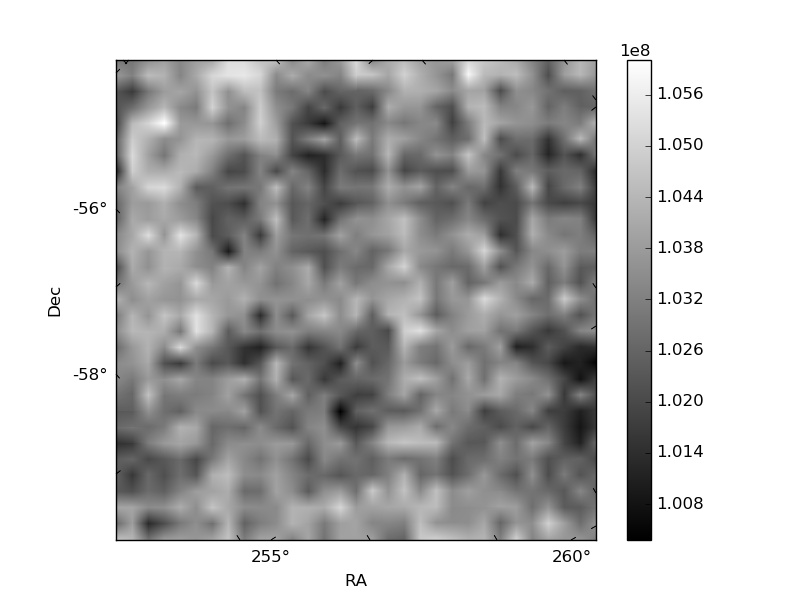
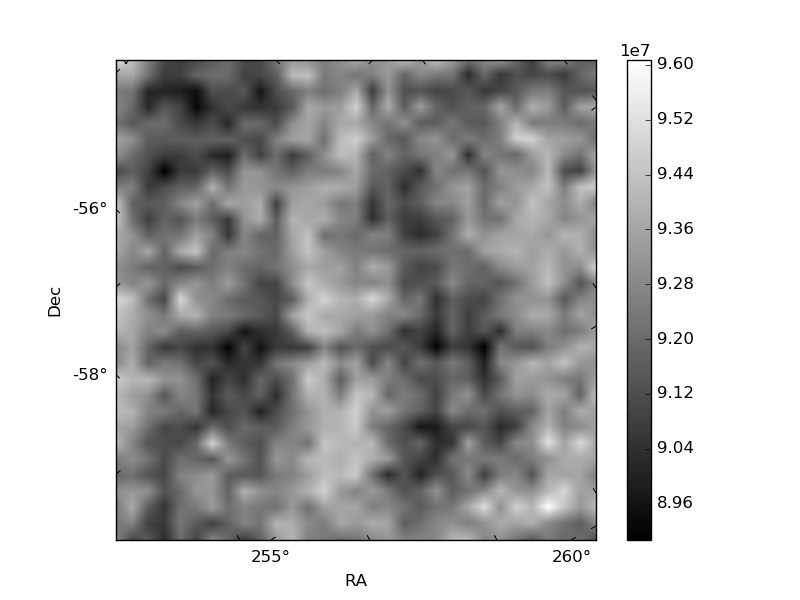
Histogram calculated using DETX and DETY for each event in the final _common_clean file
| Quadrant A | 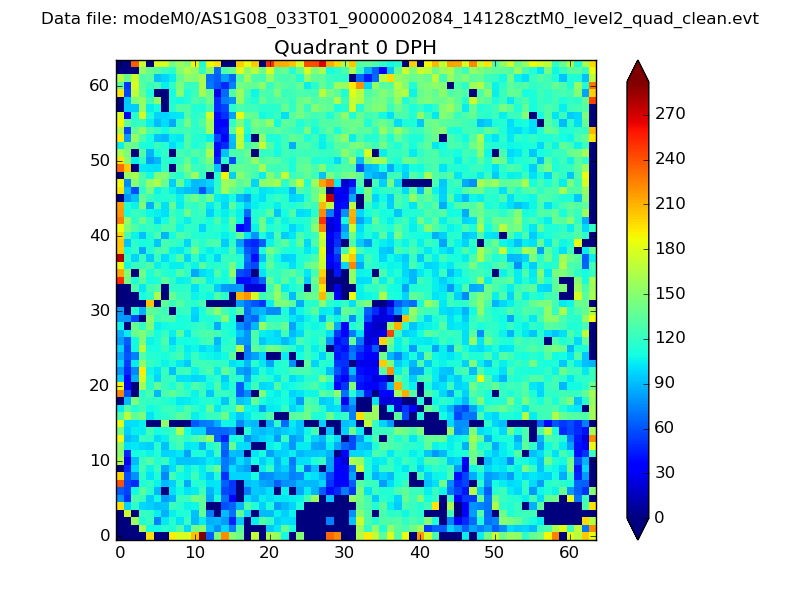 |
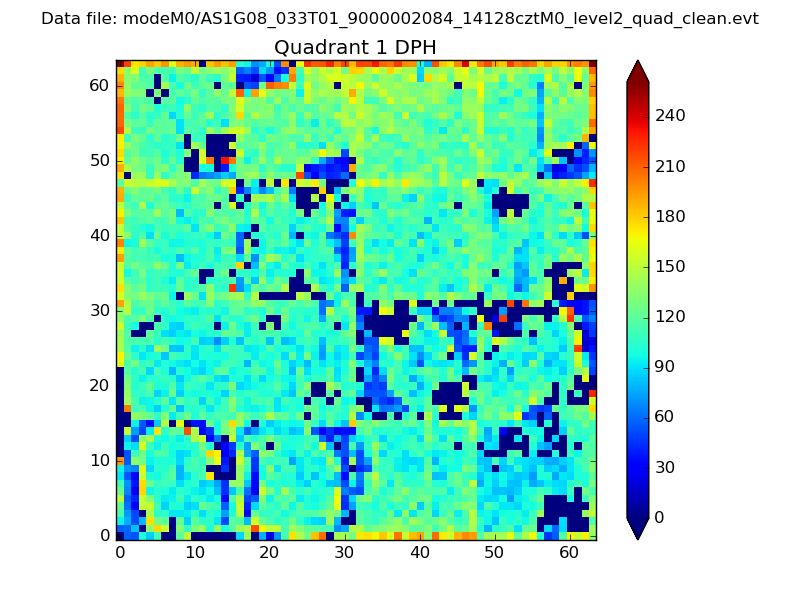 |
Quadrant B |
|---|---|---|---|
| Quadrant D | 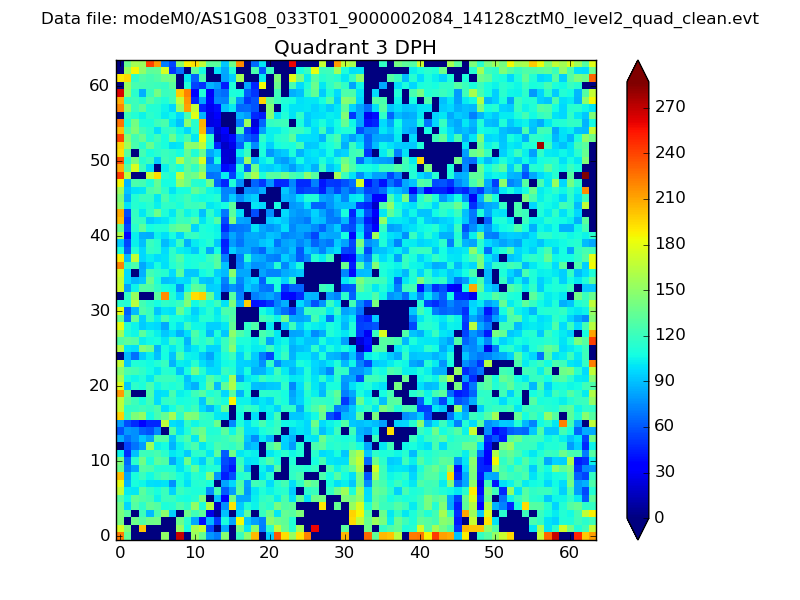 |
 |
Quadrant C |
| Plot type | Count rate plots | Images |
|---|---|---|
| Comparison with Poisson distribution Blue bars denote a histogram of data divided into 1 sec bins. Red curve is a Poisson curve with rate = median count rate of data. |
 |
 |
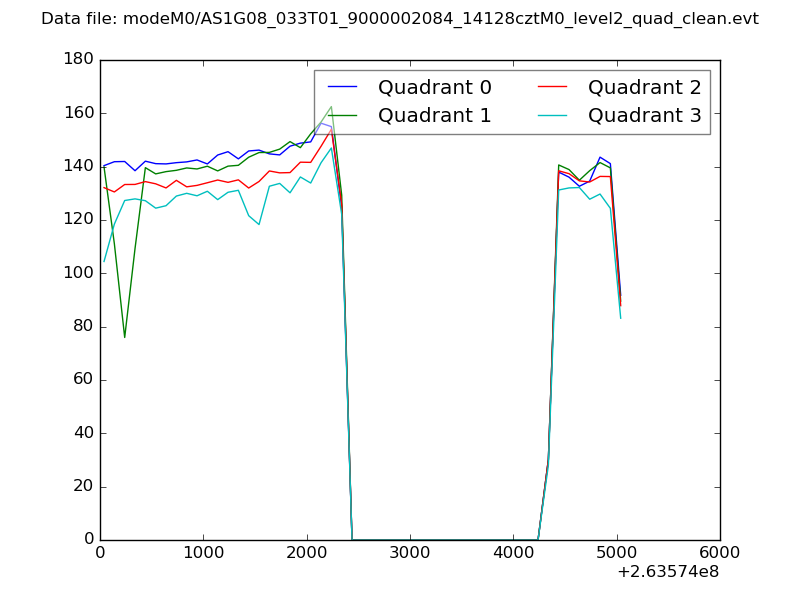
| Quadrant-wise count rates Data is divided into 100 sec bins |
 |
|
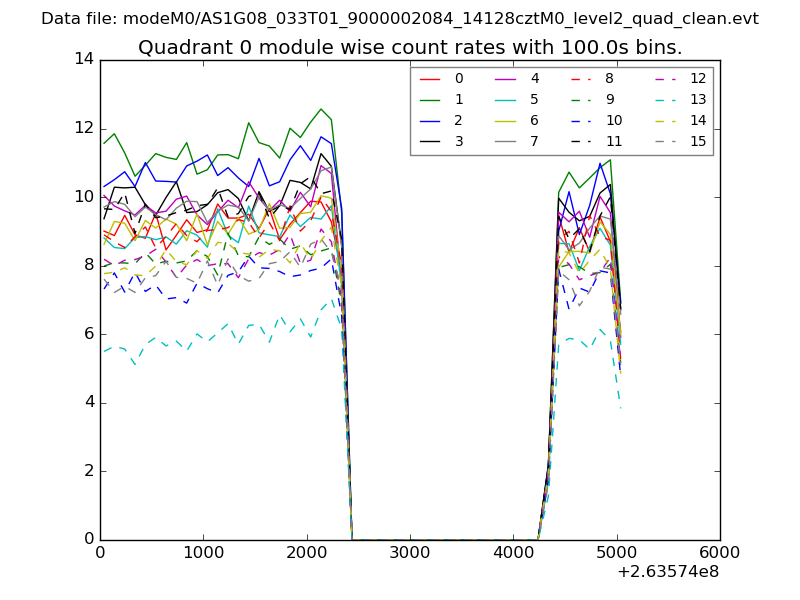
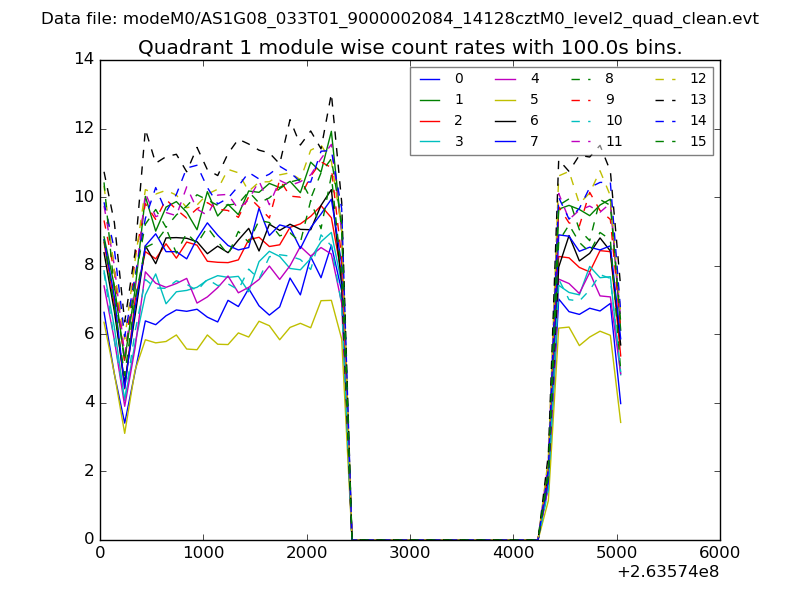
| Module-wise count rates for Quadrant A Data is divided into 100 sec bins |
 |
 |
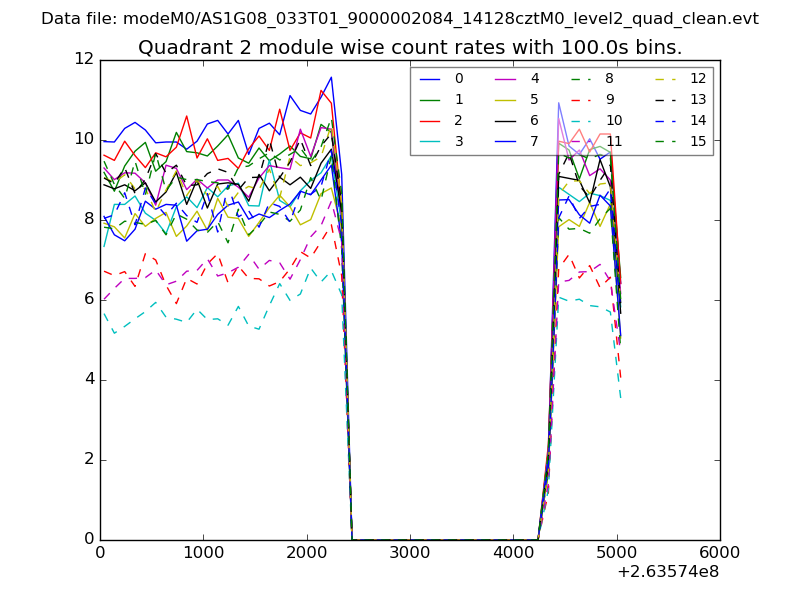
| Module-wise count rates for Quadrant B Data is divided into 100 sec bins |
 |
 |
| Module-wise count rates for Quadrant C Data is divided into 100 sec bins |
 |
 |
| Module-wise count rates for Quadrant D Data is divided into 100 sec bins |
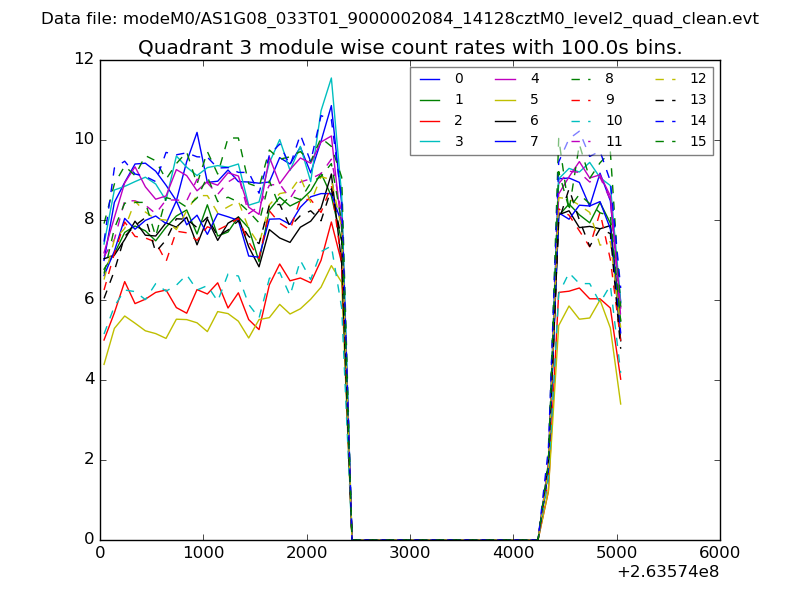 |
 |
| Parameter | Plot |
|---|---|
| CZT HV Monitor | 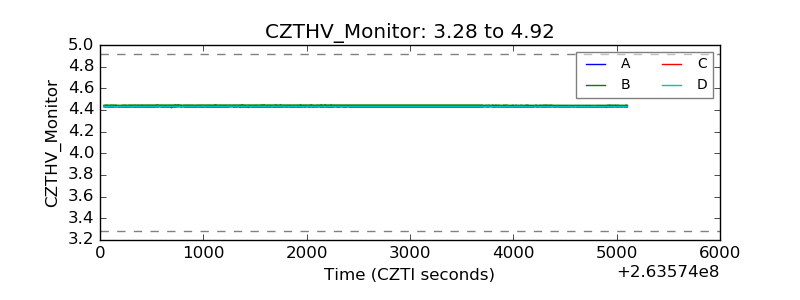 |
| D_VDD | 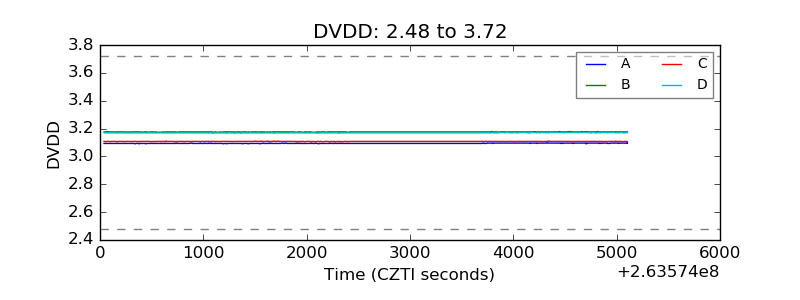 |
| Temperature 1 |  |
| Veto HV Monitor | 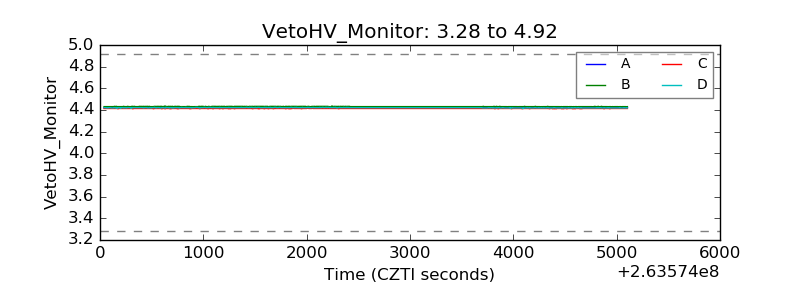 |
| Veto LLD | 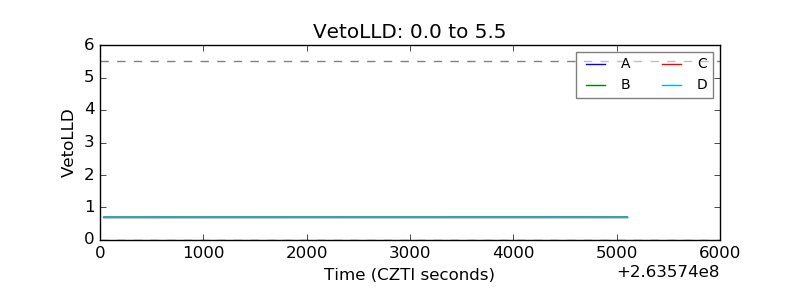 |
| Alpha Counter |  |
| _CPM_Rate | 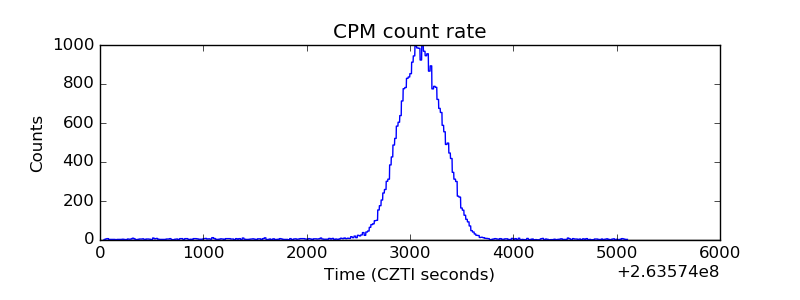 |
| CZT Counter |  |
| +2.5 Volts monitor |  |
| +5 Volts monitor |  |
| _ROLL_ROT | 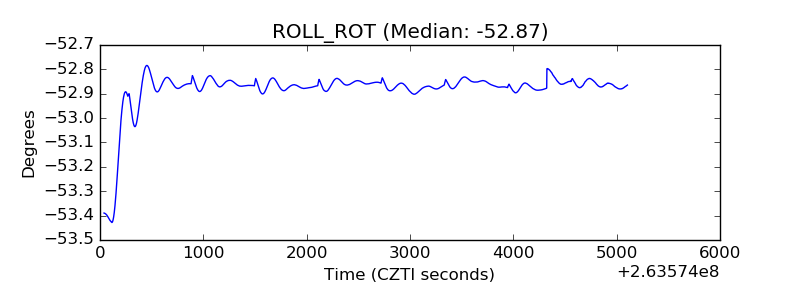 |
| _Roll_DEC | 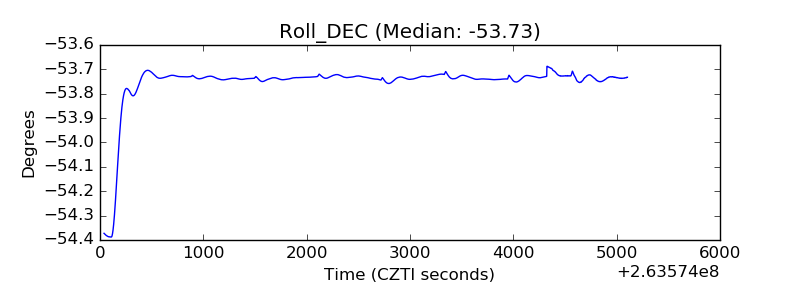 |
| _Roll_RA |  |
| Veto Counter | 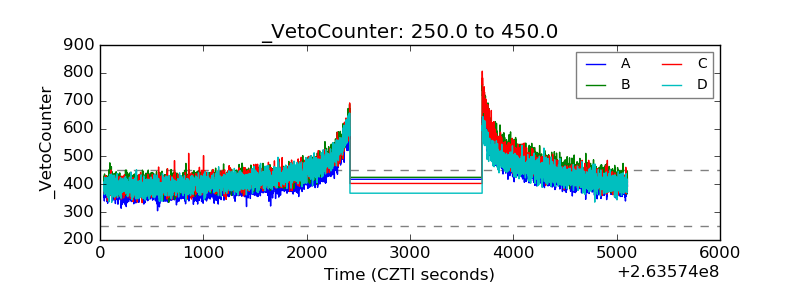 |