| Param | Original file | Final file |
|---|---|---|
| Filename | modeM0/AS1G08_033T01_9000002084_14129cztM0_level2.evt | modeM0/AS1G08_033T01_9000002084_14129cztM0_level2_quad_clean.evt |
| Size (bytes) | 519,546,240 | 102,985,920 |
| Size | 495.5 MB | 98.2 MB |
| Events in quadrant A | 3,265,124 | 692,778 |
| Events in quadrant B | 3,871,165 | 675,421 |
| Events in quadrant C | 3,276,328 | 658,407 |
| Events in quadrant D | 4,872,376 | 630,348 |
| Mode SS | |||
|---|---|---|---|
| Quadrant | BADHDUFLAG | Total packets | Discarded packets |
| A | 0 | 132 | 0 |
| B | 0 | 132 | 0 |
| C | 0 | 132 | 0 |
| D | 0 | 132 | 0 |
| Mode M0 | |||
|---|---|---|---|
| Quadrant | BADHDUFLAG | Total packets | Discarded packets |
| A | 0 | 13912 | 3 |
| B | 0 | 15844 | 2 |
| C | 0 | 13880 | 2 |
| D | 0 | 18898 | 2 |
| Mode M9 | |||
|---|---|---|---|
| Quadrant | BADHDUFLAG | Total packets | Discarded packets |
| A | 0 | 20 | 0 |
| B | 0 | 20 | 0 |
| C | 0 | 20 | 0 |
| D | 0 | 21 | 0 |
| Quadrant | Total seconds | Saturated seconds | Saturation percentage |
|---|---|---|---|
| A | 6633 | 71 | 1.070406% |
| B | 6633 | 301 | 4.537916% |
| C | 6633 | 32 | 0.482436% |
| D | 6633 | 247 | 3.723805% |
Noise dominated data is calculated using 1-second bins in cleaned event files. If a bin has >2000 counts, and if more than 50% of those come from <1% of pixels, then it is considered to be noise-dominated and hence unusable.
| Quadrant | # 1 sec bins | Bins with >0 counts | Bins with >2000 counts | High rate bins dominated by noise | Noise dominated (total time) | Noise dominated (detector-on time) | Marked lightcurve |
|---|---|---|---|---|---|---|---|
| A | 7594 | 6635 | 4 | 4 | 0.05% | 0.06% | 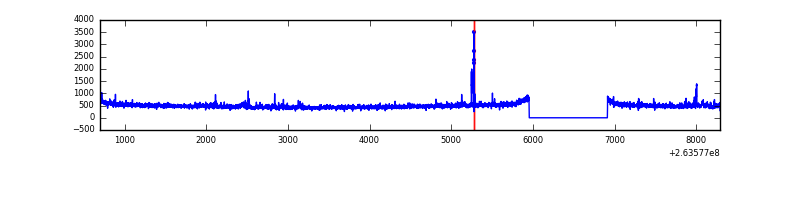 |
| B | 7594 | 6635 | 97 | 97 | 1.28% | 1.46% | 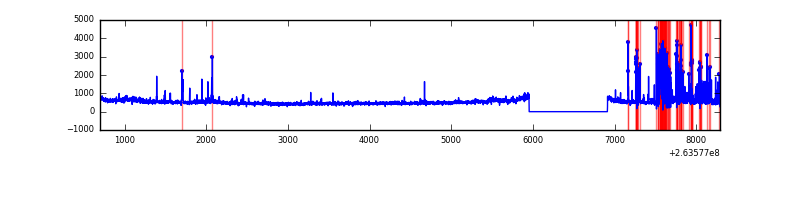 |
| C | 7594 | 6635 | 0 | 0 | 0.00% | 0.00% | 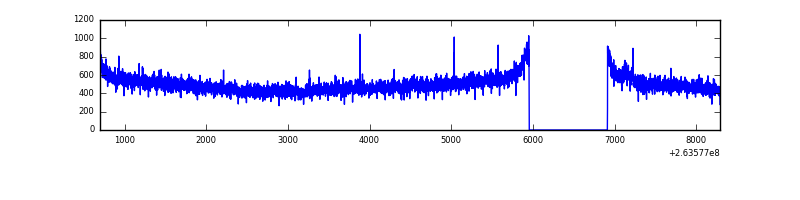 |
| D | 7594 | 6635 | 131 | 131 | 1.73% | 1.97% | 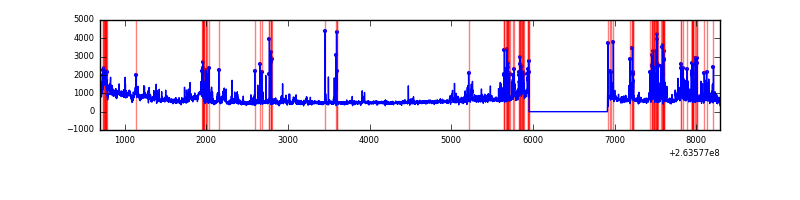 |
Top three noisy pixels from each quadrant. If the there are fewer than three noisy pixels in the level2.evt file, extra rows are filled as -1
| Pixel properties | Quadrant properties | ||||||
|---|---|---|---|---|---|---|---|
| Quadrant | DetID | PixID | Counts | Sigma | Mean | Median | Sigma |
| A | 12 | 189 | 76989 | 462.05 | 821 | 806 | 164.9 |
| A | 12 | 96 | 24035 | 140.88 | 821 | 806 | 164.9 |
| A | 0 | 226 | 7303 | 39.4 | 821 | 806 | 164.9 |
| B | 0 | 85 | 466999 | 3075.84 | 806 | 785 | 151.6 |
| B | 10 | 252 | 58152 | 378.48 | 806 | 785 | 151.6 |
| B | 0 | 189 | 47773 | 310.0 | 806 | 785 | 151.6 |
| C | 3 | 233 | 189796 | 1044.01 | 786 | 788 | 181.0 |
| C | 14 | 220 | 12750 | 66.07 | 786 | 788 | 181.0 |
| C | 13 | 61 | 5773 | 27.54 | 786 | 788 | 181.0 |
| D | 1 | 52 | 1086313 | 5517.5 | 768 | 751 | 196.7 |
| D | 8 | 195 | 539495 | 2738.23 | 768 | 751 | 196.7 |
| D | 7 | 80 | 112175 | 566.33 | 768 | 751 | 196.7 |
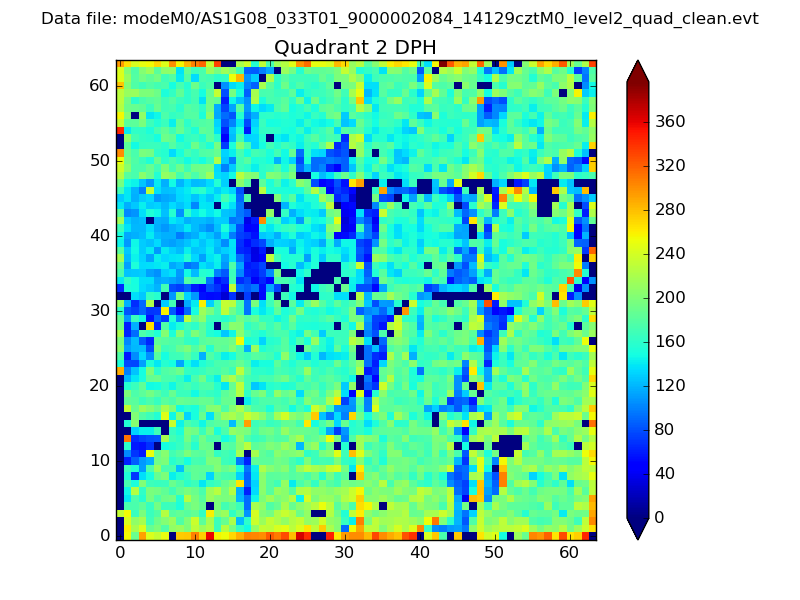
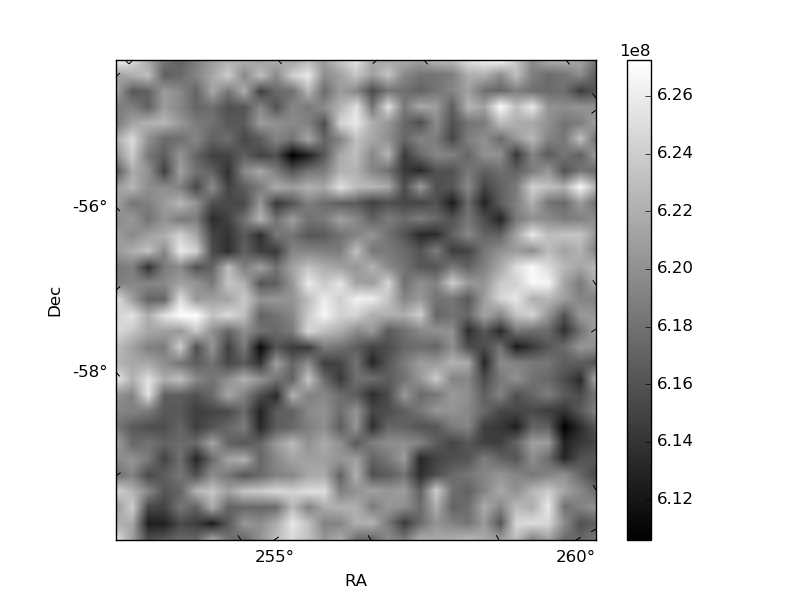
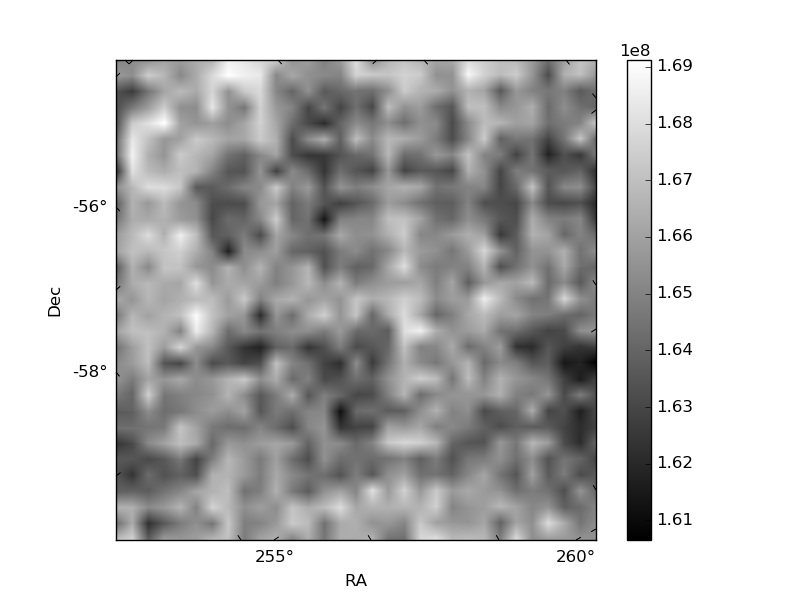
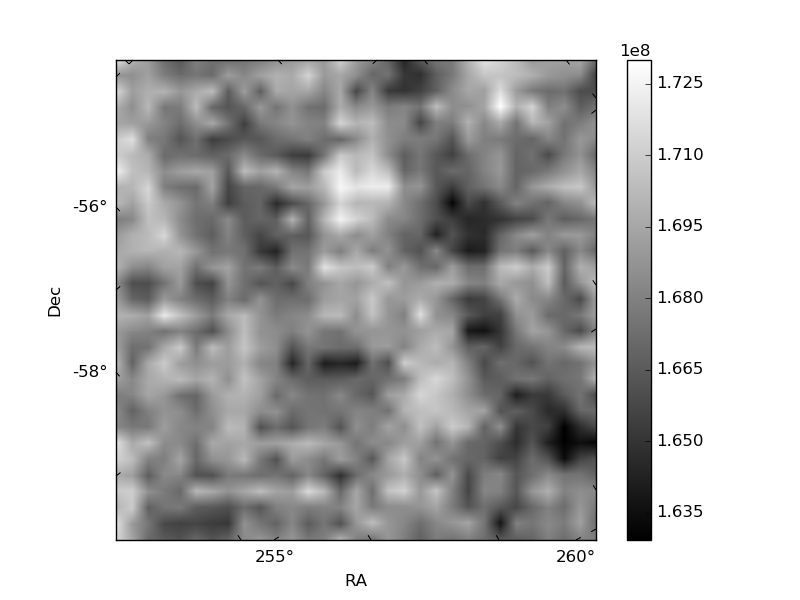
Histogram calculated using DETX and DETY for each event in the final _common_clean file
| Quadrant A | 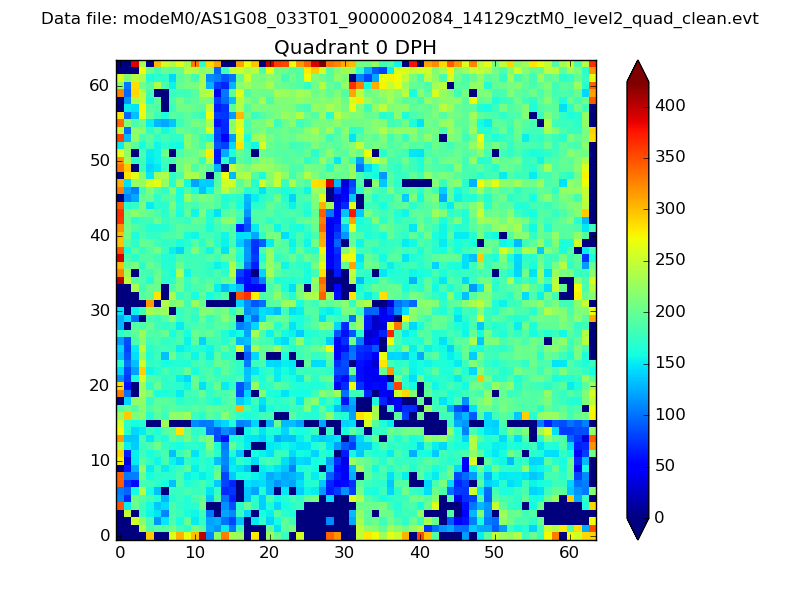 |
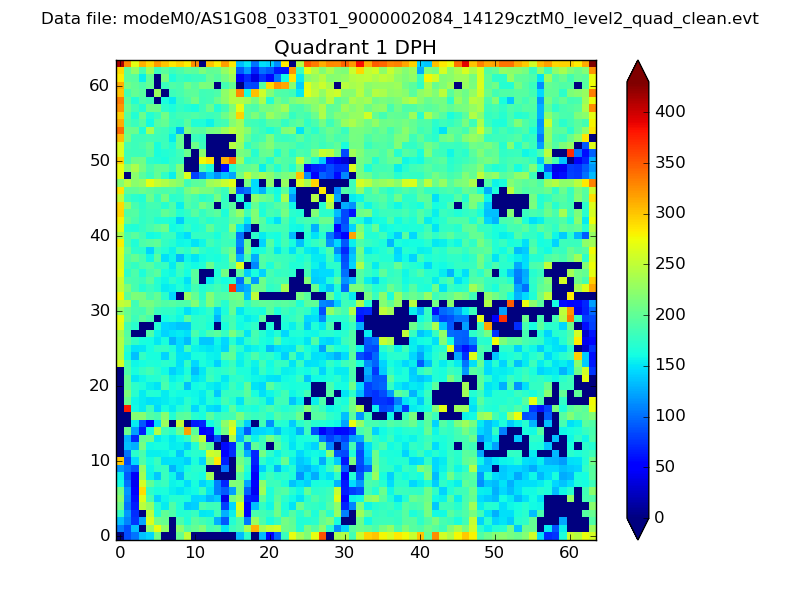 |
Quadrant B |
|---|---|---|---|
| Quadrant D | 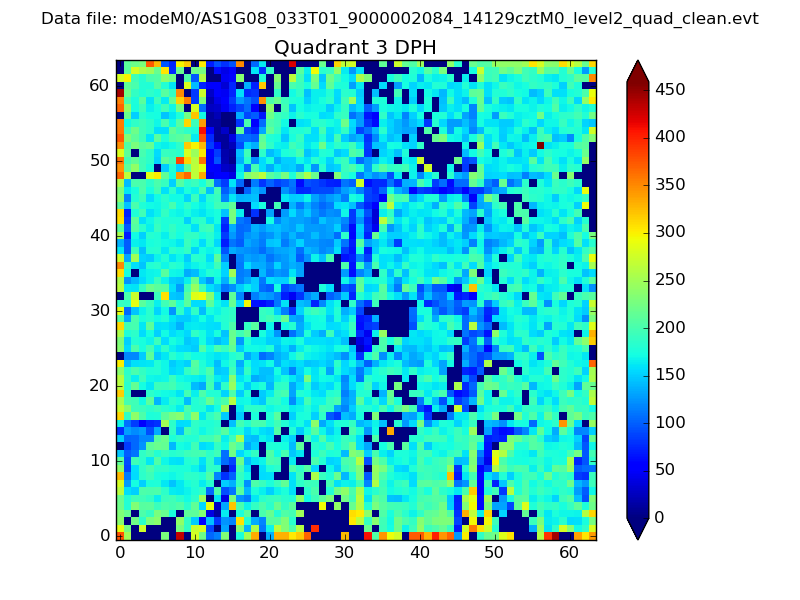 |
 |
Quadrant C |
| Plot type | Count rate plots | Images |
|---|---|---|
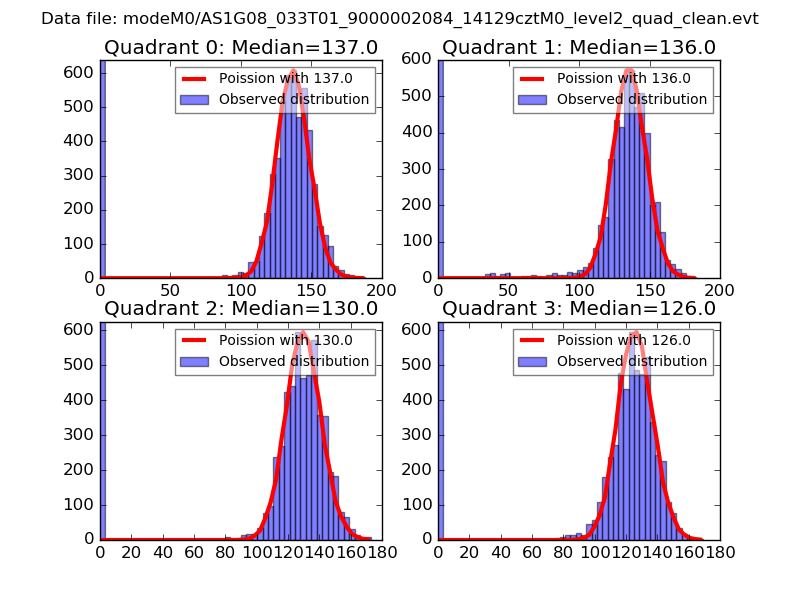
| Comparison with Poisson distribution Blue bars denote a histogram of data divided into 1 sec bins. Red curve is a Poisson curve with rate = median count rate of data. |
 |
 |
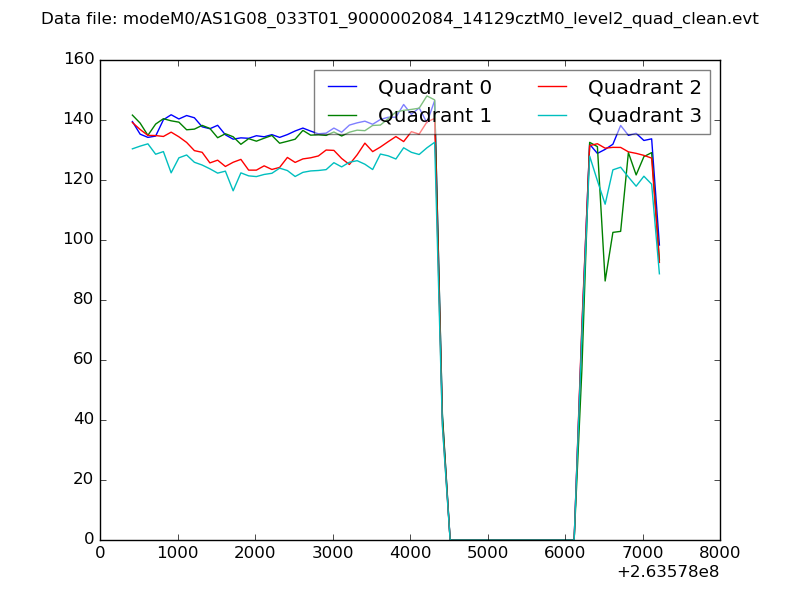
| Quadrant-wise count rates Data is divided into 100 sec bins |
 |
|
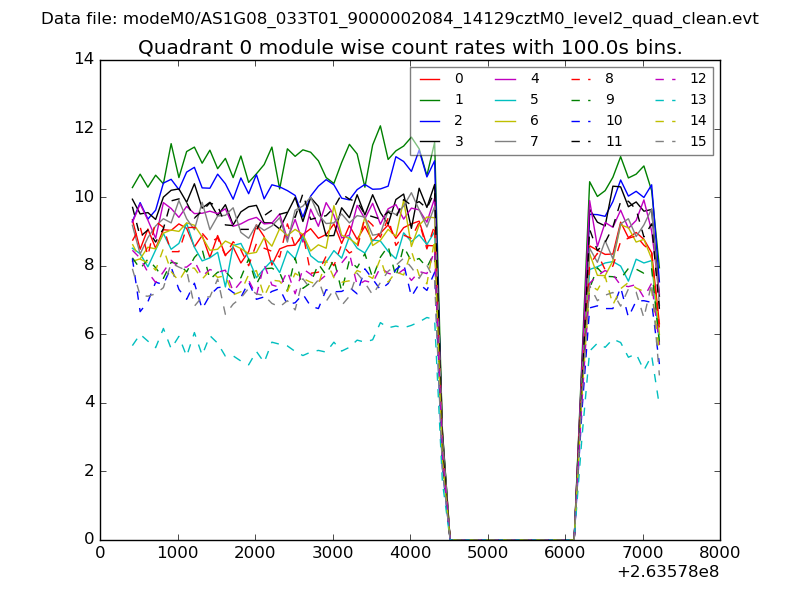
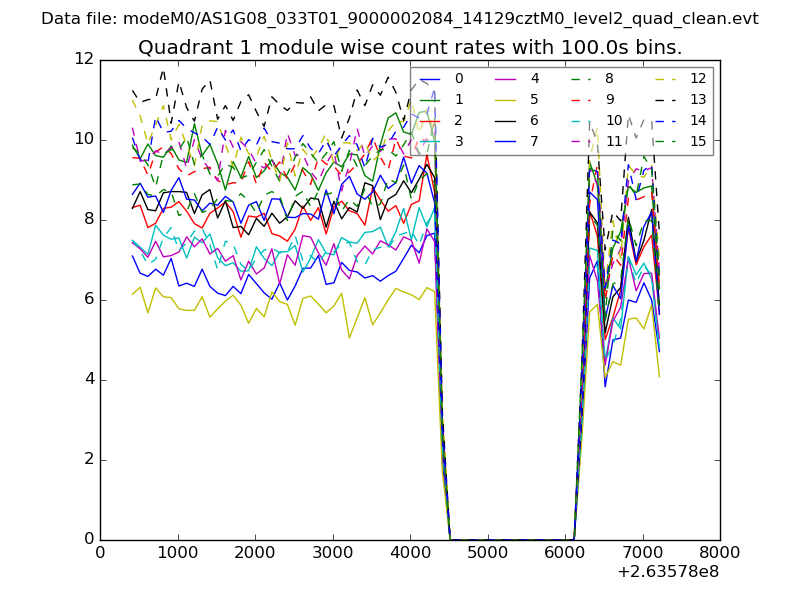
| Module-wise count rates for Quadrant A Data is divided into 100 sec bins |
 |
 |
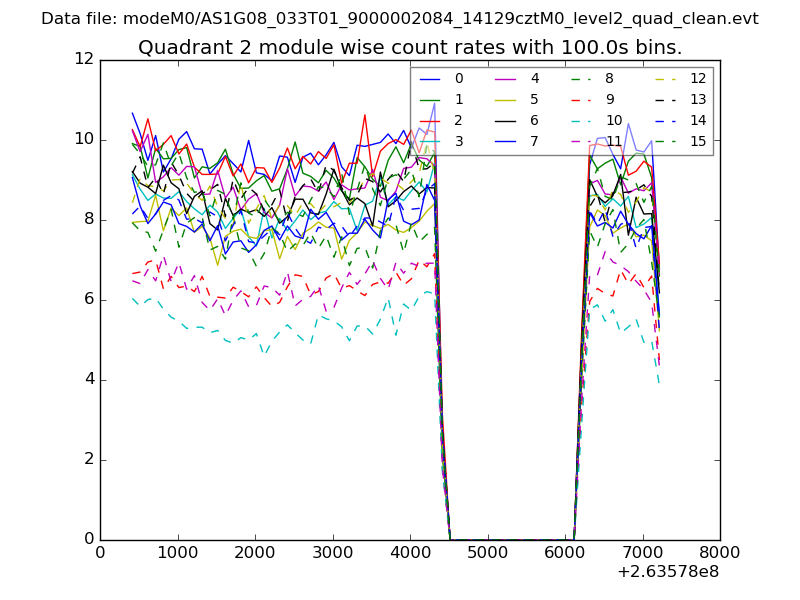
| Module-wise count rates for Quadrant B Data is divided into 100 sec bins |
 |
 |
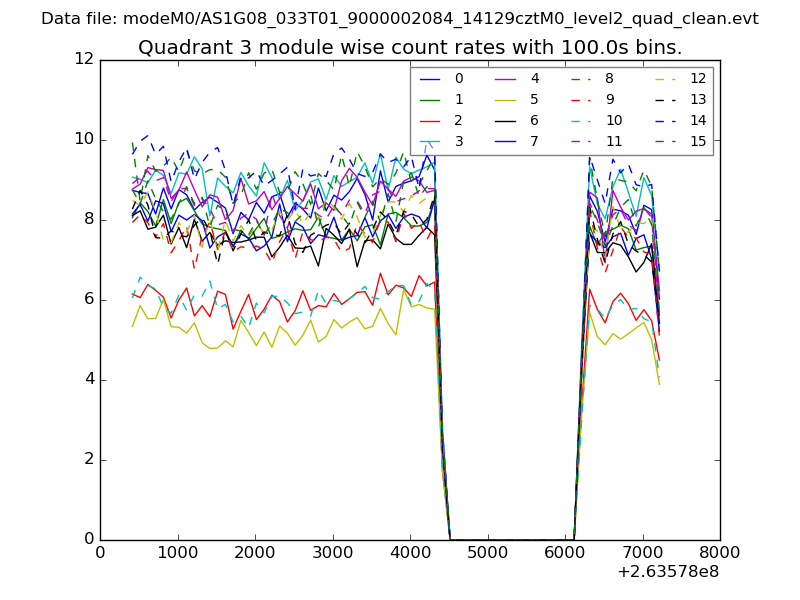
| Module-wise count rates for Quadrant C Data is divided into 100 sec bins |
 |
 |
| Module-wise count rates for Quadrant D Data is divided into 100 sec bins |
 |
 |
| Parameter | Plot |
|---|---|
| CZT HV Monitor | 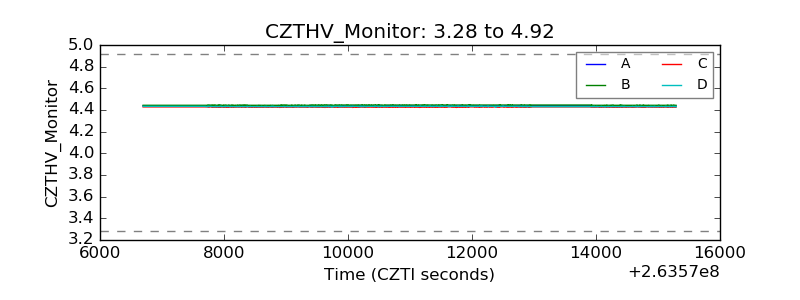 |
| D_VDD | 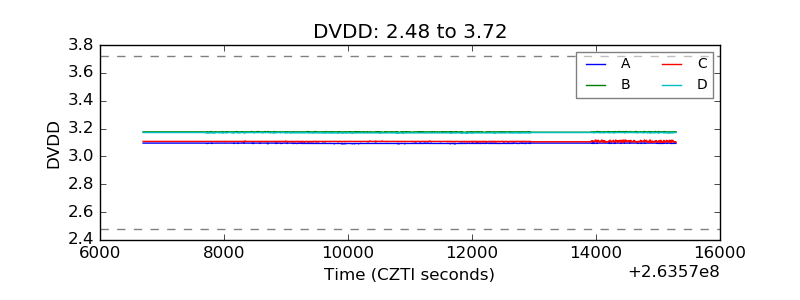 |
| Temperature 1 | 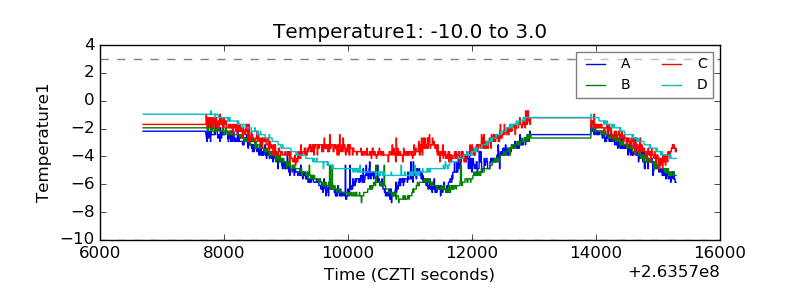 |
| Veto HV Monitor | 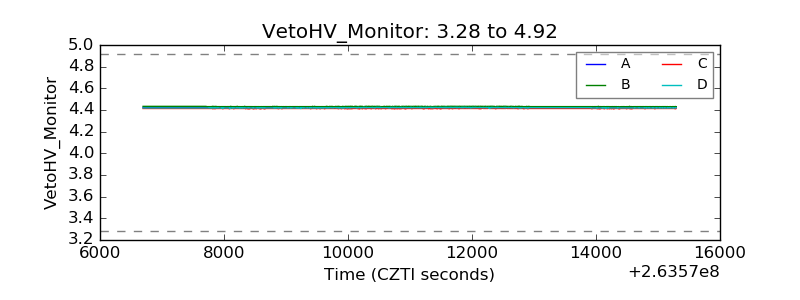 |
| Veto LLD | 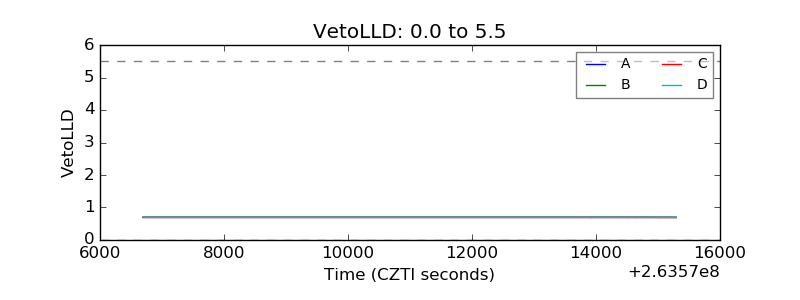 |
| Alpha Counter | 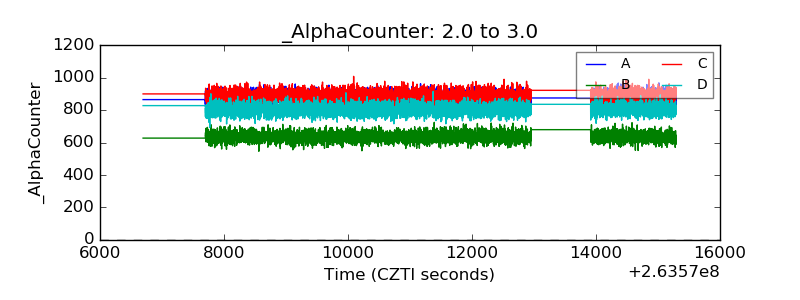 |
| _CPM_Rate |  |
| CZT Counter | 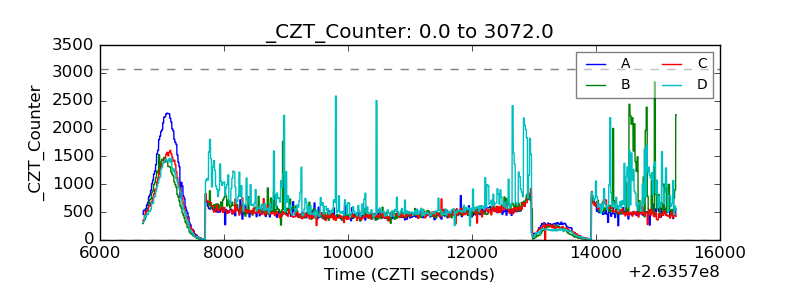 |
| +2.5 Volts monitor |  |
| +5 Volts monitor |  |
| _ROLL_ROT | 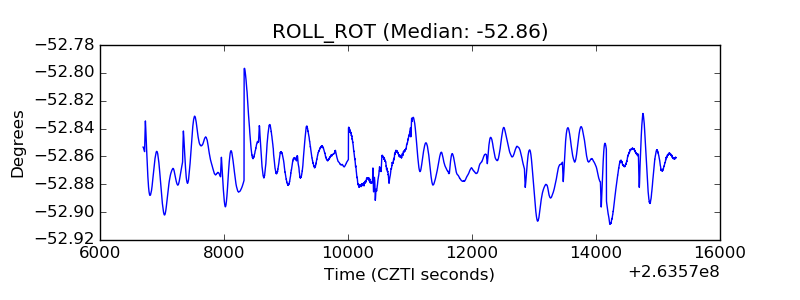 |
| _Roll_DEC | 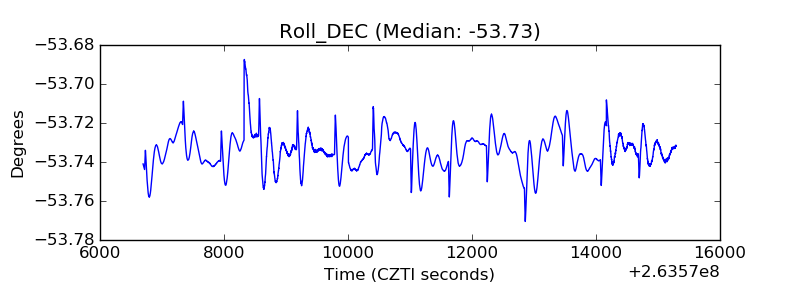 |
| _Roll_RA | 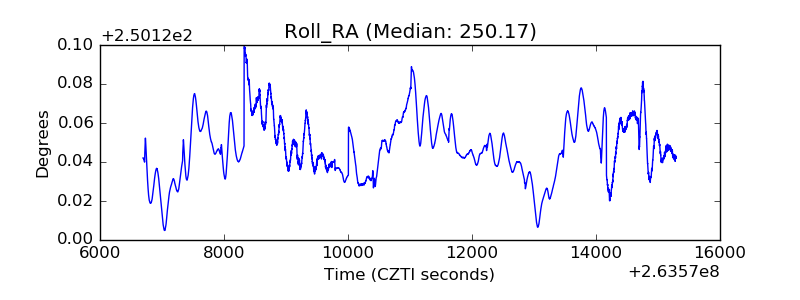 |
| Veto Counter | 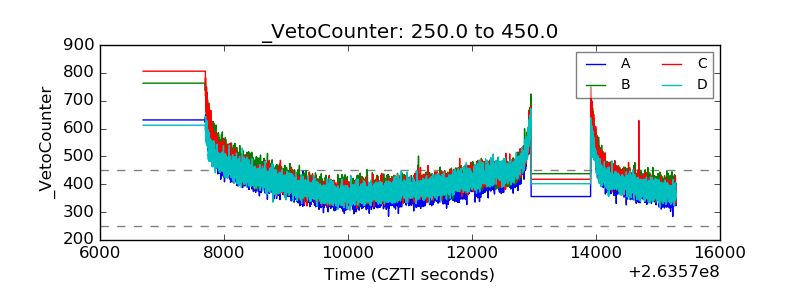 |