| Param | Original file | Final file |
|---|---|---|
| Filename | modeM0/AS1A04_224T05_9000002088cztM0_level2.fits | modeM0/AS1A04_224T05_9000002088cztM0_level2_quad_clean.evt |
| Size (bytes) | 194,267,520 | 166,875,840 |
| Size | 185.3 MB | 159.1 MB |
| Events in quadrant A | 1,178,668 | 947,923 |
| Events in quadrant B | 1,135,986 | 953,301 |
| Events in quadrant C | 1,178,852 | 954,459 |
| Events in quadrant D | 991,658 | 799,447 |
| Mode M0 | |||
|---|---|---|---|
| Quadrant | BADHDUFLAG | Total packets | Discarded packets |
| A | 0 | 42801 | 0 |
| B | 0 | 42834 | 0 |
| C | 0 | 43169 | 0 |
| D | 0 | 56611 | 0 |
| Mode M9 | |||
|---|---|---|---|
| Quadrant | BADHDUFLAG | Total packets | Discarded packets |
| A | 0 | 14 | 0 |
| B | 0 | 14 | 0 |
| C | 0 | 14 | 0 |
| D | 0 | 14 | 0 |
| Mode SS | |||
|---|---|---|---|
| Quadrant | BADHDUFLAG | Total packets | Discarded packets |
| A | 0 | 418 | 0 |
| B | 0 | 418 | 0 |
| C | 0 | 418 | 0 |
| D | 0 | 418 | 0 |
| Quadrant | Total seconds | Saturated seconds | Saturation percentage |
|---|---|---|---|
| A | 20283 | 255 | 1.257210% |
| B | 20283 | 382 | 1.883351% |
| C | 20283 | 225 | 1.109303% |
| D | 20283 | 1392 | 6.862890% |
Noise dominated data is calculated using 1-second bins in cleaned event files. If a bin has >2000 counts, and if more than 50% of those come from <1% of pixels, then it is considered to be noise-dominated and hence unusable.
| Quadrant | # 1 sec bins | Bins with >0 counts | Bins with >2000 counts | High rate bins dominated by noise | Noise dominated (total time) | Noise dominated (detector-on time) | Marked lightcurve |
|---|---|---|---|---|---|---|---|
| A | 21878 | 20283 | 0 | 0 | 0.00% | 0.00% | 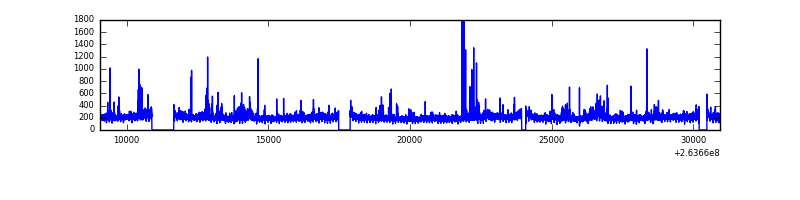 |
| B | 21878 | 20283 | 0 | 0 | 0.00% | 0.00% | 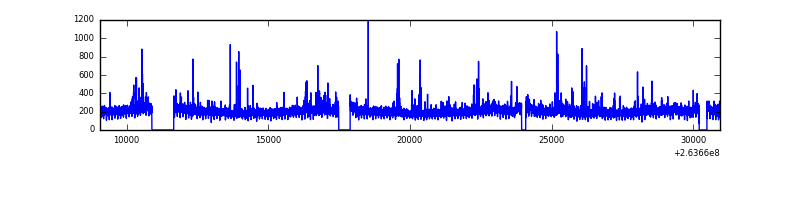 |
| C | 21878 | 20283 | 0 | 0 | 0.00% | 0.00% |  |
| D | 21878 | 20271 | 0 | 0 | 0.00% | 0.00% | 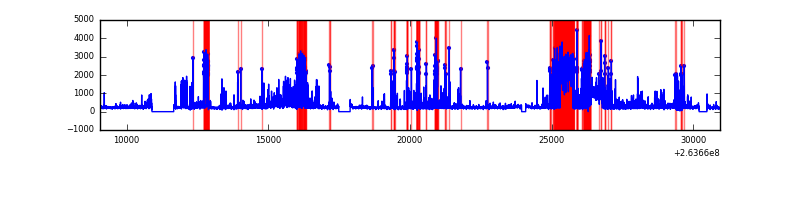 |
Top three noisy pixels from each quadrant. If the there are fewer than three noisy pixels in the level2.evt file, extra rows are filled as -1
| Pixel properties | Quadrant properties | ||||||
|---|---|---|---|---|---|---|---|
| Quadrant | DetID | PixID | Counts | Sigma | Mean | Median | Sigma |
| A | 0 | 29 | 1090 | 10.37 | 306 | 285 | 77.6 |
| A | 7 | 110 | 966 | 8.78 | 306 | 285 | 77.6 |
| A | 0 | 30 | 848 | 7.25 | 306 | 285 | 77.6 |
| B | 2 | 9 | 910 | 9.86 | 299 | 284 | 63.5 |
| B | 2 | 8 | 760 | 7.5 | 299 | 284 | 63.5 |
| B | 3 | 17 | 742 | 7.22 | 299 | 284 | 63.5 |
| C | 1 | 80 | 907 | 7.44 | 310 | 287 | 83.3 |
| C | 1 | 81 | 898 | 7.34 | 310 | 287 | 83.3 |
| C | 12 | 250 | 877 | 7.08 | 310 | 287 | 83.3 |
| D | 4 | 246 | 758 | 6.42 | 282 | 256 | 78.2 |
| D | 3 | 14 | 751 | 6.33 | 282 | 256 | 78.2 |
| D | 6 | 231 | 714 | 5.86 | 282 | 256 | 78.2 |
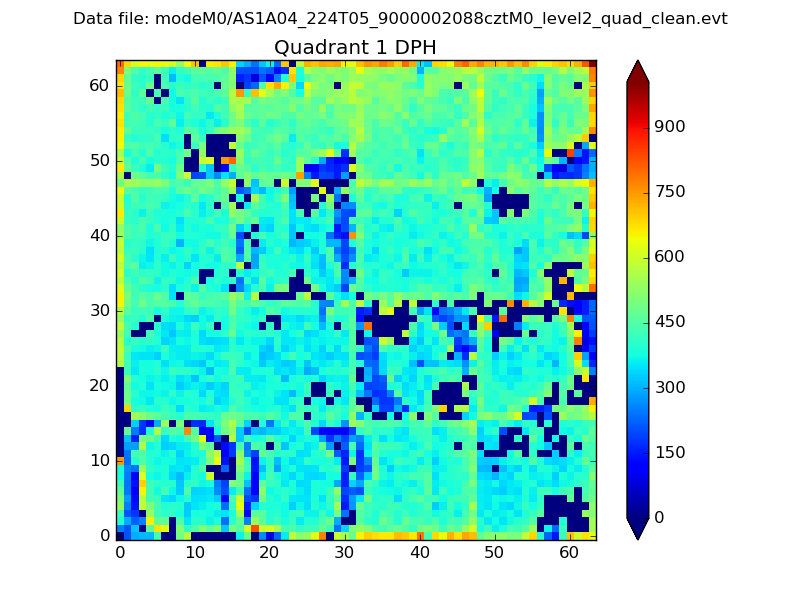
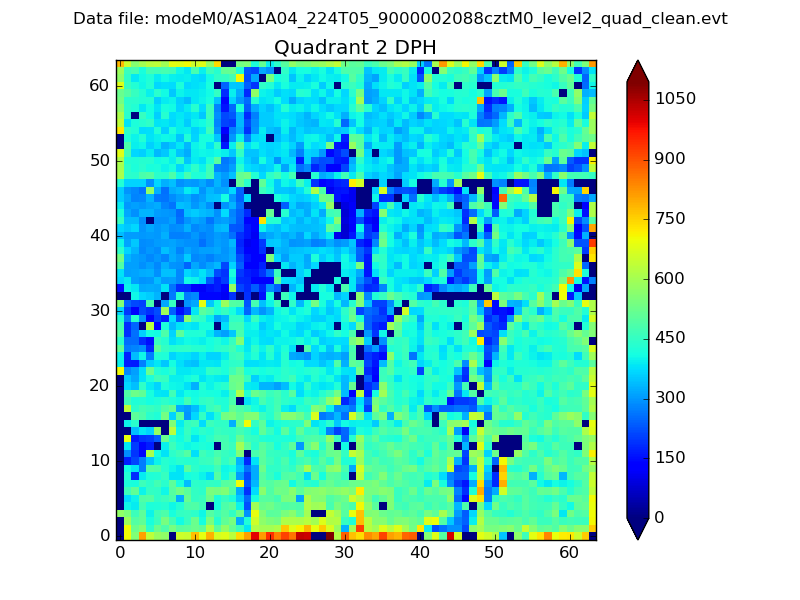
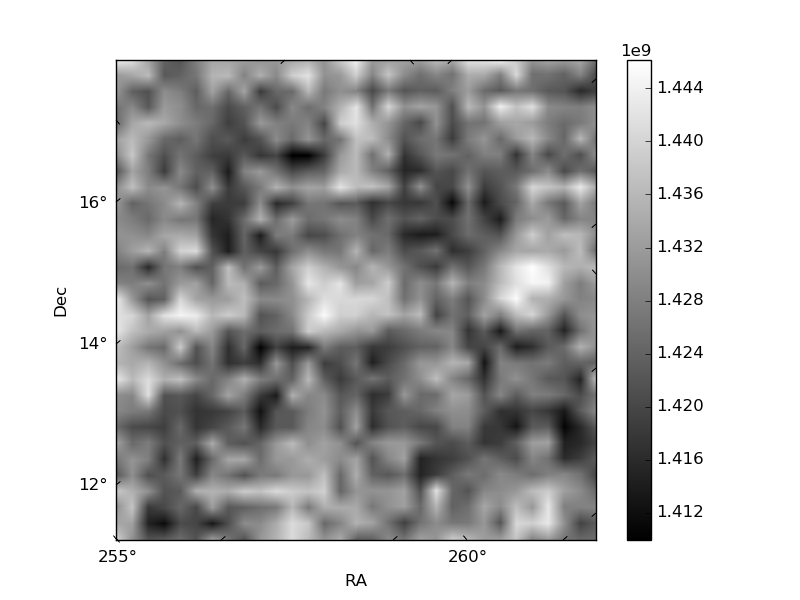
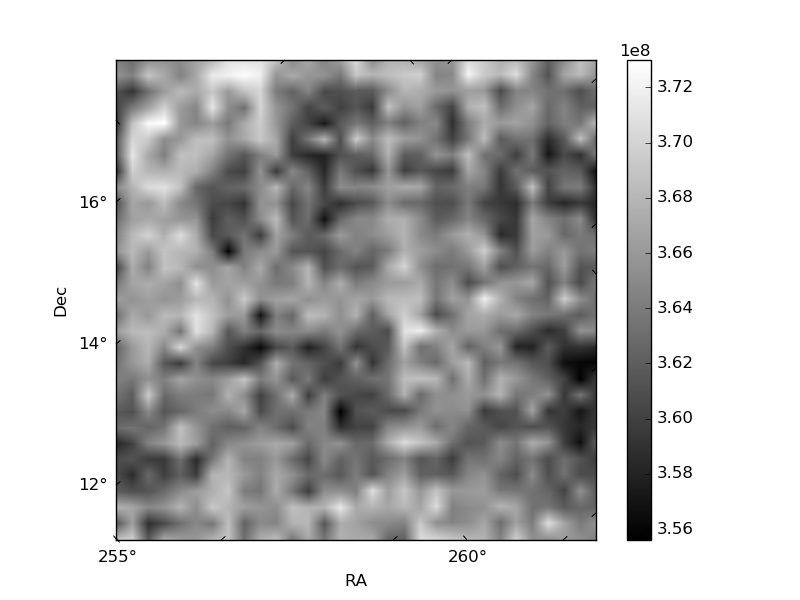
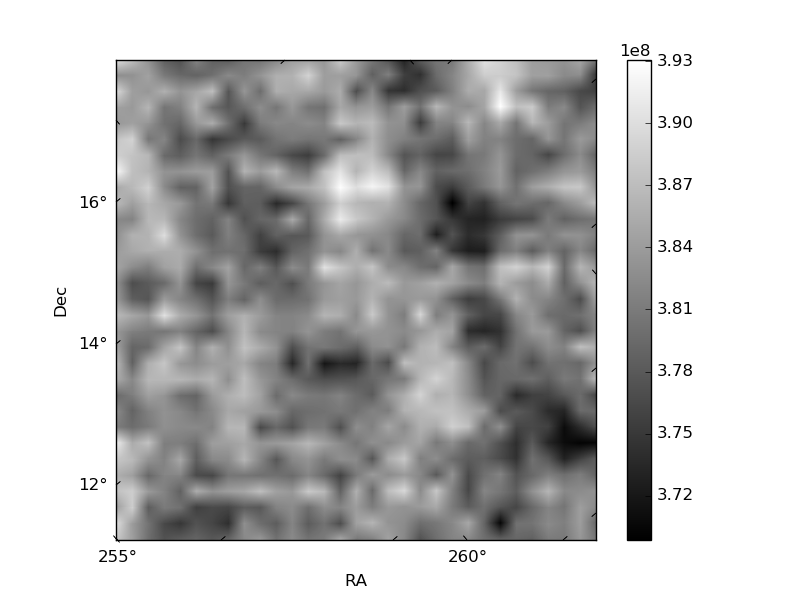
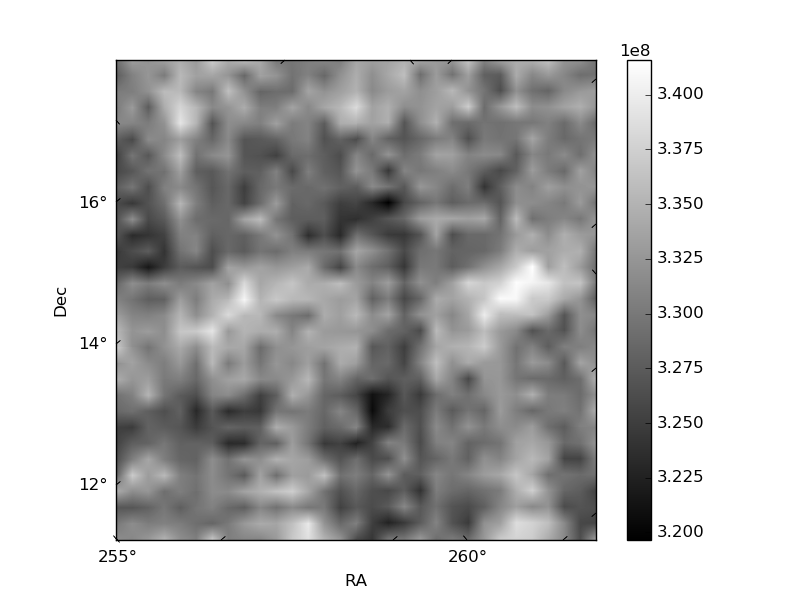
Histogram calculated using DETX and DETY for each event in the final _common_clean file
| Quadrant A | 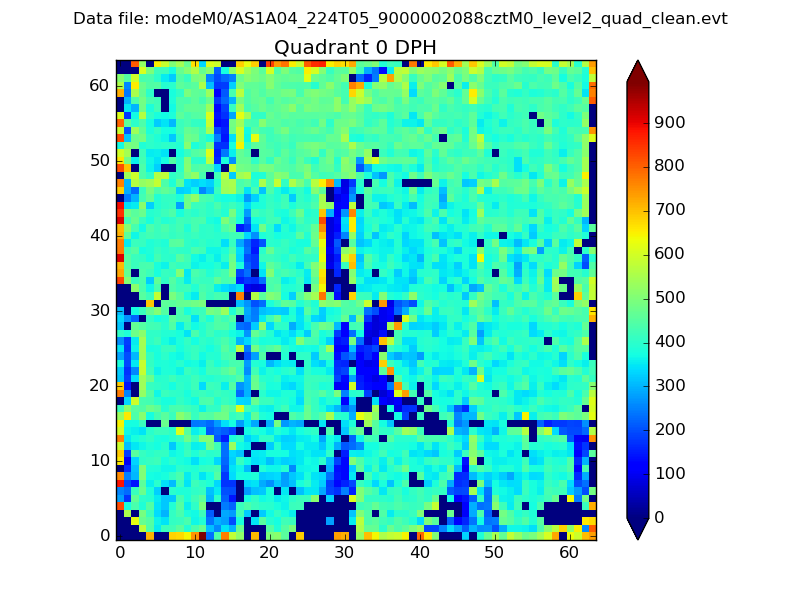 |
 |
Quadrant B |
|---|---|---|---|
| Quadrant D | 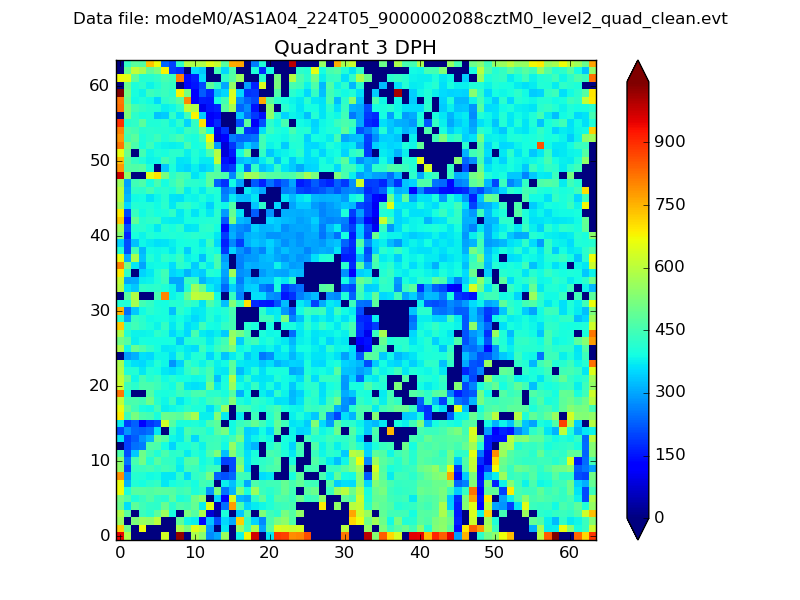 |
 |
Quadrant C |
| Plot type | Count rate plots | Images |
|---|---|---|
| Comparison with Poisson distribution Blue bars denote a histogram of data divided into 1 sec bins. Red curve is a Poisson curve with rate = median count rate of data. |
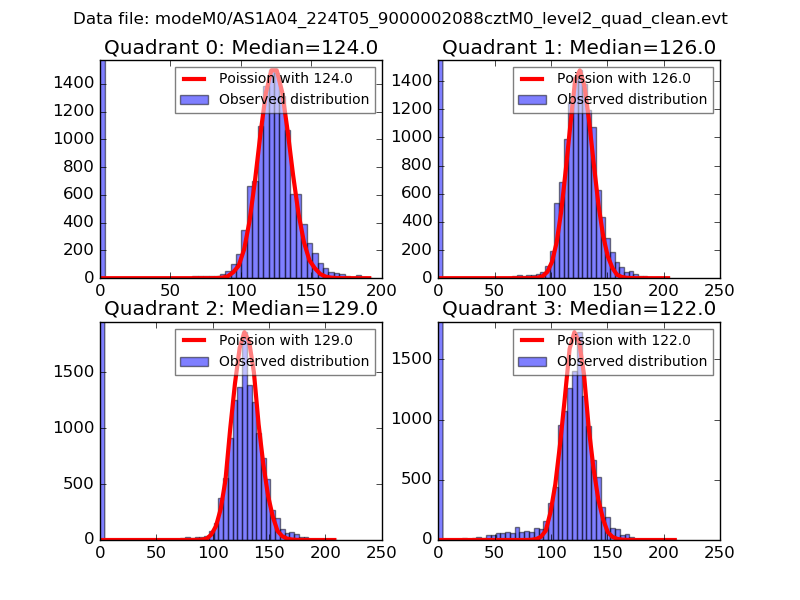 |
 |
| Quadrant-wise count rates Data is divided into 100 sec bins |
 |
|
| Module-wise count rates for Quadrant A Data is divided into 100 sec bins |
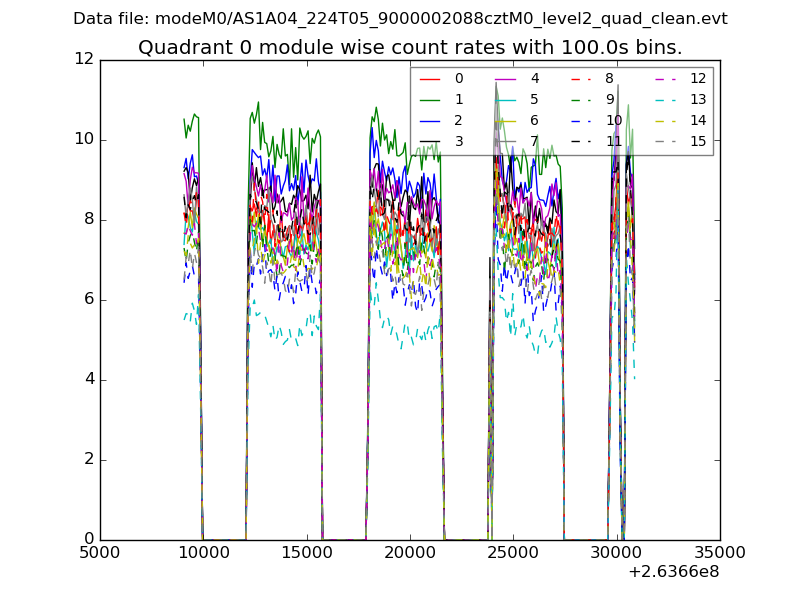 |
 |
| Module-wise count rates for Quadrant B Data is divided into 100 sec bins |
 |
 |
| Module-wise count rates for Quadrant C Data is divided into 100 sec bins |
 |
 |
| Module-wise count rates for Quadrant D Data is divided into 100 sec bins |
 |
 |
| Parameter | Plot |
|---|---|
| CZT HV Monitor | 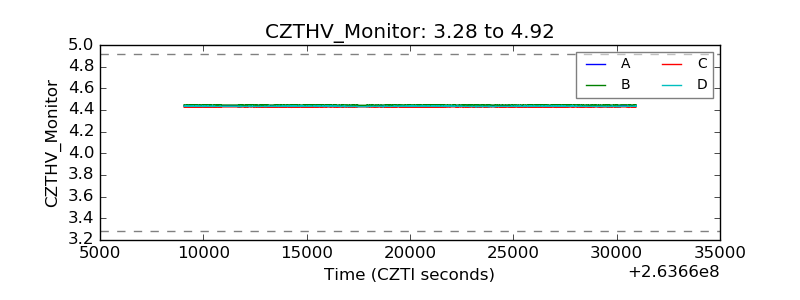 |
| D_VDD | 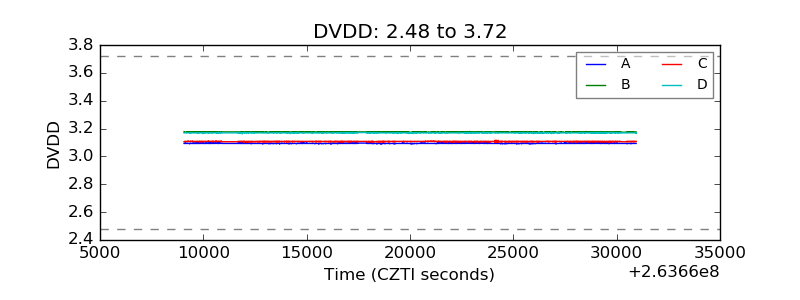 |
| Temperature 1 |  |
| Veto HV Monitor | 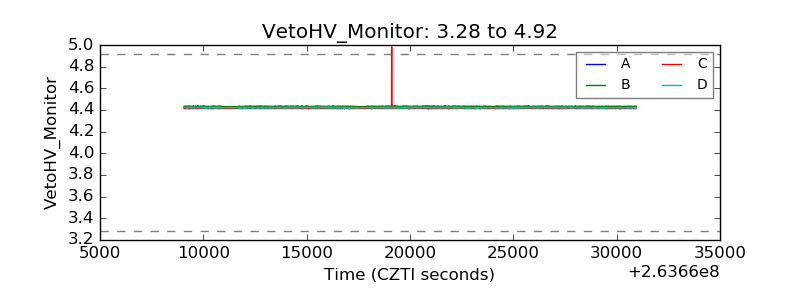 |
| Veto LLD |  |
| Alpha Counter |  |
| _CPM_Rate | 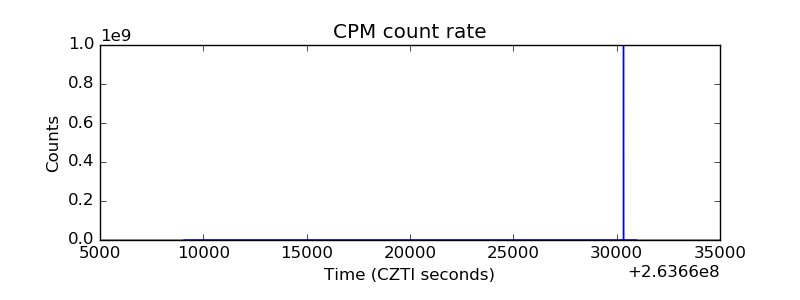 |
| CZT Counter | 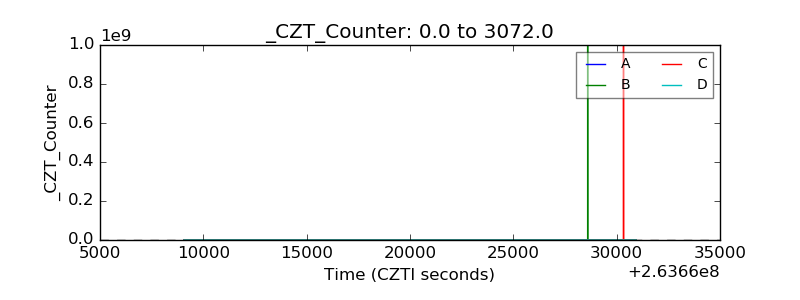 |
| +2.5 Volts monitor |  |
| +5 Volts monitor |  |
| _ROLL_ROT |  |
| _Roll_DEC | 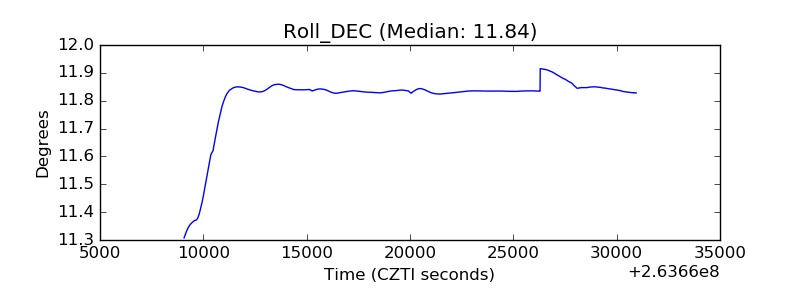 |
| _Roll_RA | 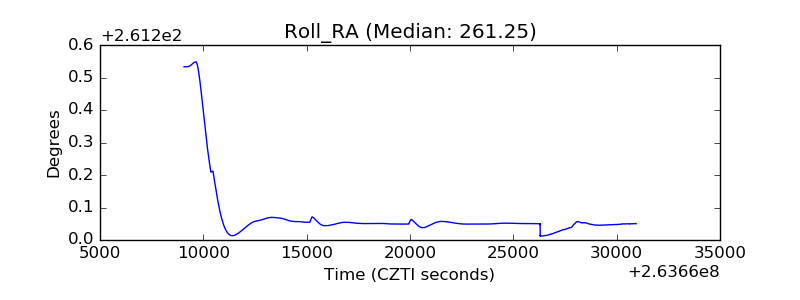 |
| Veto Counter | 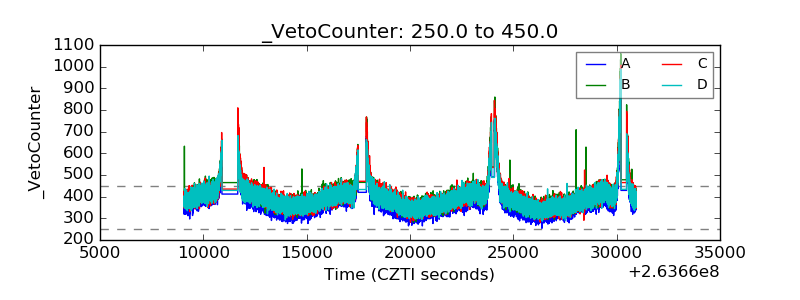 |