| Param | Original file | Final file |
|---|---|---|
| Filename | modeM0/AS1A04_224T05_9000002088_14144cztM0_level2.evt | modeM0/AS1A04_224T05_9000002088_14144cztM0_level2_quad_clean.evt |
| Size (bytes) | 252,092,160 | 37,362,240 |
| Size | 240.4 MB | 35.6 MB |
| Events in quadrant A | 1,702,388 | 224,227 |
| Events in quadrant B | 1,689,253 | 228,848 |
| Events in quadrant C | 1,805,075 | 232,002 |
| Events in quadrant D | 2,216,351 | 215,775 |
| Mode M0 | |||
|---|---|---|---|
| Quadrant | BADHDUFLAG | Total packets | Discarded packets |
| A | 0 | 6982 | 2 |
| B | 0 | 6932 | 1 |
| C | 0 | 7134 | 1 |
| D | 0 | 8586 | 1 |
| Mode M9 | |||
|---|---|---|---|
| Quadrant | BADHDUFLAG | Total packets | Discarded packets |
| A | 0 | 7 | 0 |
| B | 0 | 7 | 0 |
| C | 0 | 7 | 0 |
| D | 0 | 7 | 0 |
| Mode SS | |||
|---|---|---|---|
| Quadrant | BADHDUFLAG | Total packets | Discarded packets |
| A | 0 | 68 | 0 |
| B | 0 | 68 | 0 |
| C | 0 | 68 | 0 |
| D | 0 | 68 | 0 |
| Quadrant | Total seconds | Saturated seconds | Saturation percentage |
|---|---|---|---|
| A | 3232 | 53 | 1.639851% |
| B | 3232 | 73 | 2.258663% |
| C | 3232 | 60 | 1.856436% |
| D | 3232 | 247 | 7.642327% |
Noise dominated data is calculated using 1-second bins in cleaned event files. If a bin has >2000 counts, and if more than 50% of those come from <1% of pixels, then it is considered to be noise-dominated and hence unusable.
| Quadrant | # 1 sec bins | Bins with >0 counts | Bins with >2000 counts | High rate bins dominated by noise | Noise dominated (total time) | Noise dominated (detector-on time) | Marked lightcurve |
|---|---|---|---|---|---|---|---|
| A | 4003 | 3234 | 0 | 0 | 0.00% | 0.00% | 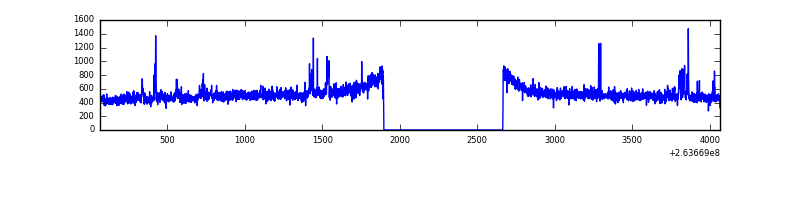 |
| B | 4003 | 3234 | 0 | 0 | 0.00% | 0.00% | 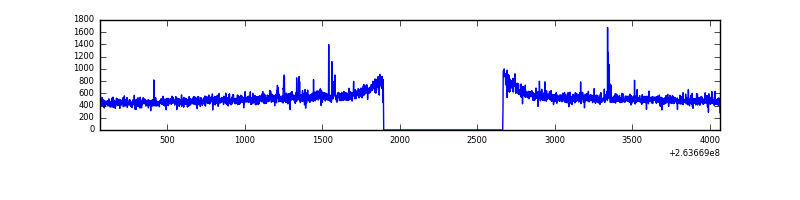 |
| C | 4003 | 3234 | 0 | 0 | 0.00% | 0.00% | 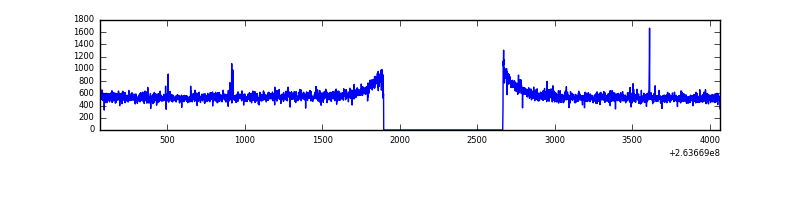 |
| D | 4003 | 3234 | 150 | 150 | 3.75% | 4.64% | 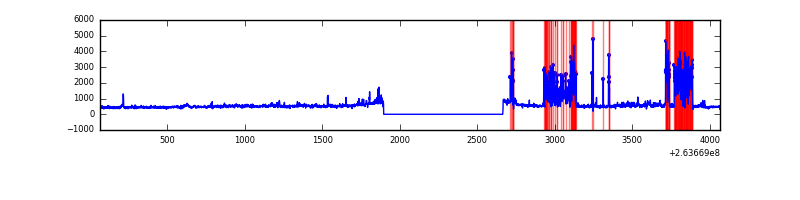 |
Top three noisy pixels from each quadrant. If the there are fewer than three noisy pixels in the level2.evt file, extra rows are filled as -1
| Pixel properties | Quadrant properties | ||||||
|---|---|---|---|---|---|---|---|
| Quadrant | DetID | PixID | Counts | Sigma | Mean | Median | Sigma |
| A | 12 | 189 | 30983 | 347.17 | 426 | 416 | 88.0 |
| A | 9 | 143 | 26586 | 297.23 | 426 | 416 | 88.0 |
| A | 0 | 226 | 3769 | 38.08 | 426 | 416 | 88.0 |
| B | 0 | 189 | 12480 | 144.58 | 423 | 412 | 83.5 |
| B | 12 | 111 | 9934 | 114.08 | 423 | 412 | 83.5 |
| B | 11 | 111 | 8572 | 97.76 | 423 | 412 | 83.5 |
| C | 3 | 233 | 181378 | 1837.2 | 414 | 416 | 98.5 |
| C | 10 | 22 | 6875 | 65.57 | 414 | 416 | 98.5 |
| C | 13 | 61 | 3016 | 26.4 | 414 | 416 | 98.5 |
| D | 1 | 52 | 317505 | 3250.19 | 404 | 393 | 97.6 |
| D | 7 | 80 | 279739 | 2863.11 | 404 | 393 | 97.6 |
| D | 2 | 14 | 27303 | 275.81 | 404 | 393 | 97.6 |
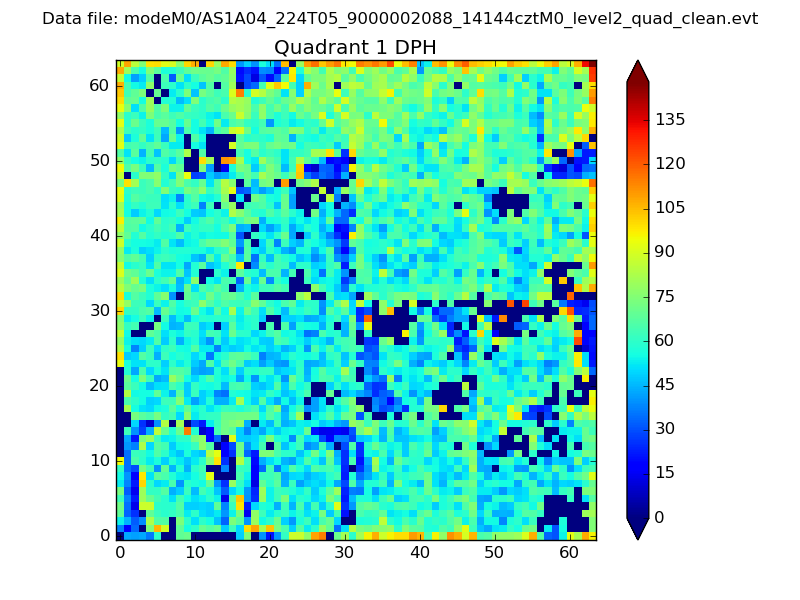
Histogram calculated using DETX and DETY for each event in the final _common_clean file
| Quadrant A |  |
 |
Quadrant B |
|---|---|---|---|
| Quadrant D | 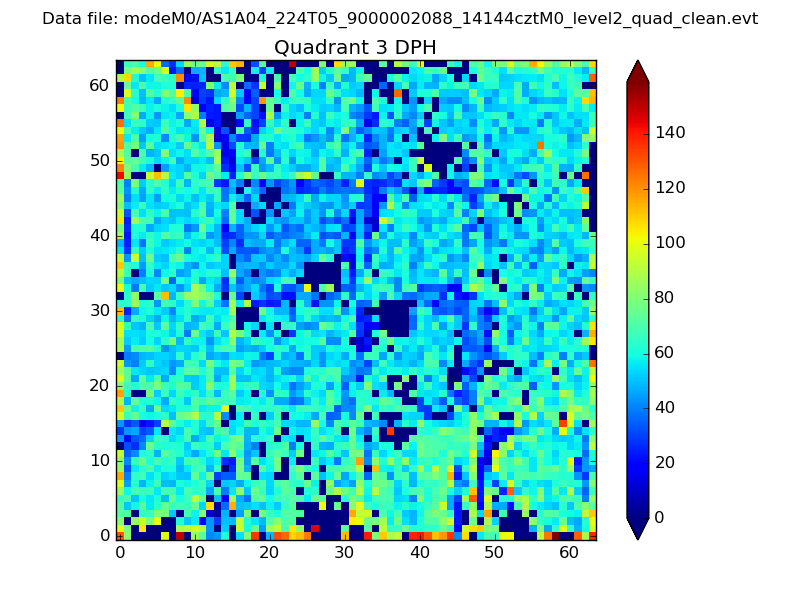 |
 |
Quadrant C |
| Plot type | Count rate plots | Images |
|---|---|---|
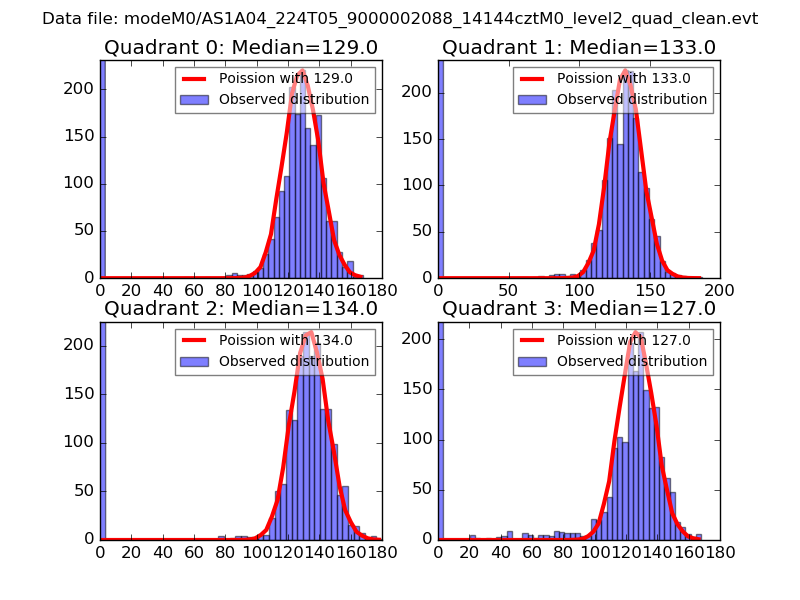
| Comparison with Poisson distribution Blue bars denote a histogram of data divided into 1 sec bins. Red curve is a Poisson curve with rate = median count rate of data. |
 |
 |
| Quadrant-wise count rates Data is divided into 100 sec bins |
 |
|
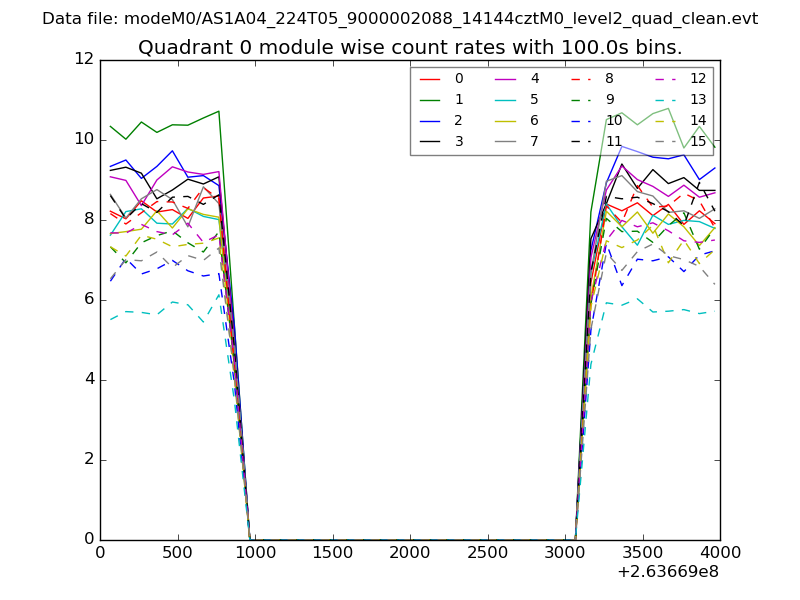
| Module-wise count rates for Quadrant A Data is divided into 100 sec bins |
 |
 |
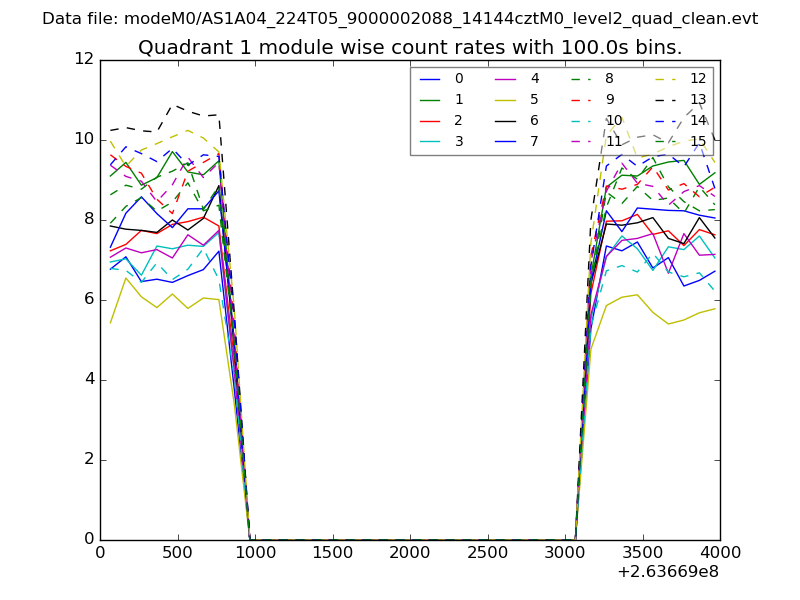
| Module-wise count rates for Quadrant B Data is divided into 100 sec bins |
 |
 |
| Module-wise count rates for Quadrant C Data is divided into 100 sec bins |
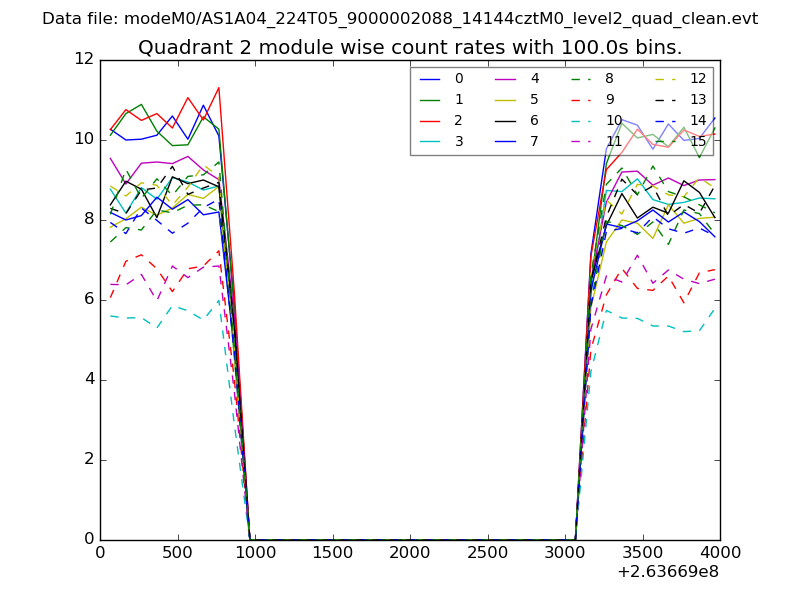 |
 |
| Module-wise count rates for Quadrant D Data is divided into 100 sec bins |
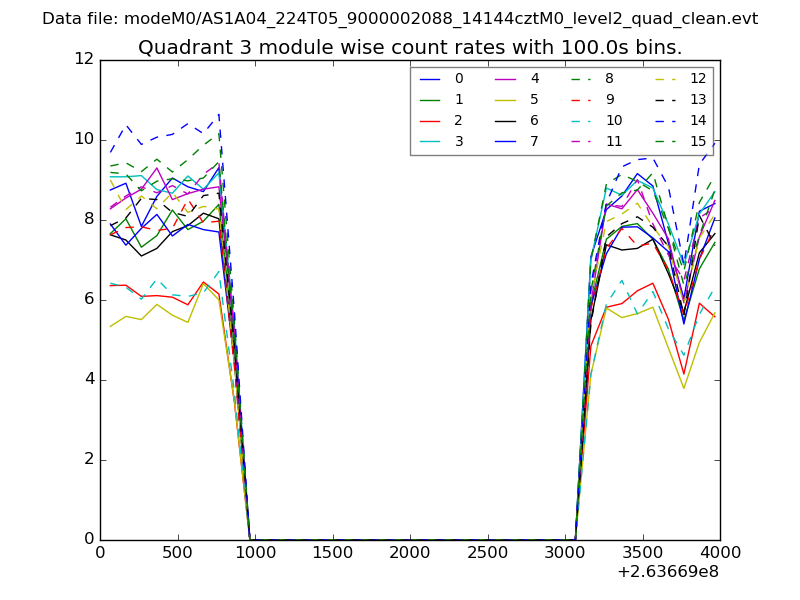 |
 |
| Parameter | Plot |
|---|---|
| CZT HV Monitor | 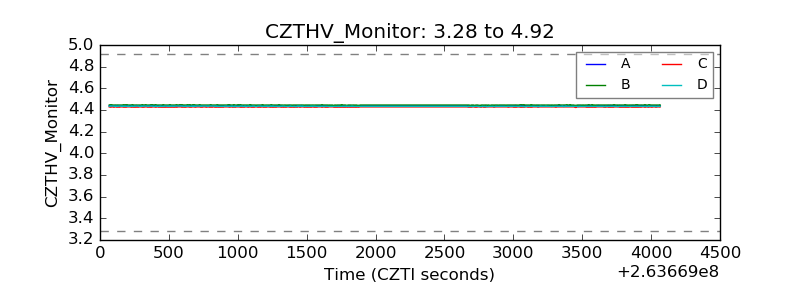 |
| D_VDD | 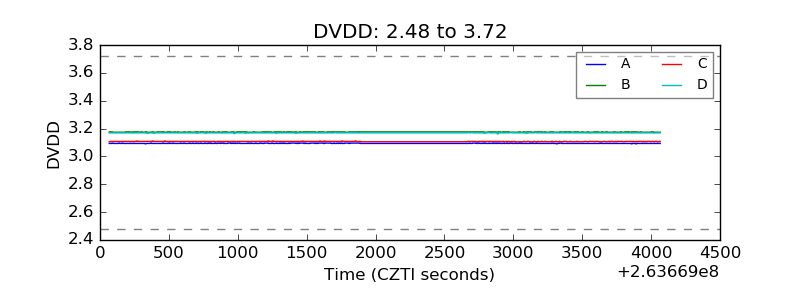 |
| Temperature 1 | 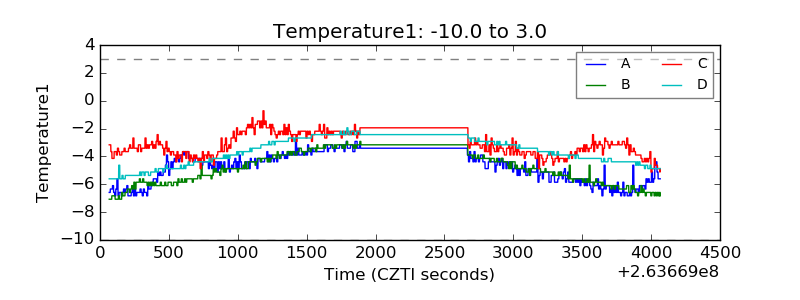 |
| Veto HV Monitor | 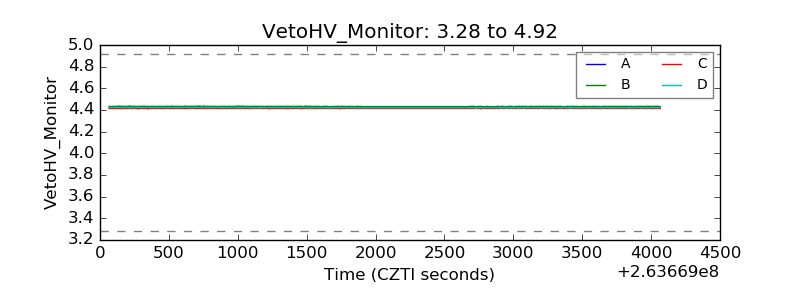 |
| Veto LLD | 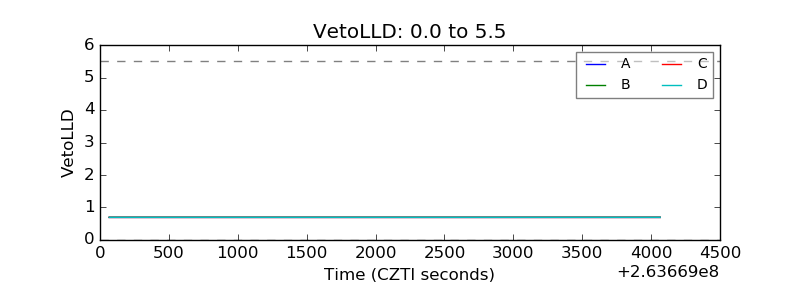 |
| Alpha Counter | 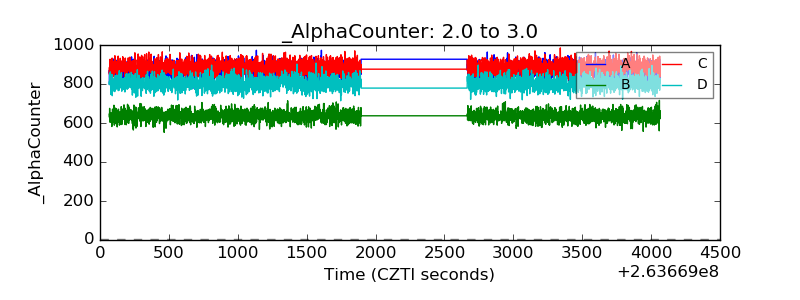 |
| _CPM_Rate | 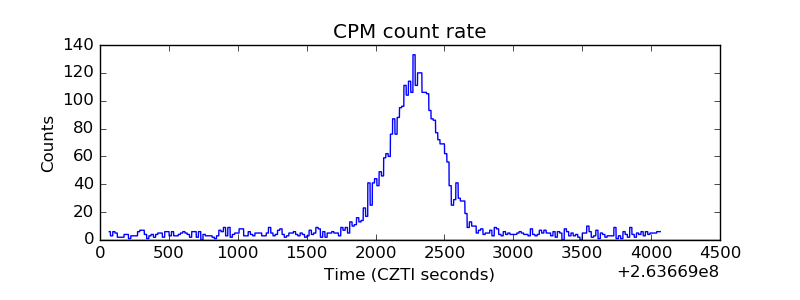 |
| CZT Counter |  |
| +2.5 Volts monitor |  |
| +5 Volts monitor |  |
| _ROLL_ROT | 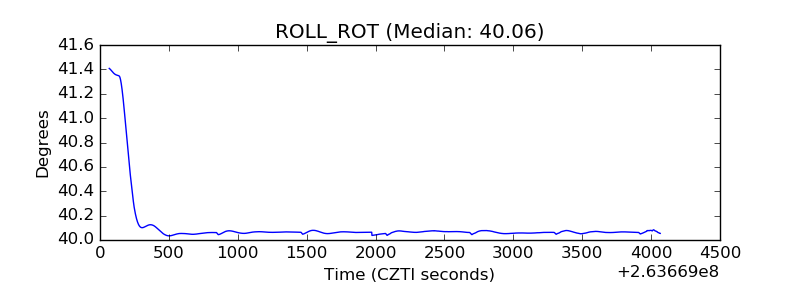 |
| _Roll_DEC | 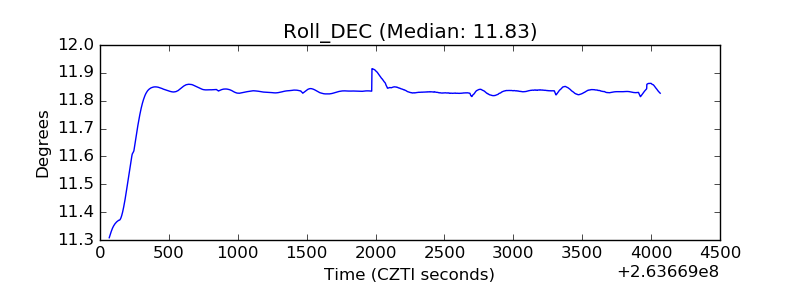 |
| _Roll_RA |  |
| Veto Counter | 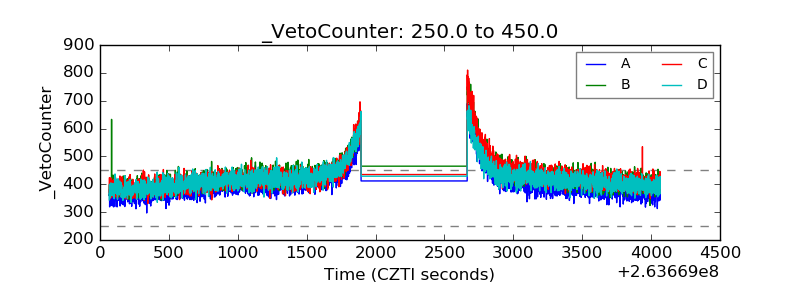 |