| Param | Original file | Final file |
|---|---|---|
| Filename | modeM0/AS1A04_224T05_9000002088_14146cztM0_level2.evt | modeM0/AS1A04_224T05_9000002088_14146cztM0_level2_quad_clean.evt |
| Size (bytes) | 658,434,240 | 107,513,280 |
| Size | 627.9 MB | 102.5 MB |
| Events in quadrant A | 4,304,788 | 662,735 |
| Events in quadrant B | 4,380,422 | 672,727 |
| Events in quadrant C | 4,557,768 | 688,395 |
| Events in quadrant D | 6,109,531 | 629,139 |
| Mode M0 | |||
|---|---|---|---|
| Quadrant | BADHDUFLAG | Total packets | Discarded packets |
| A | 0 | 18461 | 3 |
| B | 0 | 18565 | 2 |
| C | 0 | 18568 | 2 |
| D | 0 | 23719 | 2 |
| Mode M9 | |||
|---|---|---|---|
| Quadrant | BADHDUFLAG | Total packets | Discarded packets |
| A | 0 | 5 | 0 |
| B | 0 | 5 | 0 |
| C | 0 | 5 | 0 |
| D | 0 | 5 | 0 |
| Mode SS | |||
|---|---|---|---|
| Quadrant | BADHDUFLAG | Total packets | Discarded packets |
| A | 0 | 178 | 0 |
| B | 0 | 178 | 0 |
| C | 0 | 178 | 0 |
| D | 0 | 178 | 0 |
| Quadrant | Total seconds | Saturated seconds | Saturation percentage |
|---|---|---|---|
| A | 8680 | 94 | 1.082949% |
| B | 8680 | 173 | 1.993088% |
| C | 8680 | 71 | 0.817972% |
| D | 8680 | 634 | 7.304147% |
Noise dominated data is calculated using 1-second bins in cleaned event files. If a bin has >2000 counts, and if more than 50% of those come from <1% of pixels, then it is considered to be noise-dominated and hence unusable.
| Quadrant | # 1 sec bins | Bins with >0 counts | Bins with >2000 counts | High rate bins dominated by noise | Noise dominated (total time) | Noise dominated (detector-on time) | Marked lightcurve |
|---|---|---|---|---|---|---|---|
| A | 9231 | 8683 | 5 | 5 | 0.05% | 0.06% | 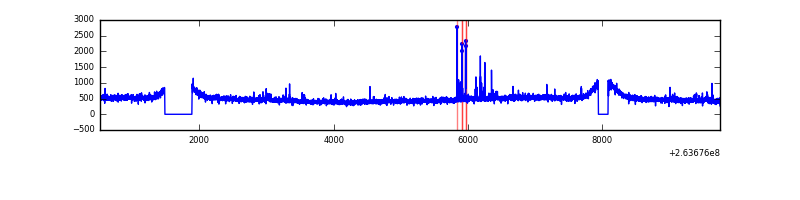 |
| B | 9231 | 8683 | 1 | 1 | 0.01% | 0.01% | 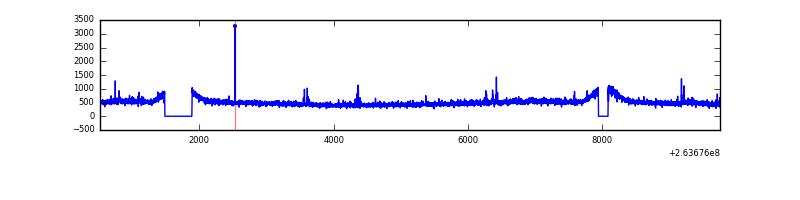 |
| C | 9231 | 8683 | 0 | 0 | 0.00% | 0.00% | 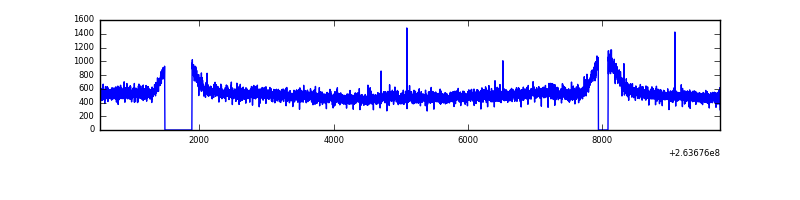 |
| D | 9231 | 8683 | 567 | 567 | 6.14% | 6.53% | 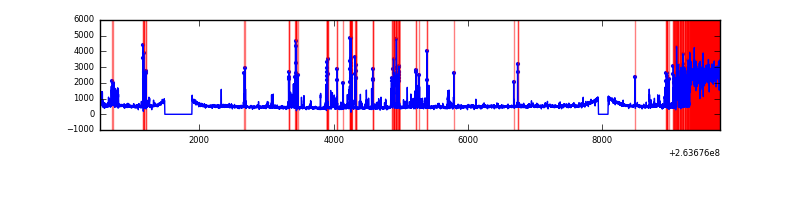 |
Top three noisy pixels from each quadrant. If the there are fewer than three noisy pixels in the level2.evt file, extra rows are filled as -1
| Pixel properties | Quadrant properties | ||||||
|---|---|---|---|---|---|---|---|
| Quadrant | DetID | PixID | Counts | Sigma | Mean | Median | Sigma |
| A | 12 | 96 | 54825 | 240.13 | 1091 | 1066 | 223.9 |
| A | 12 | 189 | 30574 | 131.8 | 1091 | 1066 | 223.9 |
| A | 8 | 15 | 20187 | 85.41 | 1091 | 1066 | 223.9 |
| B | 0 | 214 | 44341 | 202.89 | 1093 | 1063 | 213.3 |
| B | 12 | 111 | 26288 | 118.26 | 1093 | 1063 | 213.3 |
| B | 11 | 111 | 22394 | 100.0 | 1093 | 1063 | 213.3 |
| C | 3 | 233 | 364703 | 1425.42 | 1075 | 1079 | 255.1 |
| C | 13 | 61 | 7519 | 25.24 | 1075 | 1079 | 255.1 |
| C | 14 | 234 | 4094 | 11.82 | 1075 | 1079 | 255.1 |
| D | 1 | 52 | 1911788 | 7658.89 | 1044 | 1018 | 249.5 |
| D | 8 | 195 | 110574 | 439.13 | 1044 | 1018 | 249.5 |
| D | 7 | 80 | 59565 | 234.67 | 1044 | 1018 | 249.5 |
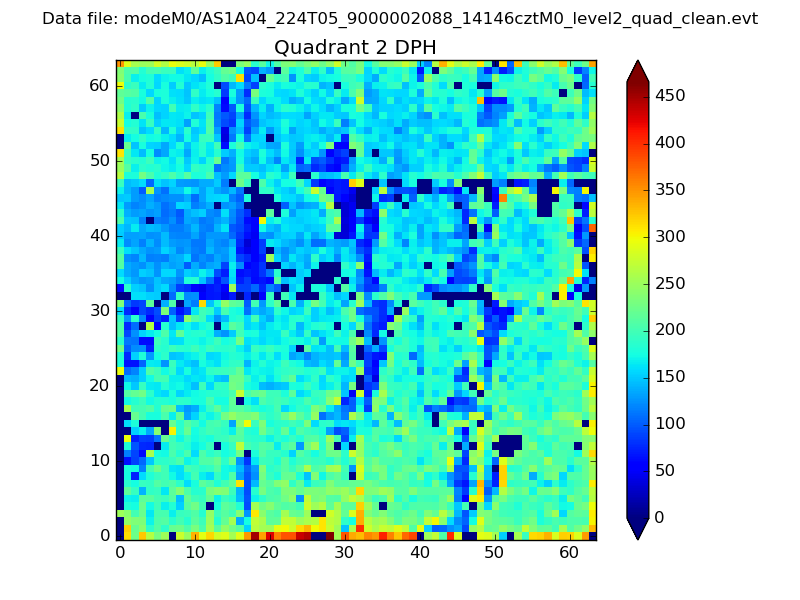
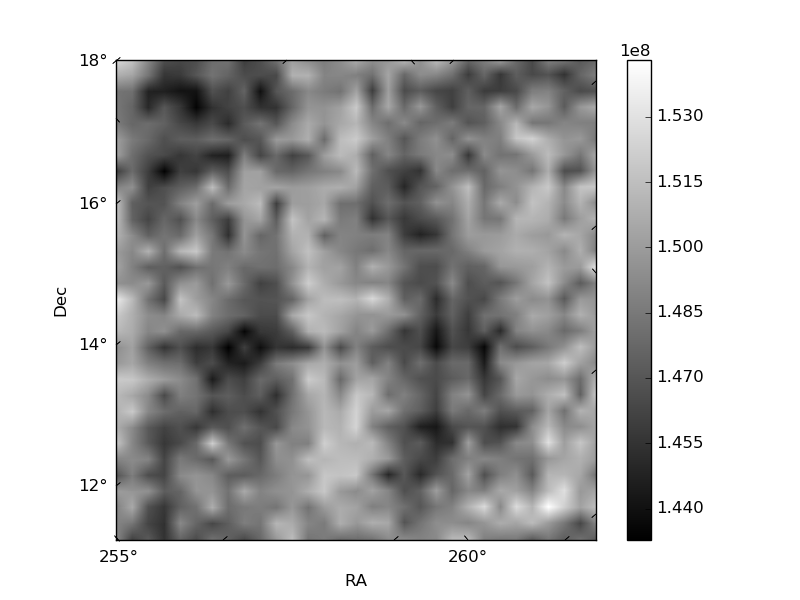
Histogram calculated using DETX and DETY for each event in the final _common_clean file
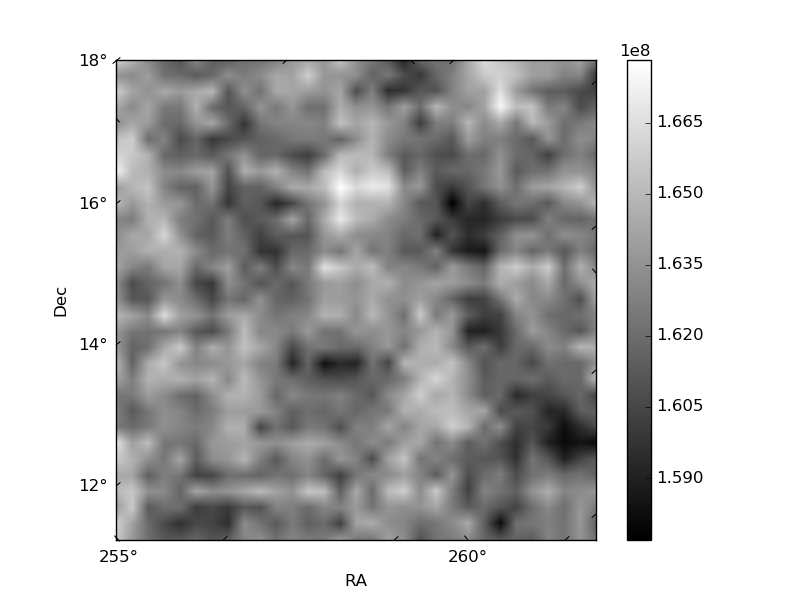
| Quadrant A | 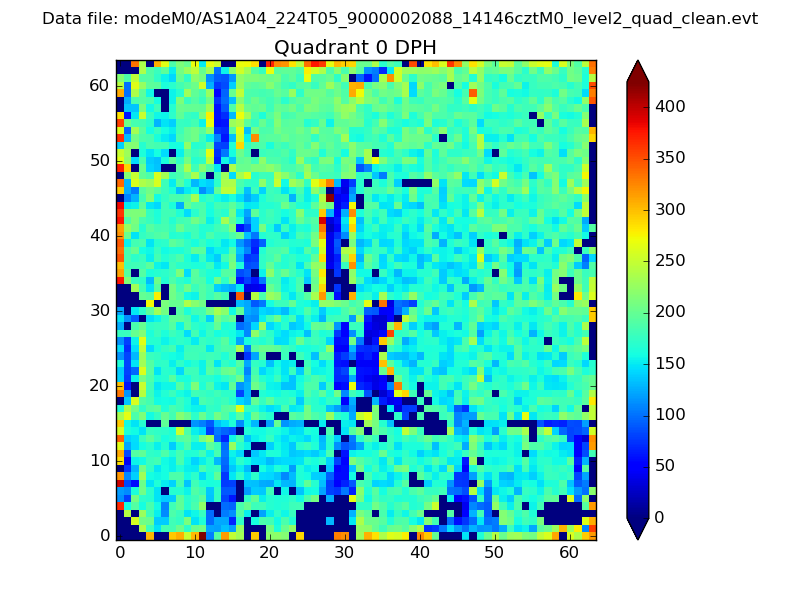 |
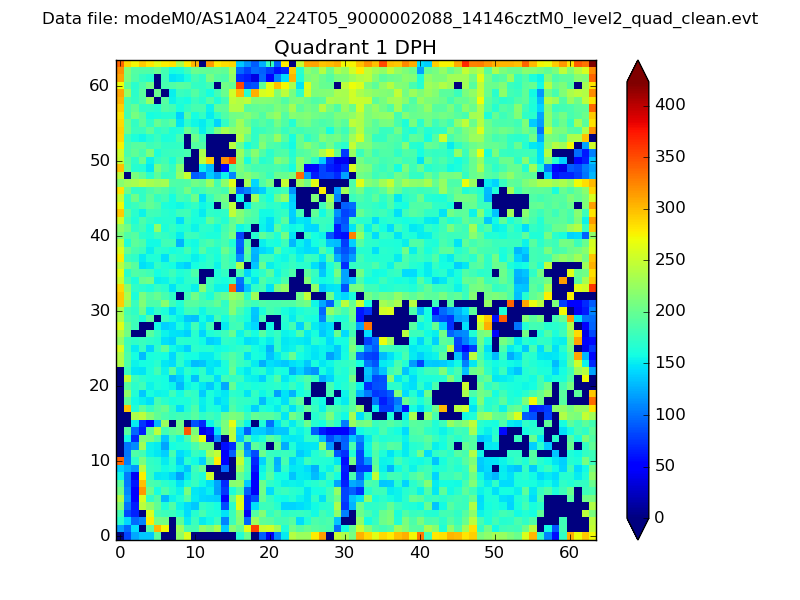 |
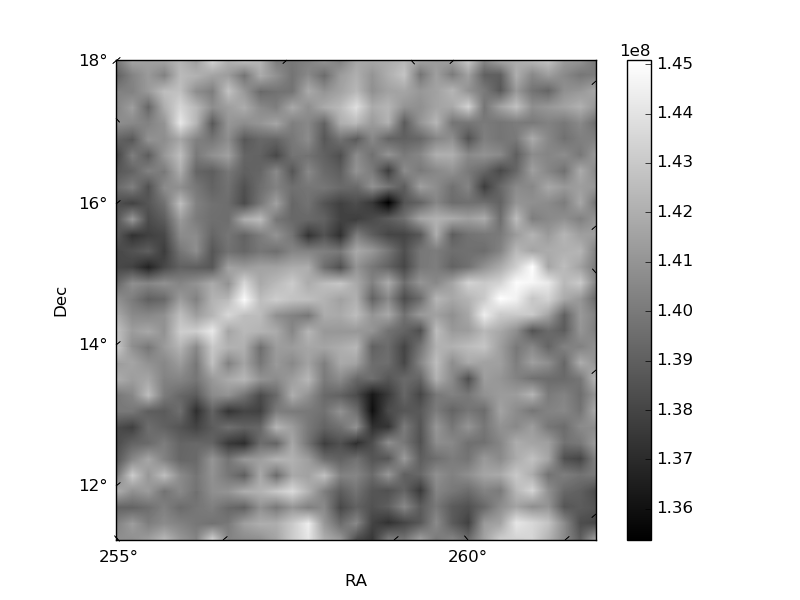
Quadrant B |
|---|---|---|---|
| Quadrant D | 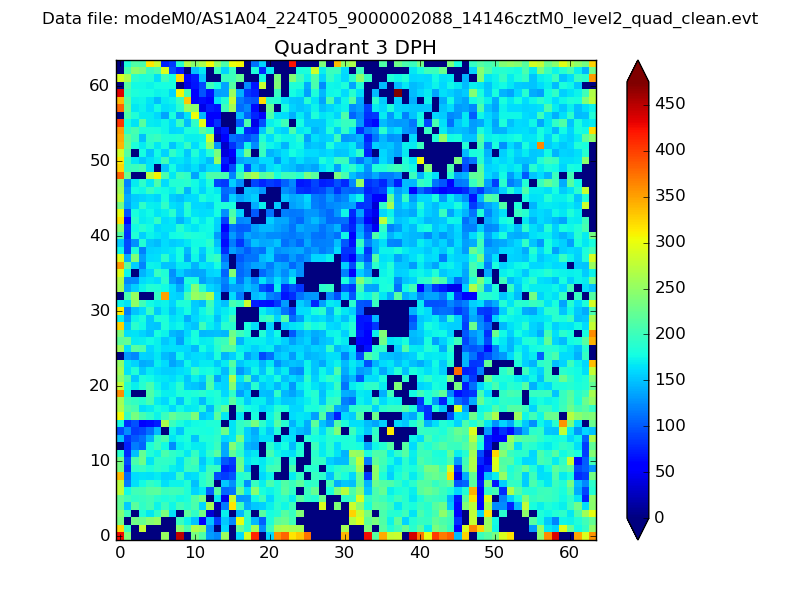 |
 |
Quadrant C |
| Plot type | Count rate plots | Images |
|---|---|---|
| Comparison with Poisson distribution Blue bars denote a histogram of data divided into 1 sec bins. Red curve is a Poisson curve with rate = median count rate of data. |
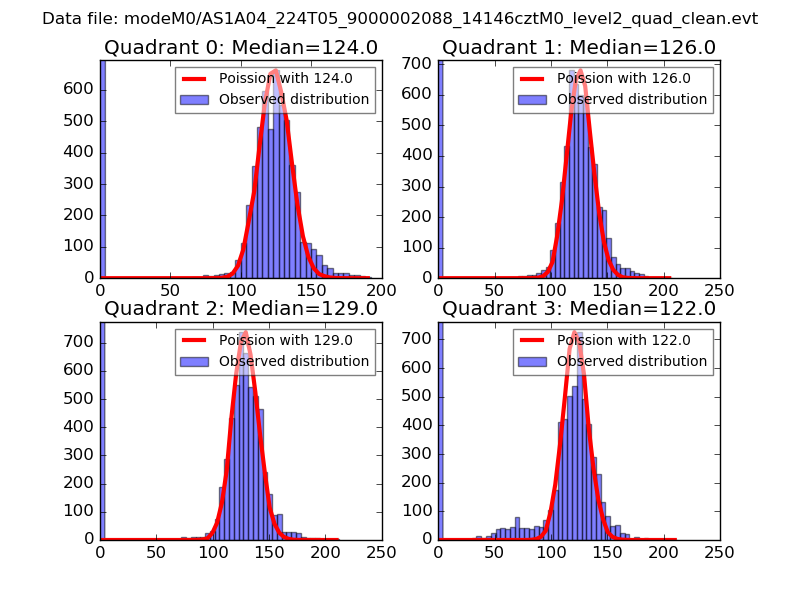 |
 |
| Quadrant-wise count rates Data is divided into 100 sec bins |
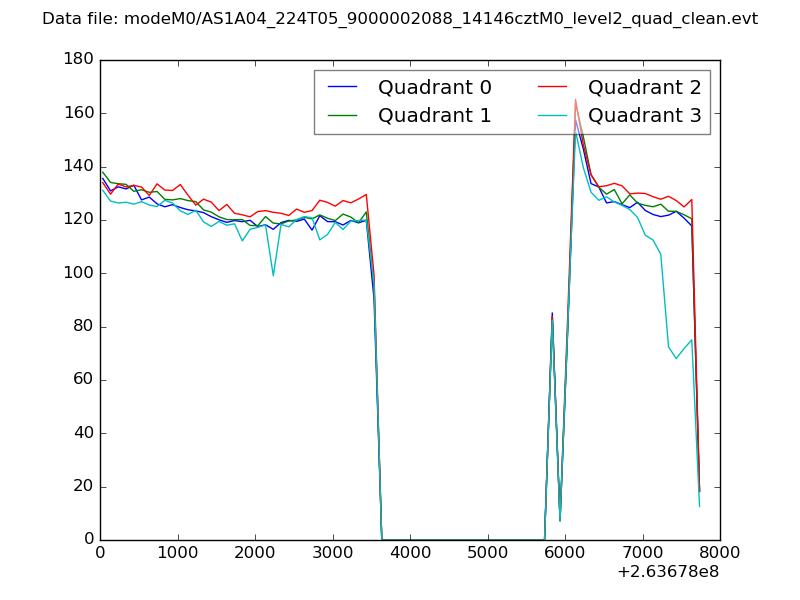 |
|
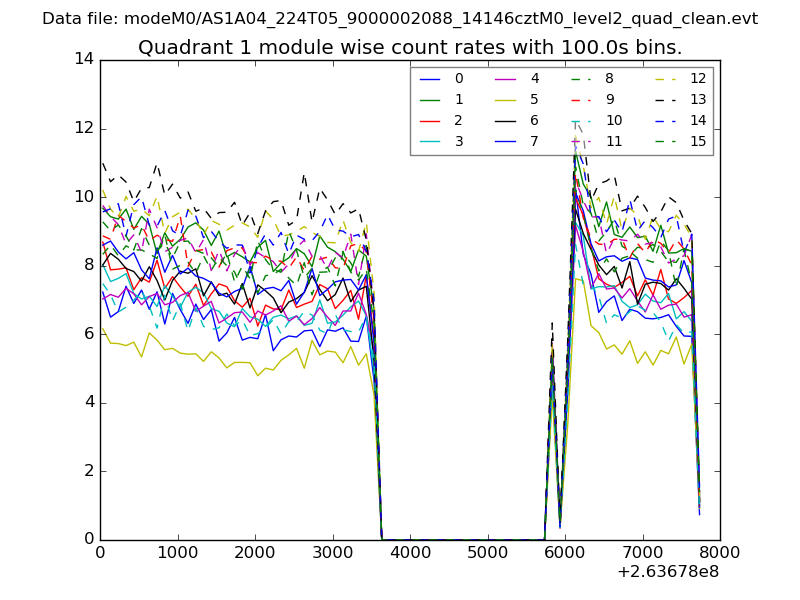
| Module-wise count rates for Quadrant A Data is divided into 100 sec bins |
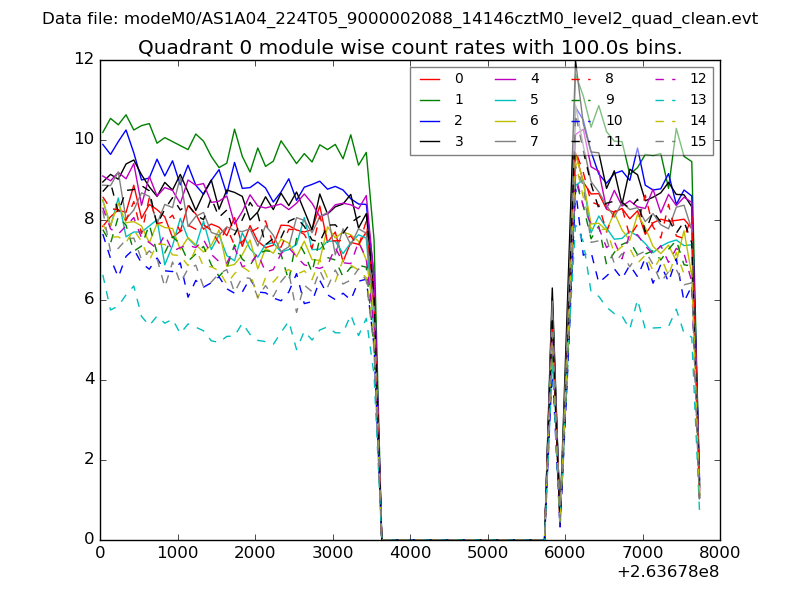 |
 |
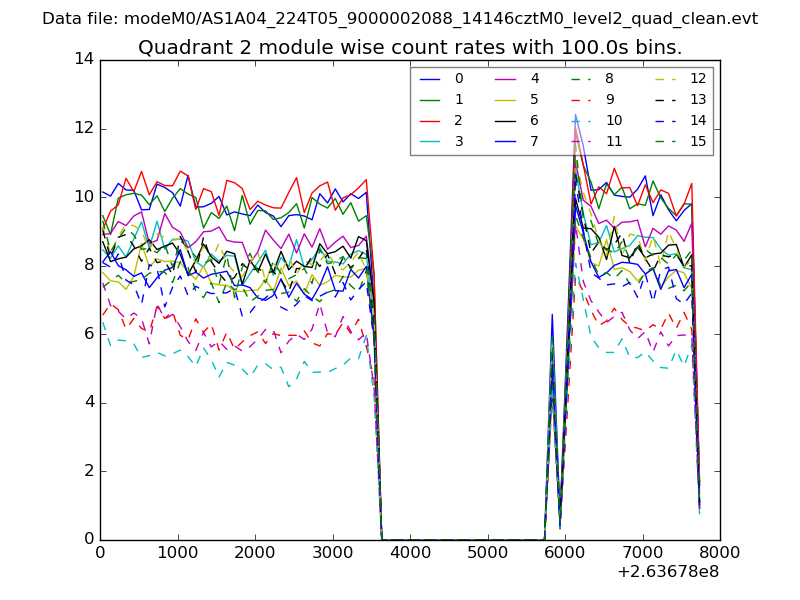
| Module-wise count rates for Quadrant B Data is divided into 100 sec bins |
 |
 |
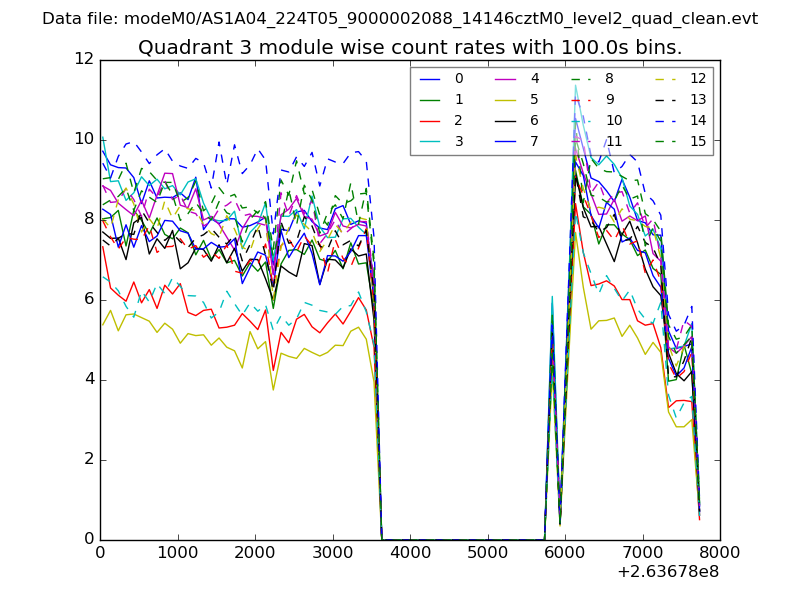
| Module-wise count rates for Quadrant C Data is divided into 100 sec bins |
 |
 |
| Module-wise count rates for Quadrant D Data is divided into 100 sec bins |
 |
 |
| Parameter | Plot |
|---|---|
| CZT HV Monitor | 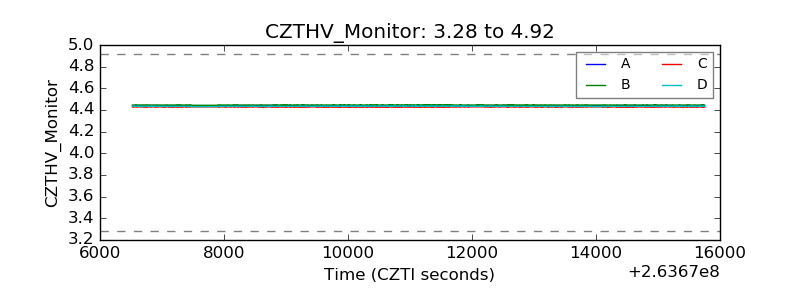 |
| D_VDD | 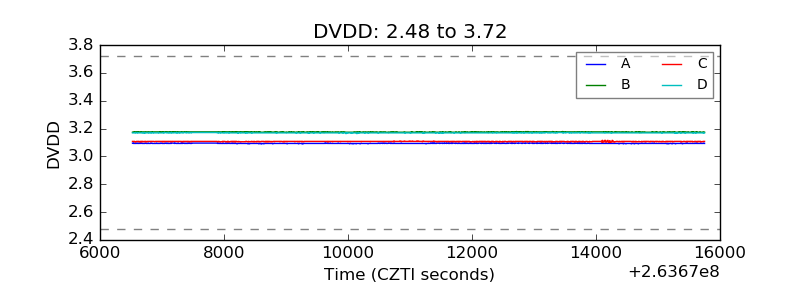 |
| Temperature 1 | 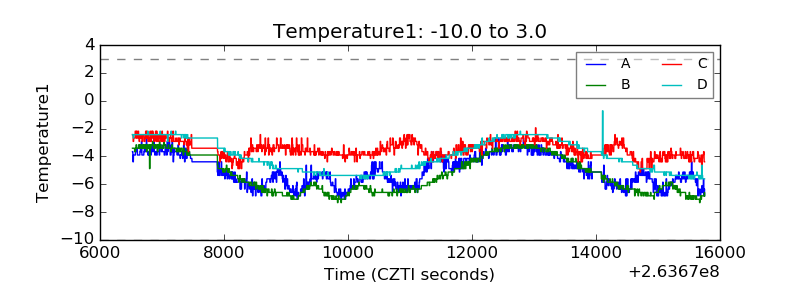 |
| Veto HV Monitor | 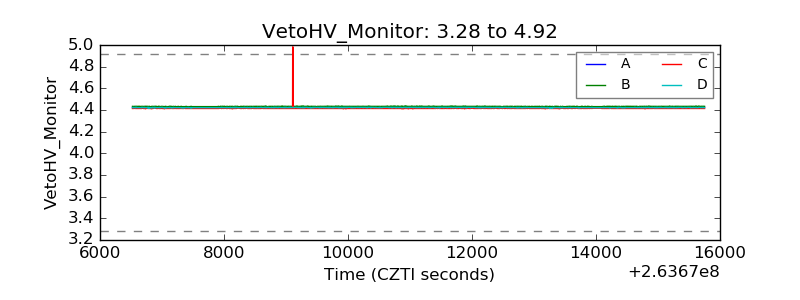 |
| Veto LLD | 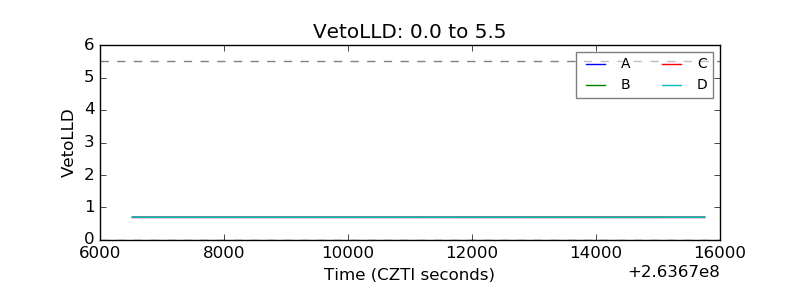 |
| Alpha Counter | 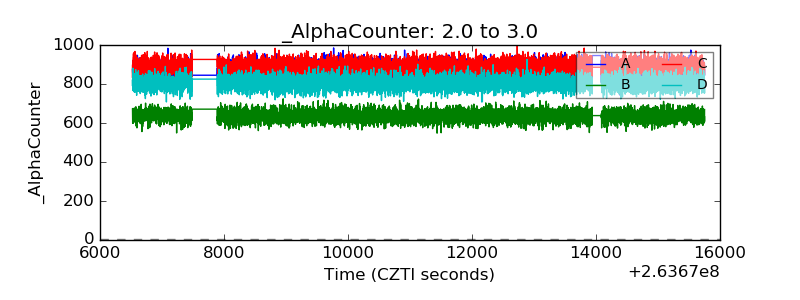 |
| _CPM_Rate | 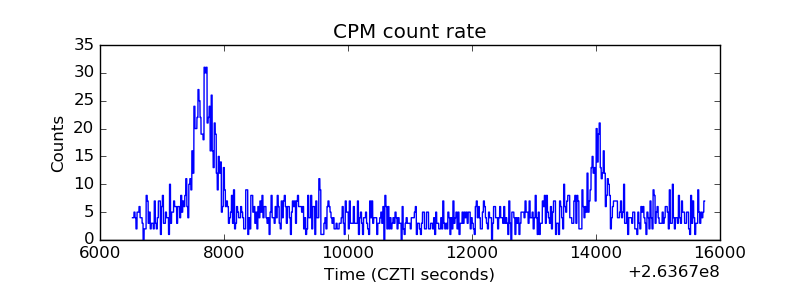 |
| CZT Counter | 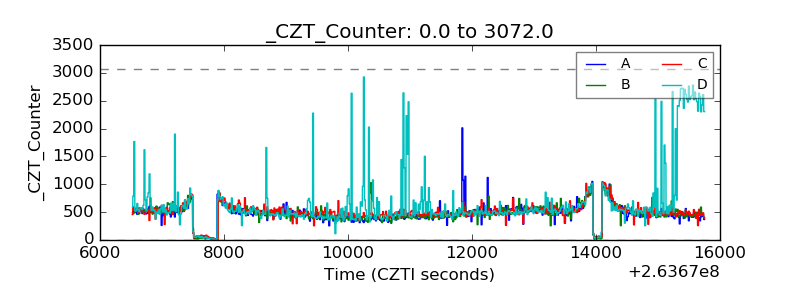 |
| +2.5 Volts monitor | 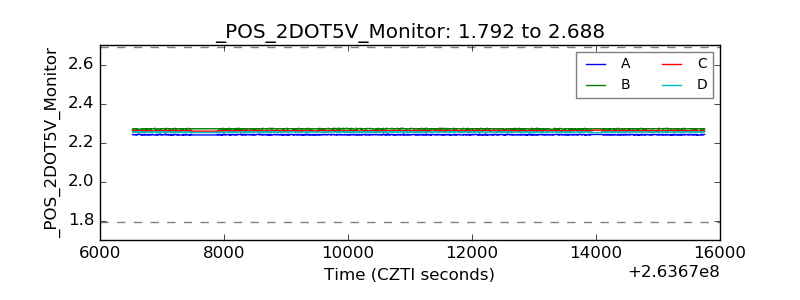 |
| +5 Volts monitor | 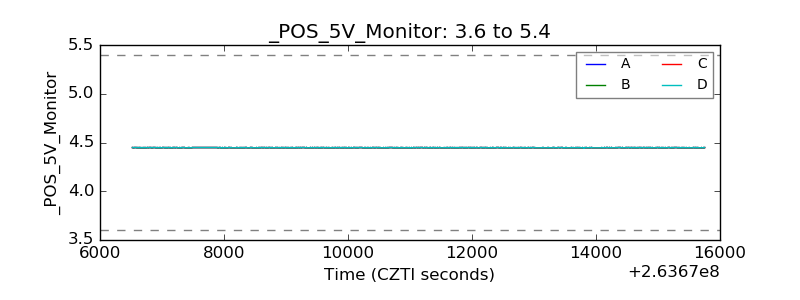 |
| _ROLL_ROT | 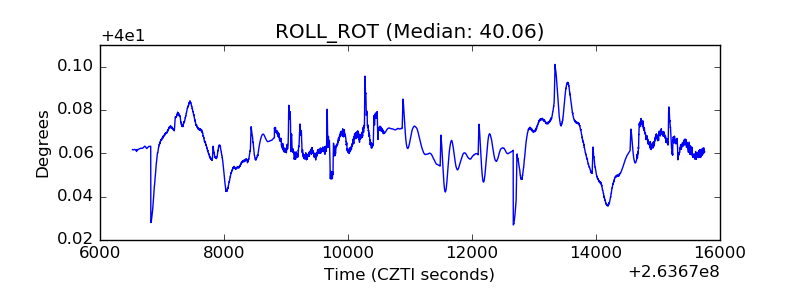 |
| _Roll_DEC | 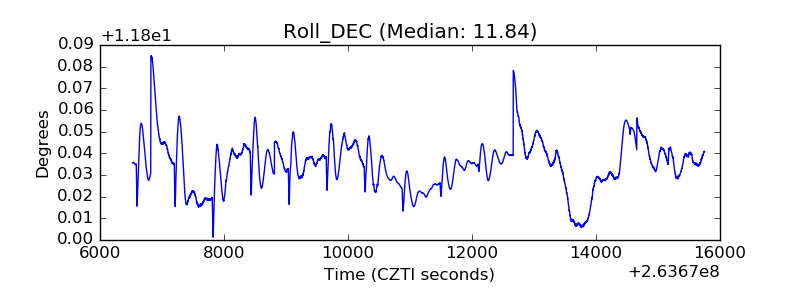 |
| _Roll_RA | 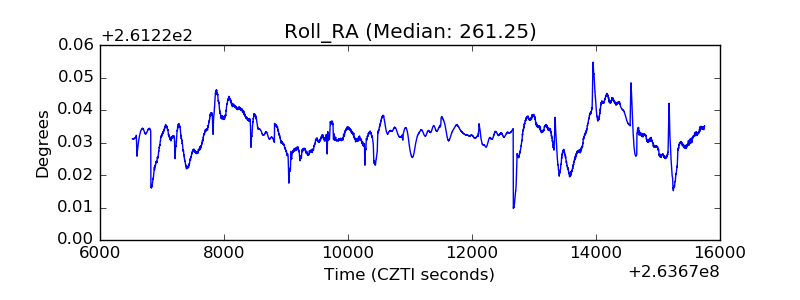 |
| Veto Counter | 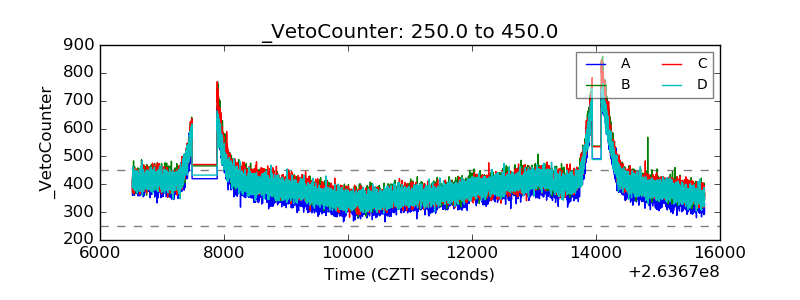 |