| Param | Original file | Final file |
|---|---|---|
| Filename | modeM0/AS1A04_224T05_9000002088_14150cztM0_level2.evt | modeM0/AS1A04_224T05_9000002088_14150cztM0_level2_quad_clean.evt |
| Size (bytes) | 26,591,040 | 5,575,680 |
| Size | 25.4 MB | 5.3 MB |
| Events in quadrant A | 193,976 | 32,456 |
| Events in quadrant B | 185,157 | 38,382 |
| Events in quadrant C | 198,316 | 41,266 |
| Events in quadrant D | 196,505 | 19,830 |
| Mode M0 | |||
|---|---|---|---|
| Quadrant | BADHDUFLAG | Total packets | Discarded packets |
| A | 0 | 6112 | 5266 |
| B | 0 | 6047 | 5166 |
| C | 0 | 6052 | 5174 |
| D | 0 | 8945 | 8159 |
| Mode M9 | |||
|---|---|---|---|
| Quadrant | BADHDUFLAG | Total packets | Discarded packets |
| A | 0 | 1 | 1 |
| B | 1 | 1 | 1 |
| C | 1 | -1 | -1 |
| D | 1 | -1 | -1 |
| Mode SS | |||
|---|---|---|---|
| Quadrant | BADHDUFLAG | Total packets | Discarded packets |
| A | 0 | 60 | 48 |
| B | 0 | 61 | 55 |
| C | 0 | 60 | 48 |
| D | 0 | 60 | 52 |
| Quadrant | Total seconds | Saturated seconds | Saturation percentage |
|---|---|---|---|
| A | 417 | 0 | 0.000000% |
| B | 441 | 0 | 0.000000% |
| C | 439 | 0 | 0.000000% |
| D | 298 | 1 | 0.335570% |
Noise dominated data is calculated using 1-second bins in cleaned event files. If a bin has >2000 counts, and if more than 50% of those come from <1% of pixels, then it is considered to be noise-dominated and hence unusable.
| Quadrant | # 1 sec bins | Bins with >0 counts | Bins with >2000 counts | High rate bins dominated by noise | Noise dominated (total time) | Noise dominated (detector-on time) | Marked lightcurve |
|---|---|---|---|---|---|---|---|
| A | 1868 | 706 | 0 | 0 | 0.00% | 0.00% | 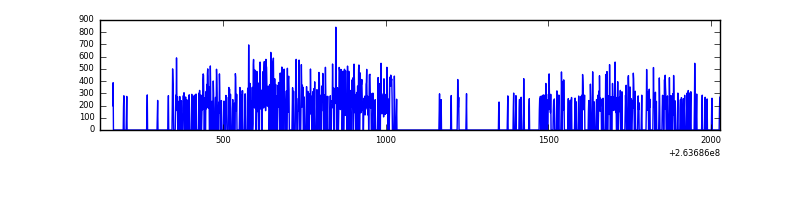 |
| B | 1883 | 701 | 0 | 0 | 0.00% | 0.00% | 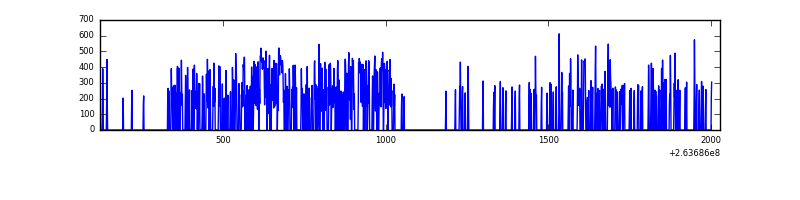 |
| C | 1860 | 704 | 0 | 0 | 0.00% | 0.00% | 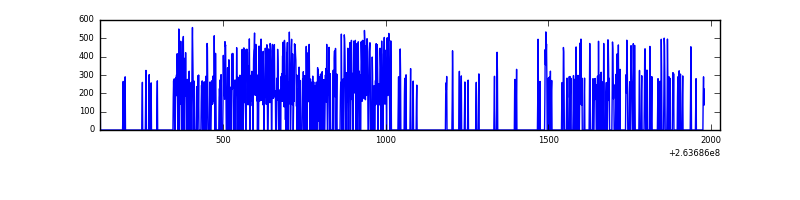 |
| D | 1792 | 515 | 0 | 0 | 0.00% | 0.00% | 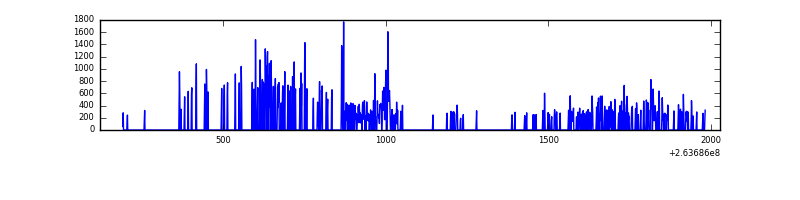 |
Top three noisy pixels from each quadrant. If the there are fewer than three noisy pixels in the level2.evt file, extra rows are filled as -1
| Pixel properties | Quadrant properties | ||||||
|---|---|---|---|---|---|---|---|
| Quadrant | DetID | PixID | Counts | Sigma | Mean | Median | Sigma |
| A | 8 | 15 | 16140 | 1426.53 | 44 | 43 | 11.3 |
| A | 12 | 189 | 4723 | 414.74 | 44 | 43 | 11.3 |
| A | 12 | 96 | 1328 | 113.88 | 44 | 43 | 11.3 |
| B | 0 | 214 | 2585 | 226.51 | 46 | 45 | 11.2 |
| B | 12 | 111 | 1123 | 96.13 | 46 | 45 | 11.2 |
| B | 11 | 111 | 939 | 79.72 | 46 | 45 | 11.2 |
| C | 3 | 233 | 20229 | 1595.91 | 45 | 45 | 12.6 |
| C | 13 | 61 | 319 | 21.66 | 45 | 45 | 12.6 |
| C | 7 | 247 | 118 | 5.77 | 45 | 45 | 12.6 |
| D | 1 | 52 | 76246 | 8251.91 | 31 | 30 | 9.2 |
| D | 13 | 104 | 1334 | 141.18 | 31 | 30 | 9.2 |
| D | 2 | 234 | 1152 | 121.48 | 31 | 30 | 9.2 |
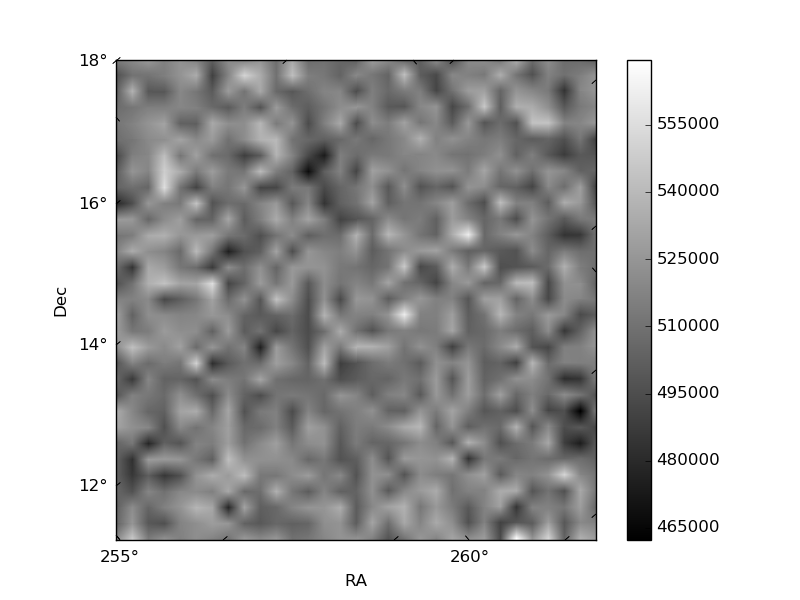
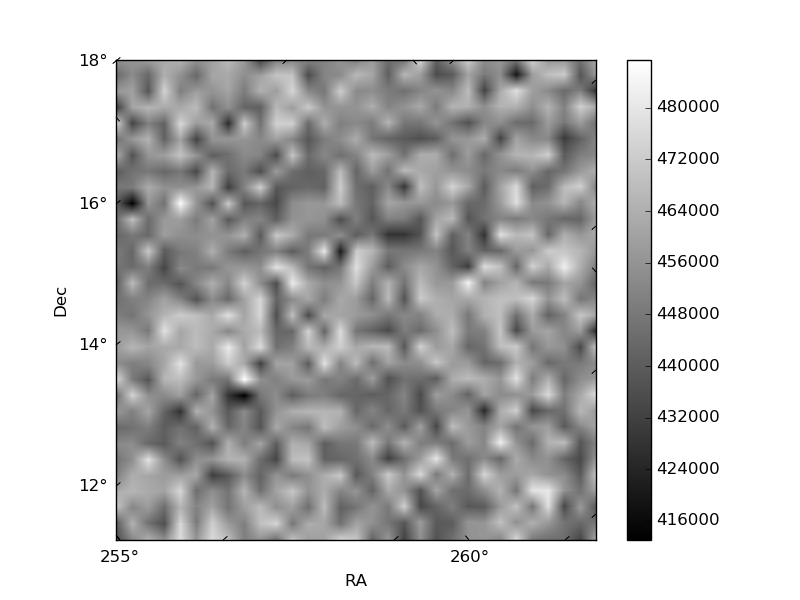
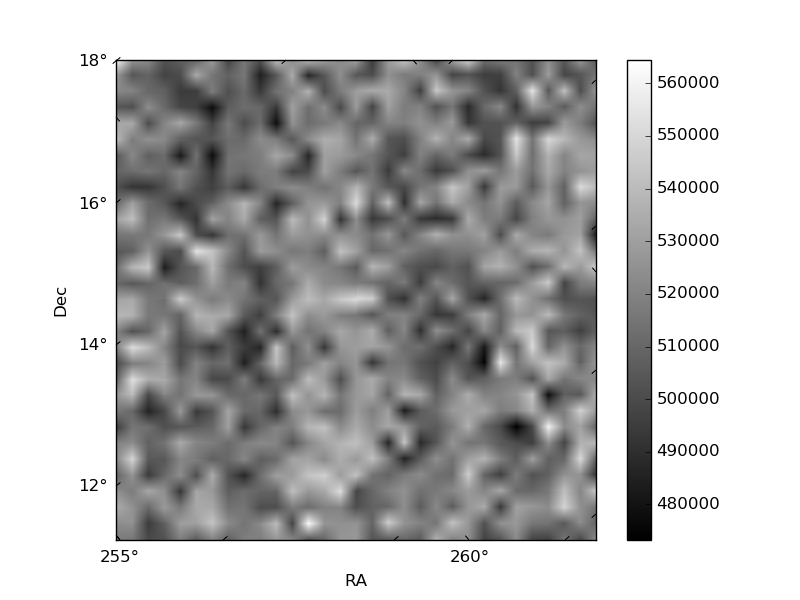
Histogram calculated using DETX and DETY for each event in the final _common_clean file
| Quadrant A |  |
 |
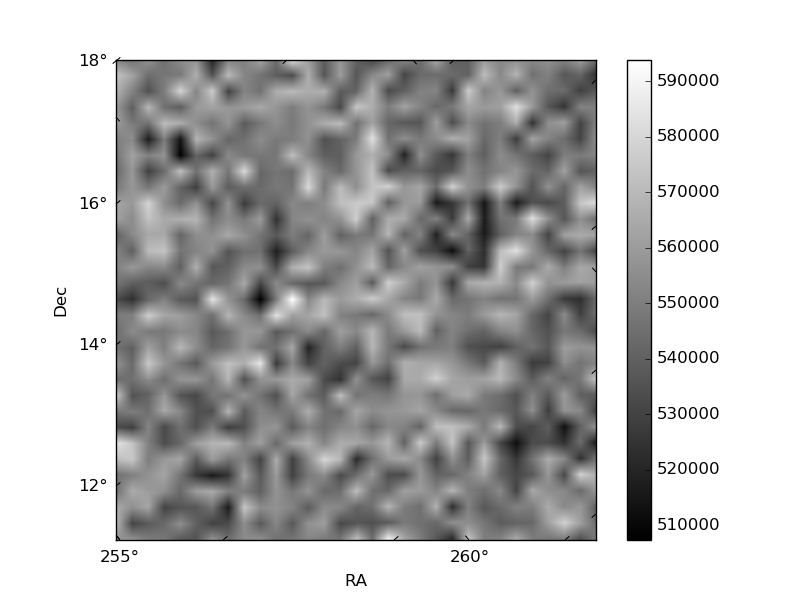
Quadrant B |
|---|---|---|---|
| Quadrant D | 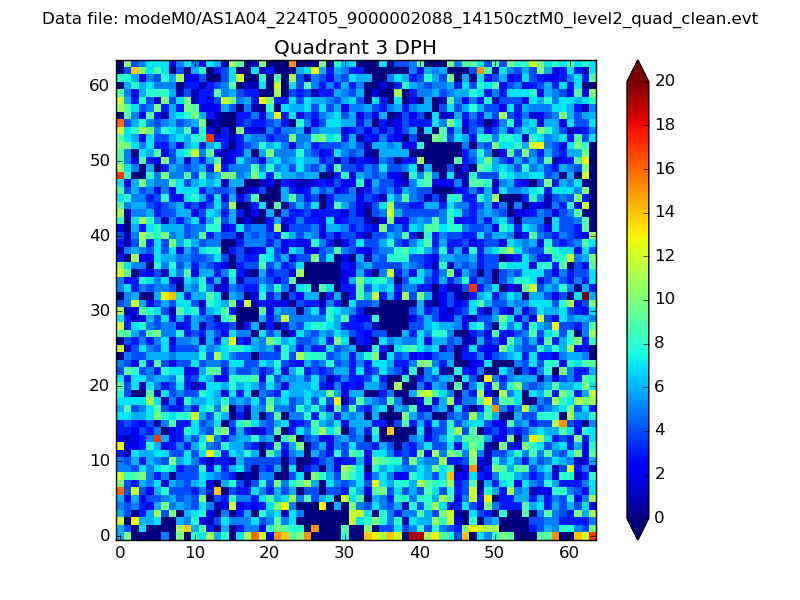 |
 |
Quadrant C |
| Plot type | Count rate plots | Images |
|---|---|---|
| Comparison with Poisson distribution Blue bars denote a histogram of data divided into 1 sec bins. Red curve is a Poisson curve with rate = median count rate of data. |
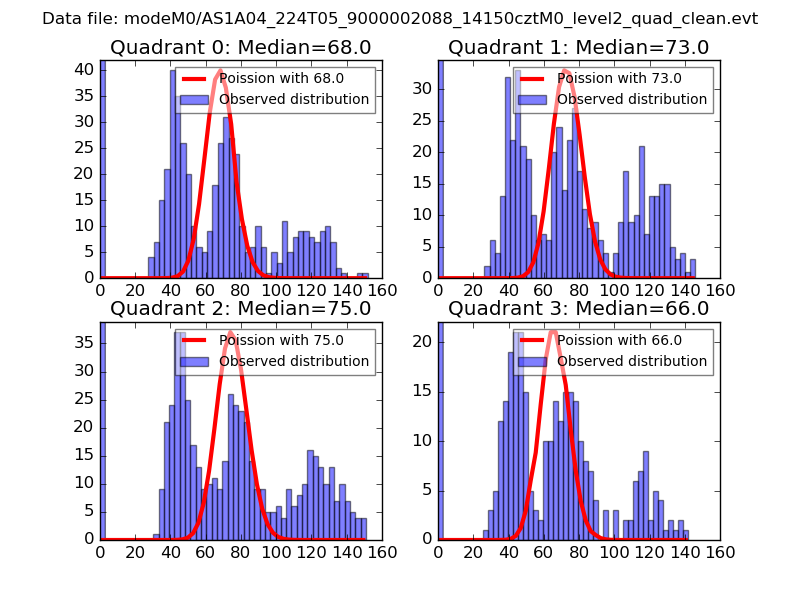 |
 |
| Quadrant-wise count rates Data is divided into 100 sec bins |
 |
|
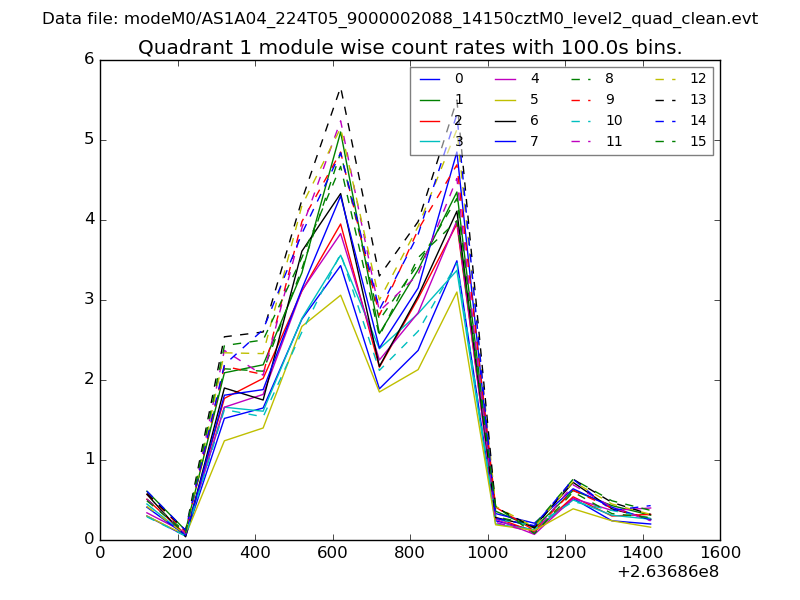
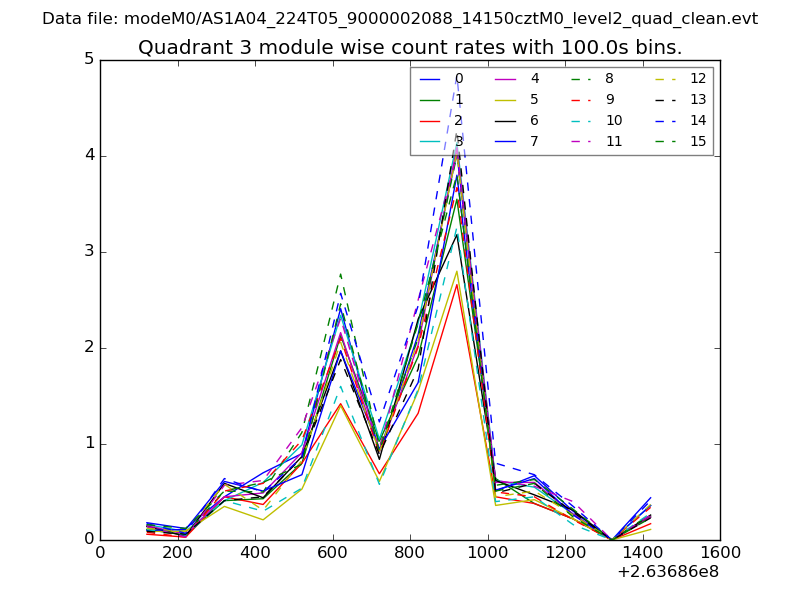
| Module-wise count rates for Quadrant A Data is divided into 100 sec bins |
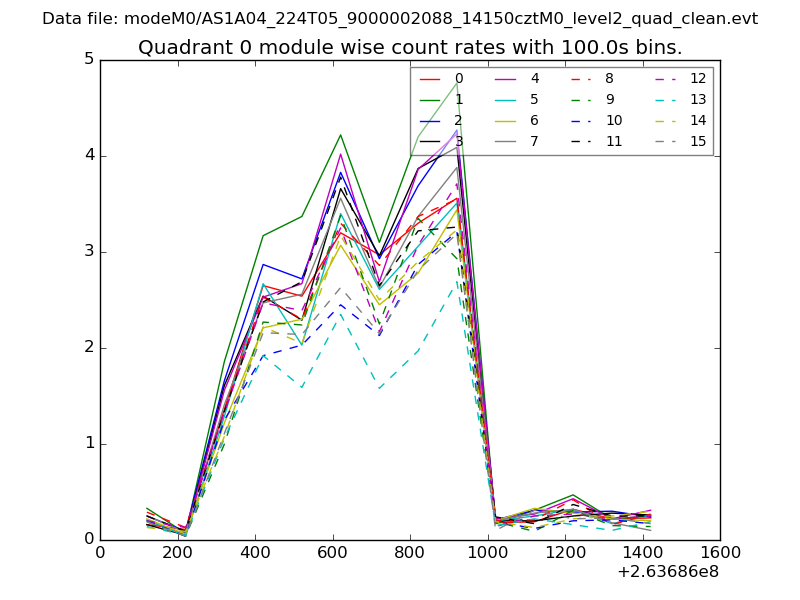 |
 |
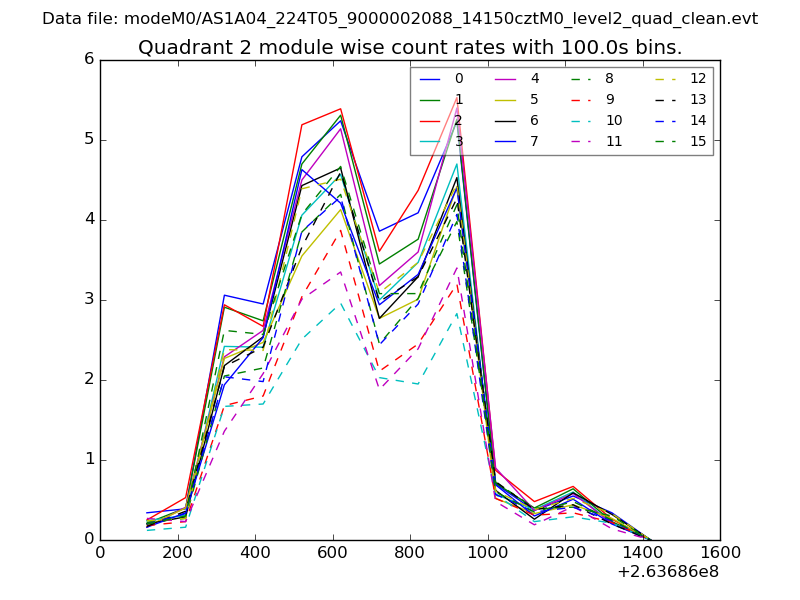
| Module-wise count rates for Quadrant B Data is divided into 100 sec bins |
 |
 |
| Module-wise count rates for Quadrant C Data is divided into 100 sec bins |
 |
 |
| Module-wise count rates for Quadrant D Data is divided into 100 sec bins |
 |
 |
| Parameter | Plot |
|---|---|
| CZT HV Monitor | 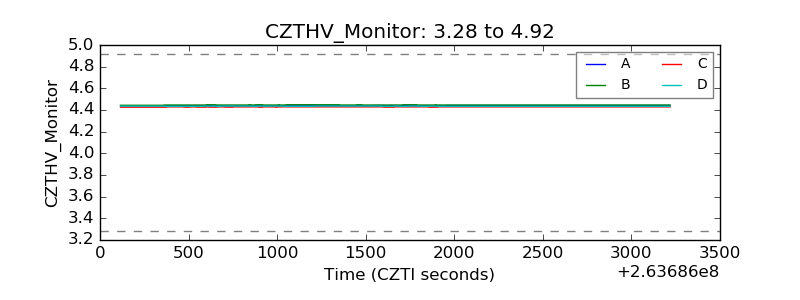 |
| D_VDD | 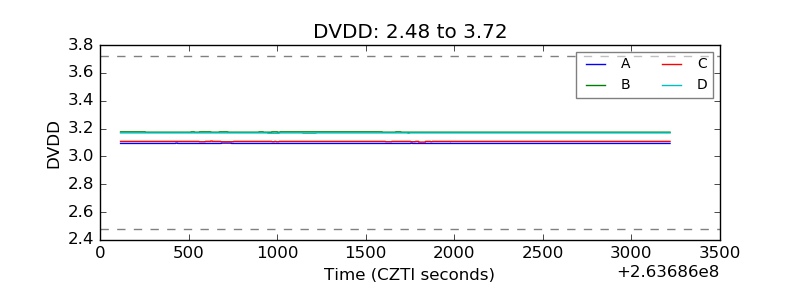 |
| Temperature 1 | 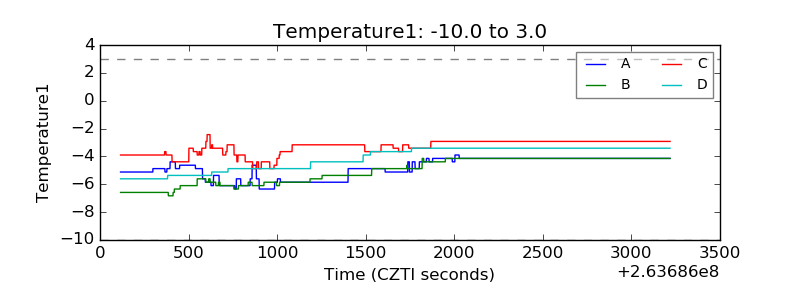 |
| Veto HV Monitor | 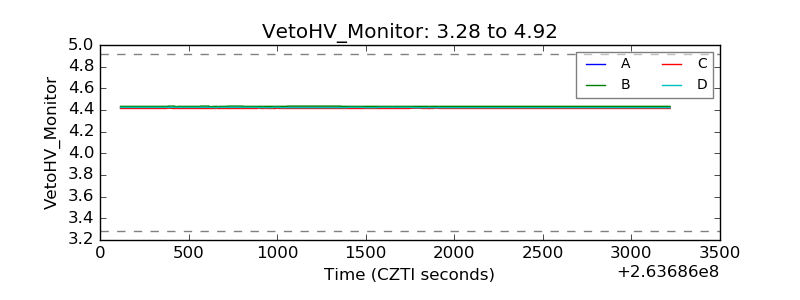 |
| Veto LLD | 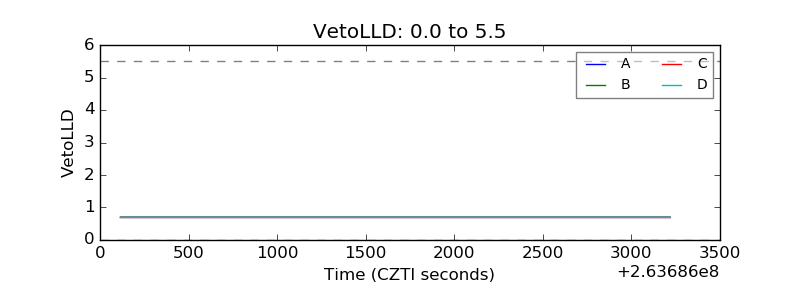 |
| Alpha Counter | 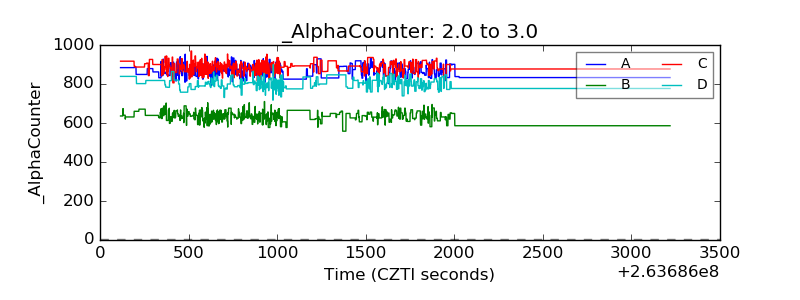 |
| _CPM_Rate | 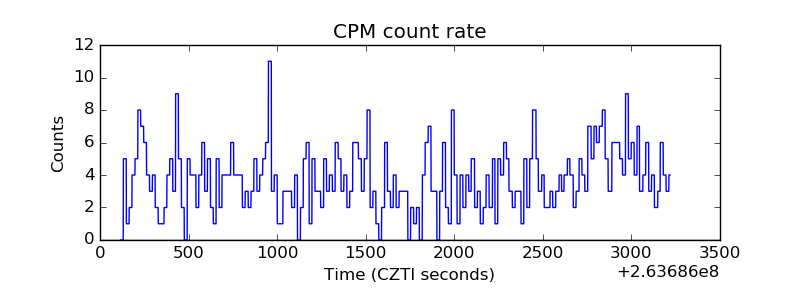 |
| CZT Counter | 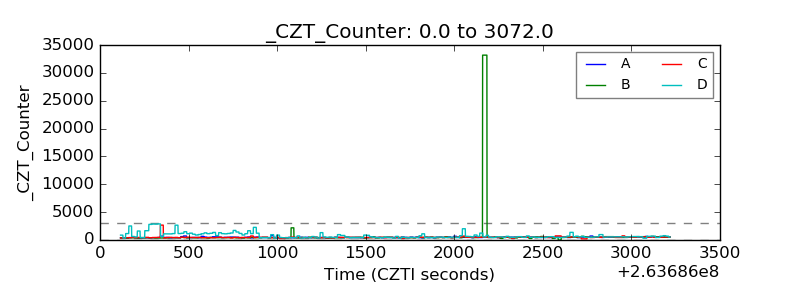 |
| +2.5 Volts monitor |  |
| +5 Volts monitor | 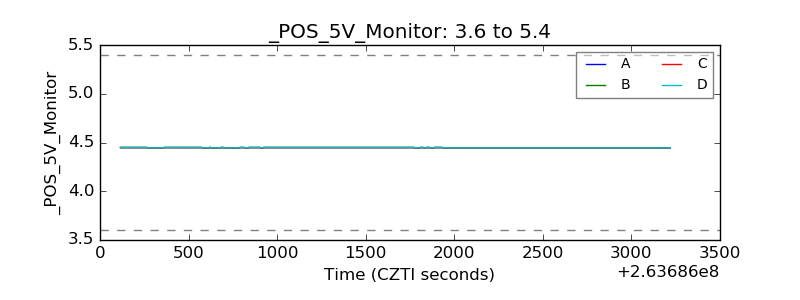 |
| _ROLL_ROT | 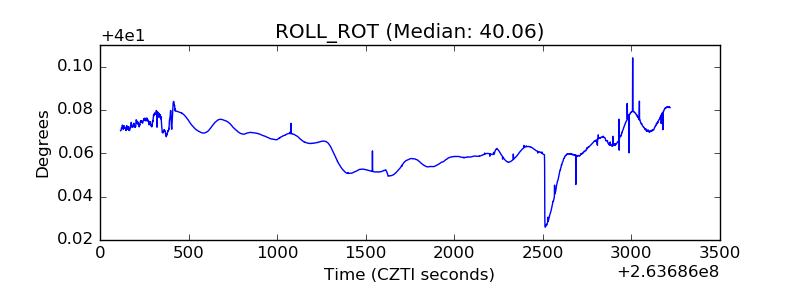 |
| _Roll_DEC | 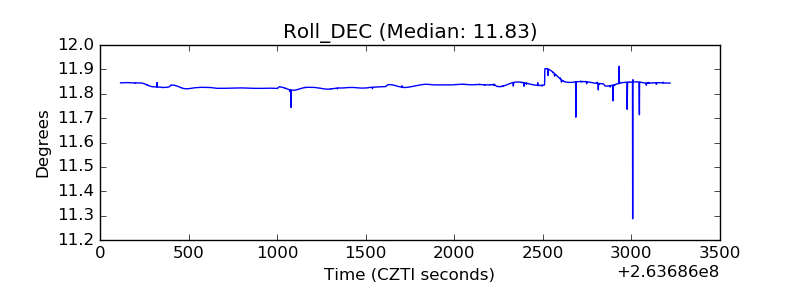 |
| _Roll_RA | 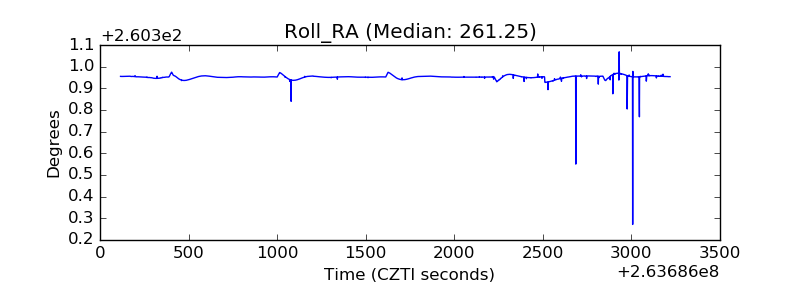 |
| Veto Counter | 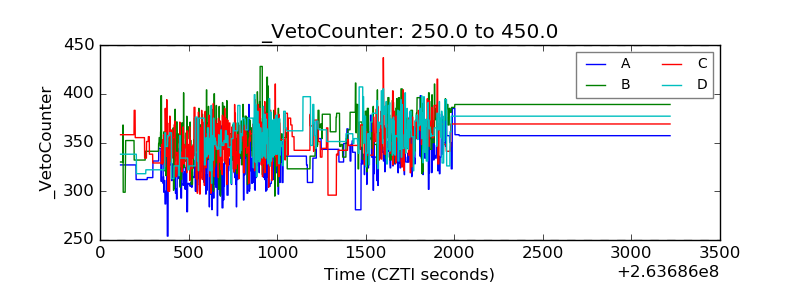 |