| Param | Original file | Final file |
|---|---|---|
| Filename | modeM0/AS1A04_224T05_9000002088_14151cztM0_level2.evt | modeM0/AS1A04_224T05_9000002088_14151cztM0_level2_quad_clean.evt |
| Size (bytes) | 419,713,920 | 60,027,840 |
| Size | 400.3 MB | 57.2 MB |
| Events in quadrant A | 2,588,848 | 364,221 |
| Events in quadrant B | 2,551,747 | 368,859 |
| Events in quadrant C | 2,671,827 | 381,955 |
| Events in quadrant D | 4,542,529 | 335,298 |
| Mode M0 | |||
|---|---|---|---|
| Quadrant | BADHDUFLAG | Total packets | Discarded packets |
| A | 0 | 11041 | 1 |
| B | 0 | 11007 | 1 |
| C | 0 | 11163 | 1 |
| D | 0 | 16958 | 1 |
| Mode M9 | |||
|---|---|---|---|
| Quadrant | BADHDUFLAG | Total packets | Discarded packets |
| A | 0 | 2 | 0 |
| B | 0 | 2 | 0 |
| C | 0 | 2 | 0 |
| D | 0 | 2 | 0 |
| Mode SS | |||
|---|---|---|---|
| Quadrant | BADHDUFLAG | Total packets | Discarded packets |
| A | 0 | 108 | 0 |
| B | 0 | 108 | 0 |
| C | 0 | 108 | 0 |
| D | 0 | 108 | 0 |
| Quadrant | Total seconds | Saturated seconds | Saturation percentage |
|---|---|---|---|
| A | 5232 | 108 | 2.064220% |
| B | 5232 | 133 | 2.542049% |
| C | 5232 | 94 | 1.796636% |
| D | 5232 | 642 | 12.270642% |
Noise dominated data is calculated using 1-second bins in cleaned event files. If a bin has >2000 counts, and if more than 50% of those come from <1% of pixels, then it is considered to be noise-dominated and hence unusable.
| Quadrant | # 1 sec bins | Bins with >0 counts | Bins with >2000 counts | High rate bins dominated by noise | Noise dominated (total time) | Noise dominated (detector-on time) | Marked lightcurve |
|---|---|---|---|---|---|---|---|
| A | 5508 | 5234 | 3 | 3 | 0.05% | 0.06% | 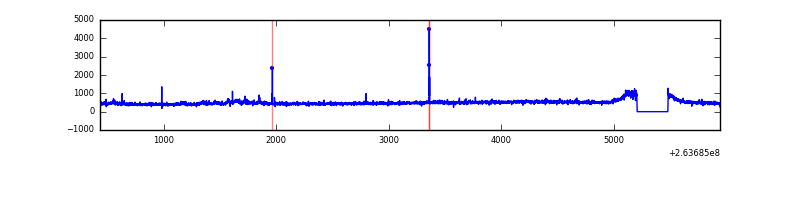 |
| B | 5508 | 5234 | 1 | 1 | 0.02% | 0.02% | 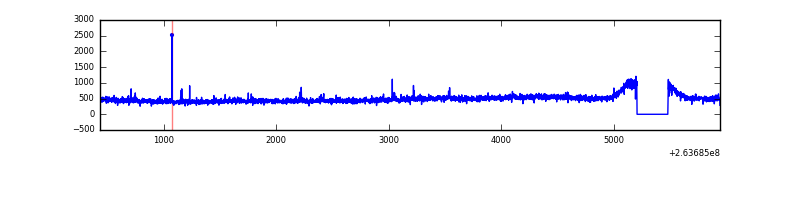 |
| C | 5508 | 5234 | 0 | 0 | 0.00% | 0.00% | 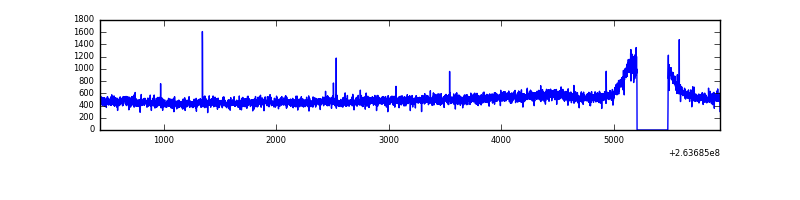 |
| D | 5508 | 5234 | 531 | 531 | 9.64% | 10.15% | 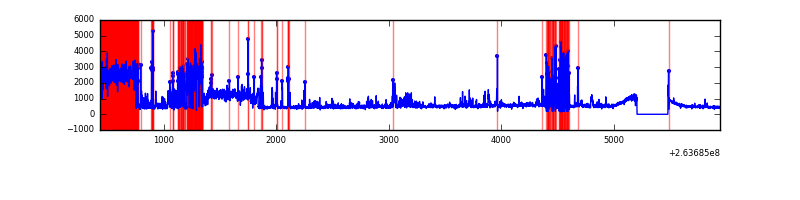 |
Top three noisy pixels from each quadrant. If the there are fewer than three noisy pixels in the level2.evt file, extra rows are filled as -1
| Pixel properties | Quadrant properties | ||||||
|---|---|---|---|---|---|---|---|
| Quadrant | DetID | PixID | Counts | Sigma | Mean | Median | Sigma |
| A | 8 | 15 | 66532 | 496.83 | 643 | 629 | 132.6 |
| A | 12 | 96 | 26125 | 192.21 | 643 | 629 | 132.6 |
| A | 12 | 189 | 23955 | 175.85 | 643 | 629 | 132.6 |
| B | 0 | 214 | 21377 | 164.94 | 639 | 624 | 125.8 |
| B | 12 | 111 | 15326 | 116.85 | 639 | 624 | 125.8 |
| B | 11 | 111 | 13325 | 100.94 | 639 | 624 | 125.8 |
| C | 3 | 233 | 219181 | 1460.44 | 628 | 632 | 149.6 |
| C | 14 | 234 | 4548 | 26.17 | 628 | 632 | 149.6 |
| C | 13 | 61 | 4369 | 24.97 | 628 | 632 | 149.6 |
| D | 1 | 52 | 2174778 | 14890.59 | 604 | 589 | 146.0 |
| D | 2 | 152 | 34276 | 230.72 | 604 | 589 | 146.0 |
| D | 2 | 234 | 21096 | 140.45 | 604 | 589 | 146.0 |
Histogram calculated using DETX and DETY for each event in the final _common_clean file
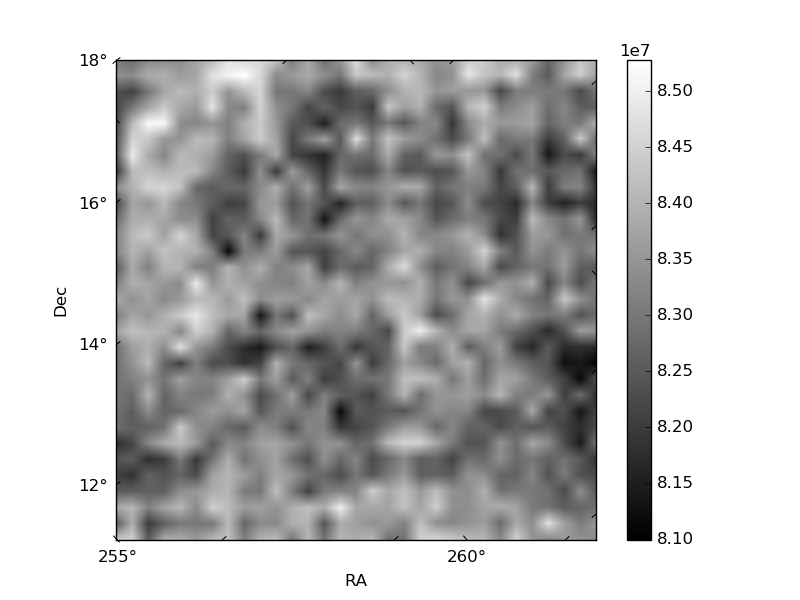
| Quadrant A |  |
 |
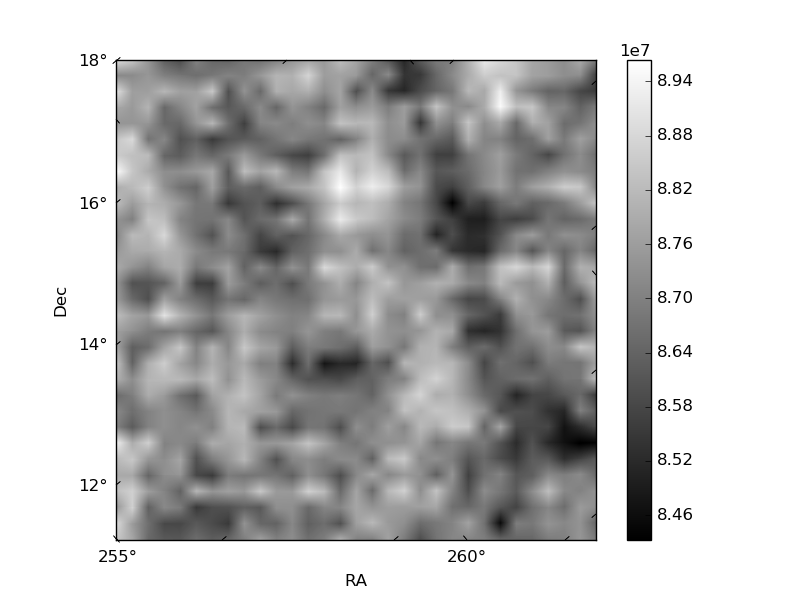
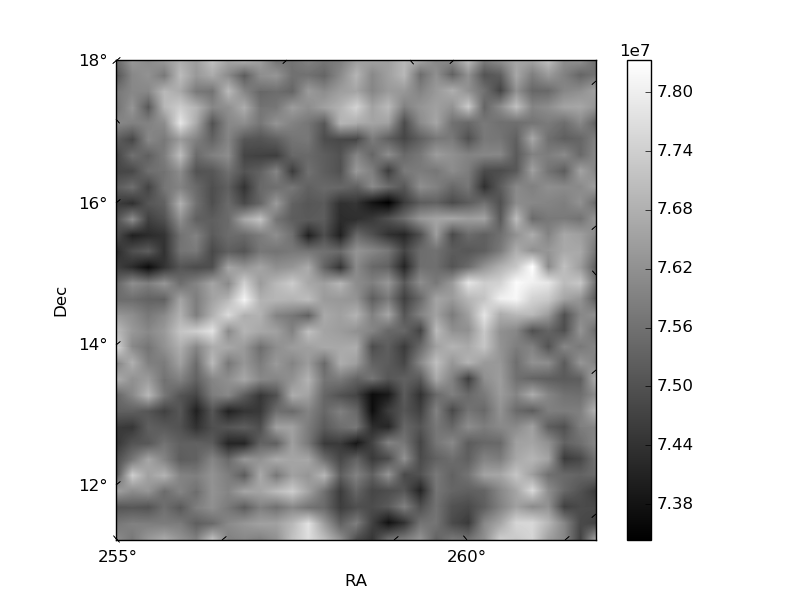
Quadrant B |
|---|---|---|---|
| Quadrant D |  |
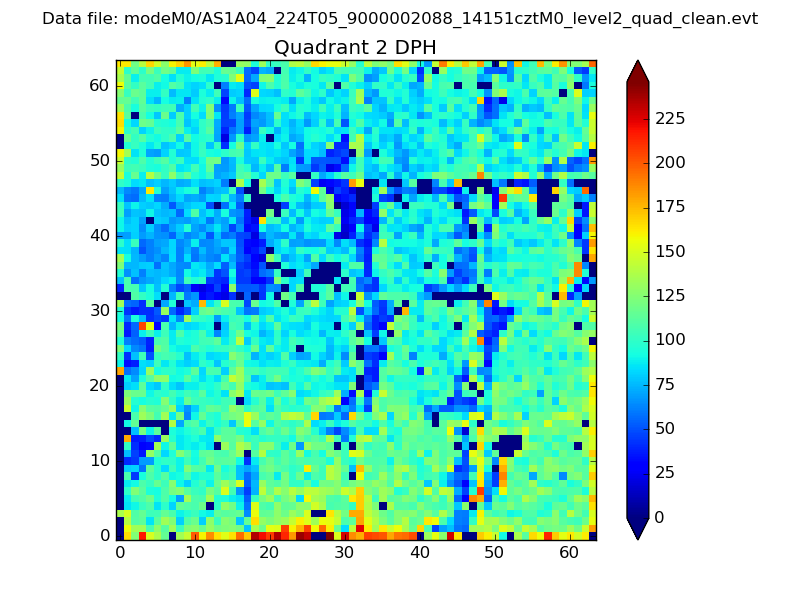 |
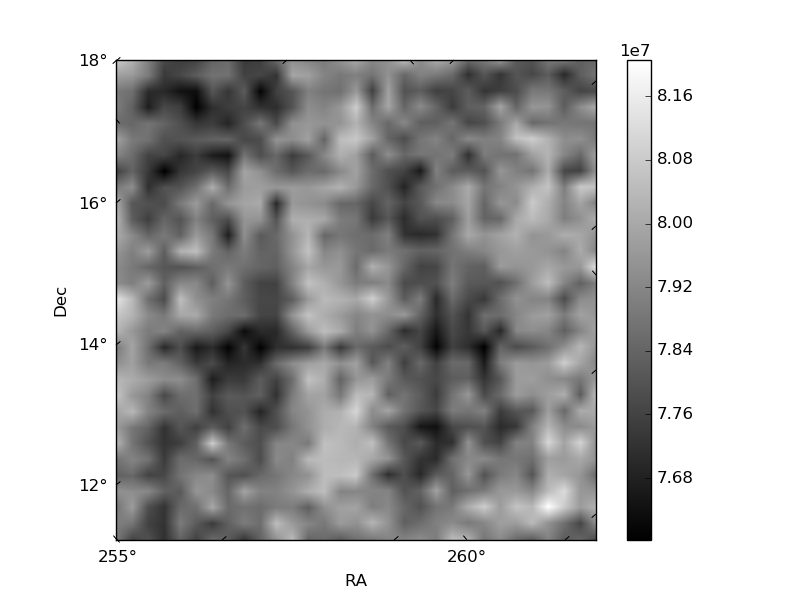
Quadrant C |
| Plot type | Count rate plots | Images |
|---|---|---|
| Comparison with Poisson distribution Blue bars denote a histogram of data divided into 1 sec bins. Red curve is a Poisson curve with rate = median count rate of data. |
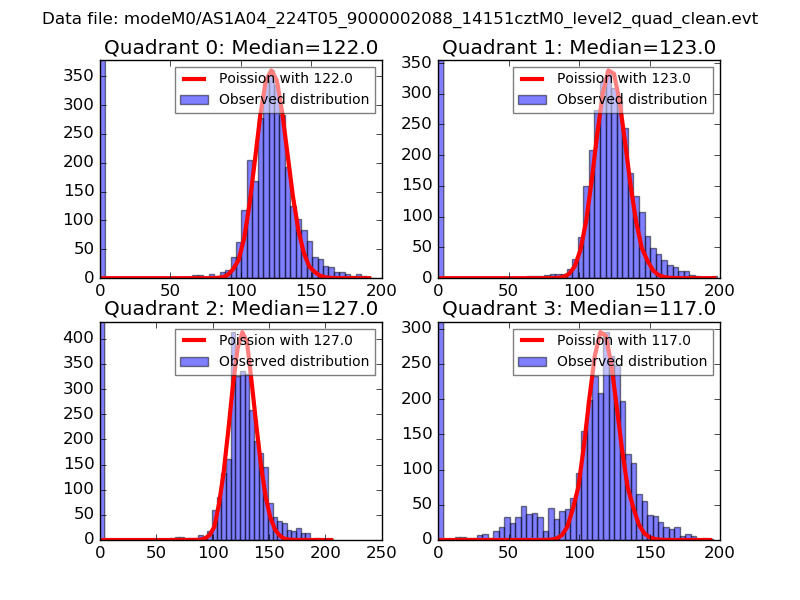 |
 |
| Quadrant-wise count rates Data is divided into 100 sec bins |
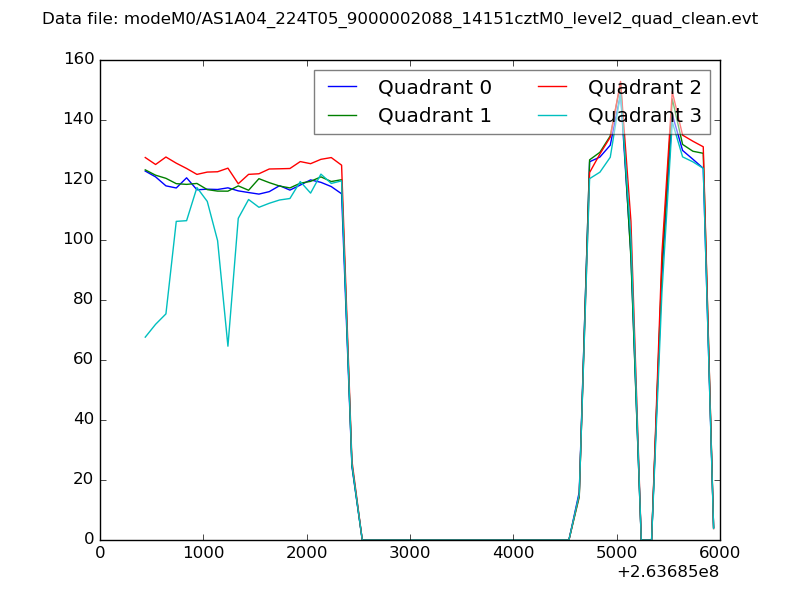 |
|
| Module-wise count rates for Quadrant A Data is divided into 100 sec bins |
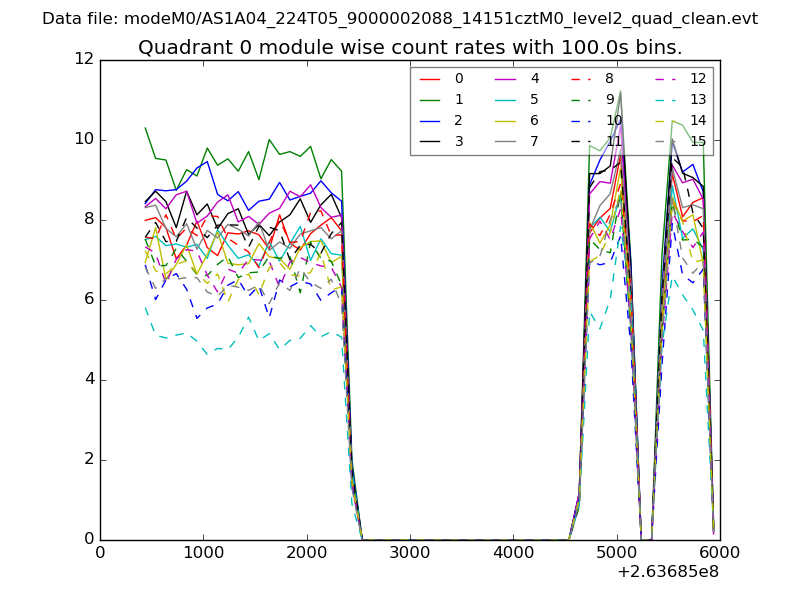 |
 |
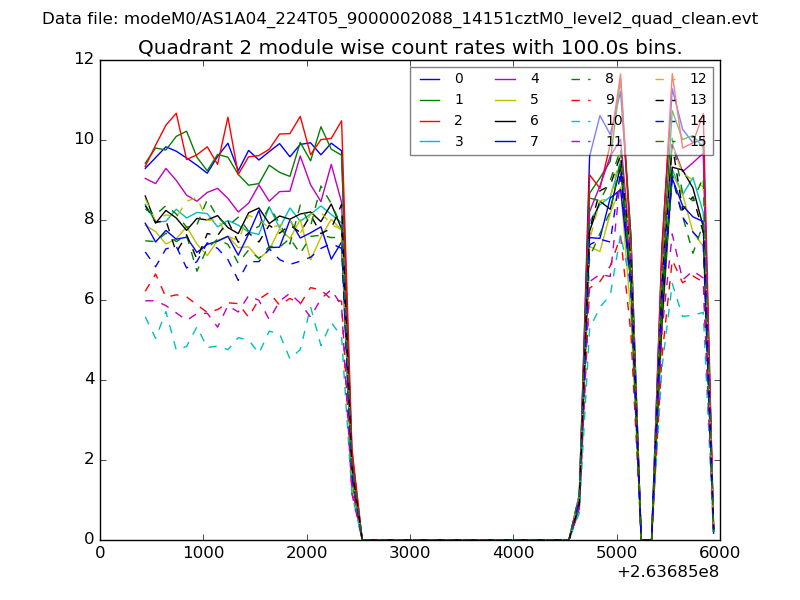
| Module-wise count rates for Quadrant B Data is divided into 100 sec bins |
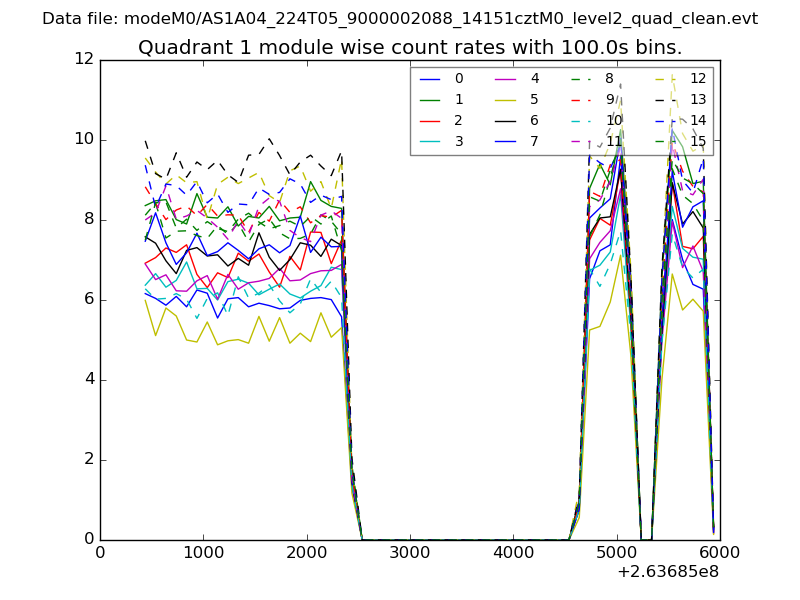 |
 |
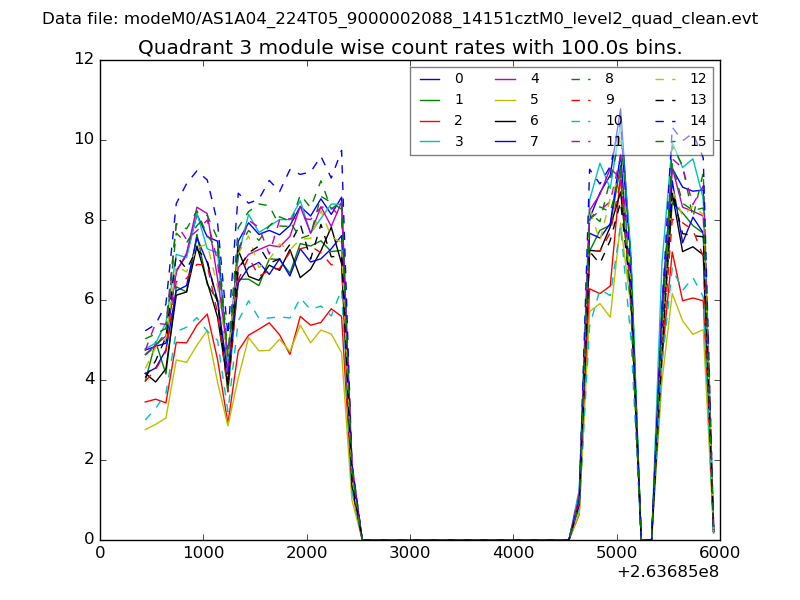
| Module-wise count rates for Quadrant C Data is divided into 100 sec bins |
 |
 |
| Module-wise count rates for Quadrant D Data is divided into 100 sec bins |
 |
 |
| Parameter | Plot |
|---|---|
| CZT HV Monitor |  |
| D_VDD | 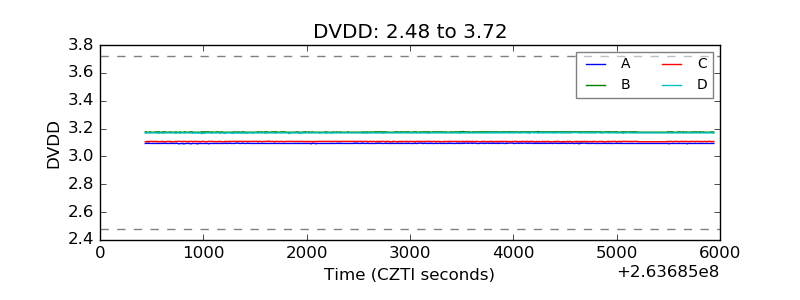 |
| Temperature 1 | 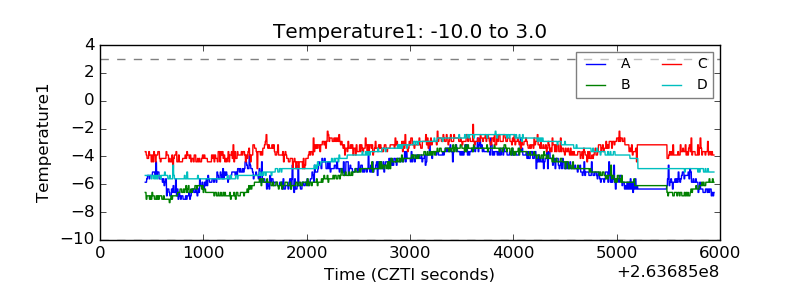 |
| Veto HV Monitor | 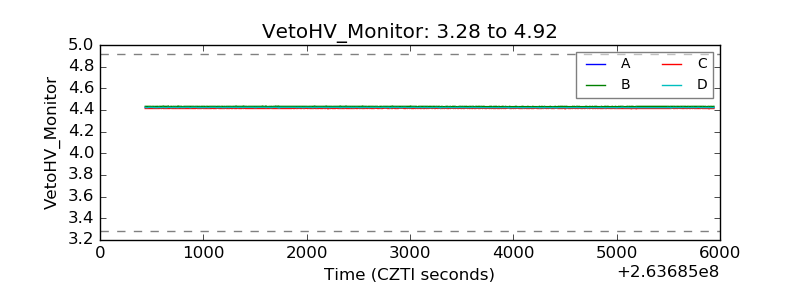 |
| Veto LLD | 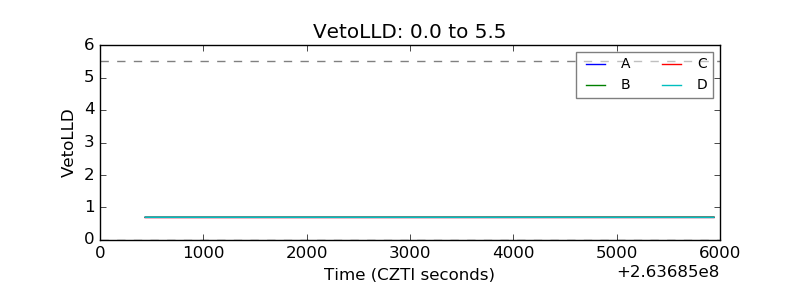 |
| Alpha Counter | 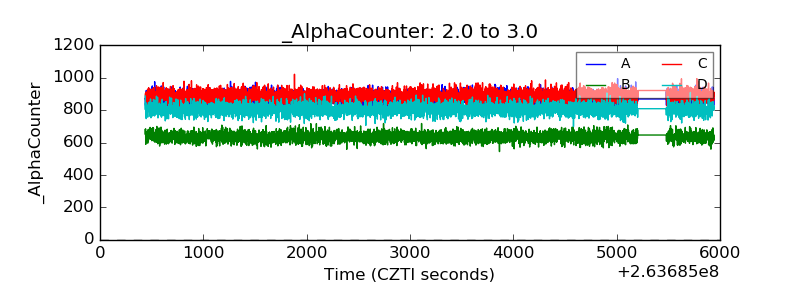 |
| _CPM_Rate | 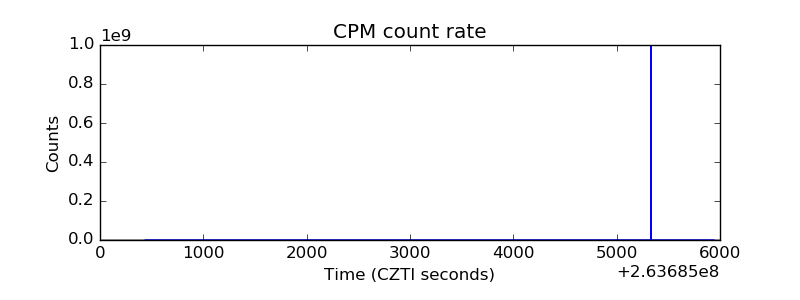 |
| CZT Counter | 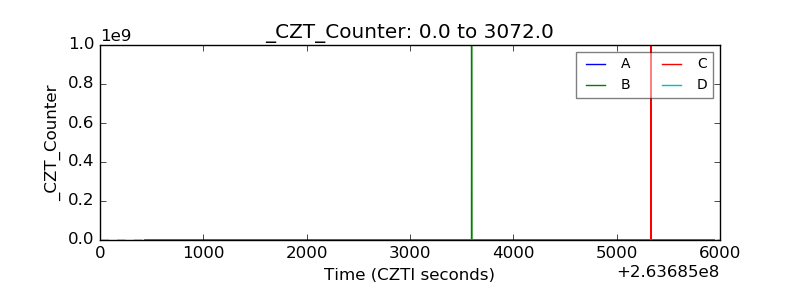 |
| +2.5 Volts monitor |  |
| +5 Volts monitor | 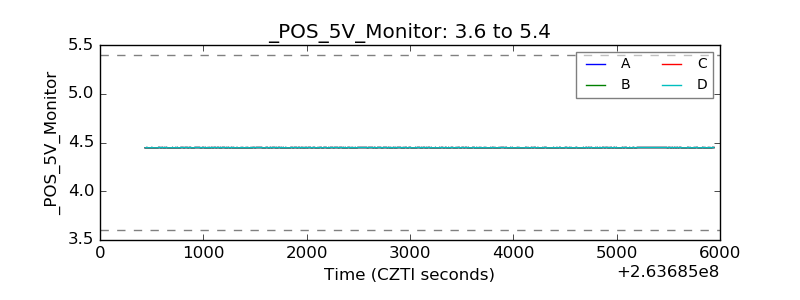 |
| _ROLL_ROT | 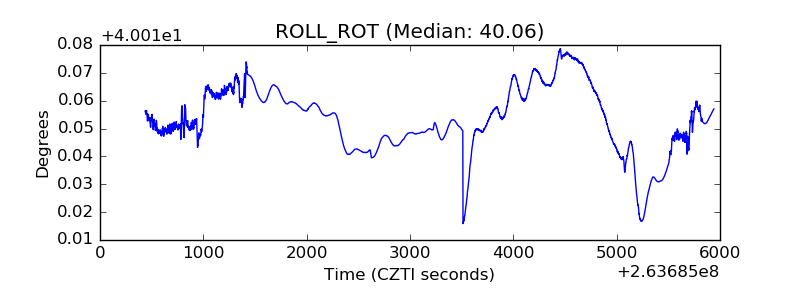 |
| _Roll_DEC | 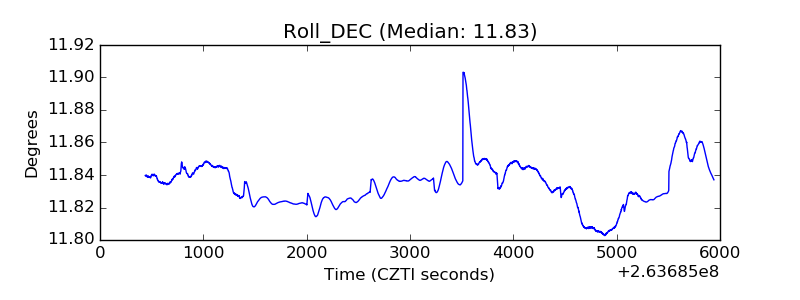 |
| _Roll_RA | 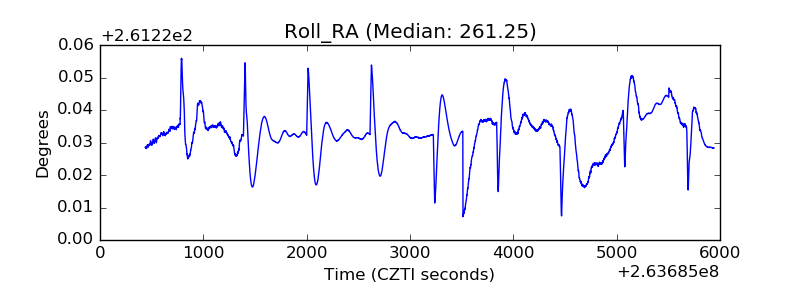 |
| Veto Counter | 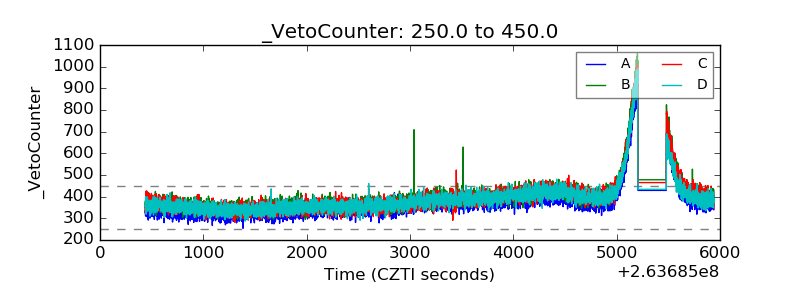 |