| Param | Original file | Final file |
|---|---|---|
| Filename | modeM0/AS1G08_068T01_9000002090cztM0_level2.fits | modeM0/AS1G08_068T01_9000002090cztM0_level2_quad_clean.evt |
| Size (bytes) | 217,995,840 | 182,975,040 |
| Size | 207.9 MB | 174.5 MB |
| Events in quadrant A | 1,335,986 | 1,044,388 |
| Events in quadrant B | 1,282,758 | 1,091,400 |
| Events in quadrant C | 1,295,680 | 963,104 |
| Events in quadrant D | 1,087,852 | 842,126 |
| Mode M9 | |||
|---|---|---|---|
| Quadrant | BADHDUFLAG | Total packets | Discarded packets |
| A | 0 | 23 | 0 |
| B | 0 | 23 | 0 |
| C | 0 | 23 | 0 |
| D | 0 | 23 | 0 |
| Mode M0 | |||
|---|---|---|---|
| Quadrant | BADHDUFLAG | Total packets | Discarded packets |
| A | 0 | 47467 | 0 |
| B | 0 | 49237 | 0 |
| C | 0 | 48676 | 0 |
| D | 0 | 65307 | 0 |
| Mode SS | |||
|---|---|---|---|
| Quadrant | BADHDUFLAG | Total packets | Discarded packets |
| A | 0 | 472 | 0 |
| B | 0 | 472 | 0 |
| C | 0 | 472 | 0 |
| D | 0 | 472 | 0 |
| Quadrant | Total seconds | Saturated seconds | Saturation percentage |
|---|---|---|---|
| A | 23236 | 131 | 0.563780% |
| B | 23236 | 164 | 0.705801% |
| C | 23236 | 92 | 0.395937% |
| D | 23236 | 1759 | 7.570150% |
Noise dominated data is calculated using 1-second bins in cleaned event files. If a bin has >2000 counts, and if more than 50% of those come from <1% of pixels, then it is considered to be noise-dominated and hence unusable.
| Quadrant | # 1 sec bins | Bins with >0 counts | Bins with >2000 counts | High rate bins dominated by noise | Noise dominated (total time) | Noise dominated (detector-on time) | Marked lightcurve |
|---|---|---|---|---|---|---|---|
| A | 28741 | 23237 | 0 | 0 | 0.00% | 0.00% |  |
| B | 28741 | 23237 | 0 | 0 | 0.00% | 0.00% |  |
| C | 28741 | 23237 | 0 | 0 | 0.00% | 0.00% |  |
| D | 28741 | 23089 | 0 | 0 | 0.00% | 0.00% |  |
Top three noisy pixels from each quadrant. If the there are fewer than three noisy pixels in the level2.evt file, extra rows are filled as -1
| Pixel properties | Quadrant properties | ||||||
|---|---|---|---|---|---|---|---|
| Quadrant | DetID | PixID | Counts | Sigma | Mean | Median | Sigma |
| A | 14 | 188 | 1357 | 11.68 | 346 | 324 | 88.5 |
| A | 0 | 29 | 1319 | 11.25 | 346 | 324 | 88.5 |
| A | 7 | 110 | 1120 | 9.0 | 346 | 324 | 88.5 |
| B | 2 | 9 | 1092 | 11.04 | 338 | 321 | 69.9 |
| B | 14 | 254 | 880 | 8.0 | 338 | 321 | 69.9 |
| B | 3 | 17 | 856 | 7.66 | 338 | 321 | 69.9 |
| C | 1 | 81 | 1009 | 7.64 | 341 | 317 | 90.5 |
| C | 12 | 241 | 967 | 7.18 | 341 | 317 | 90.5 |
| C | 1 | 80 | 961 | 7.11 | 341 | 317 | 90.5 |
| D | 6 | 231 | 782 | 5.92 | 310 | 282 | 84.5 |
| D | 3 | 14 | 770 | 5.77 | 310 | 282 | 84.5 |
| D | 6 | 38 | 765 | 5.71 | 310 | 282 | 84.5 |
Histogram calculated using DETX and DETY for each event in the final _common_clean file
| Quadrant A |  |
 |
Quadrant B |
|---|---|---|---|
| Quadrant D | 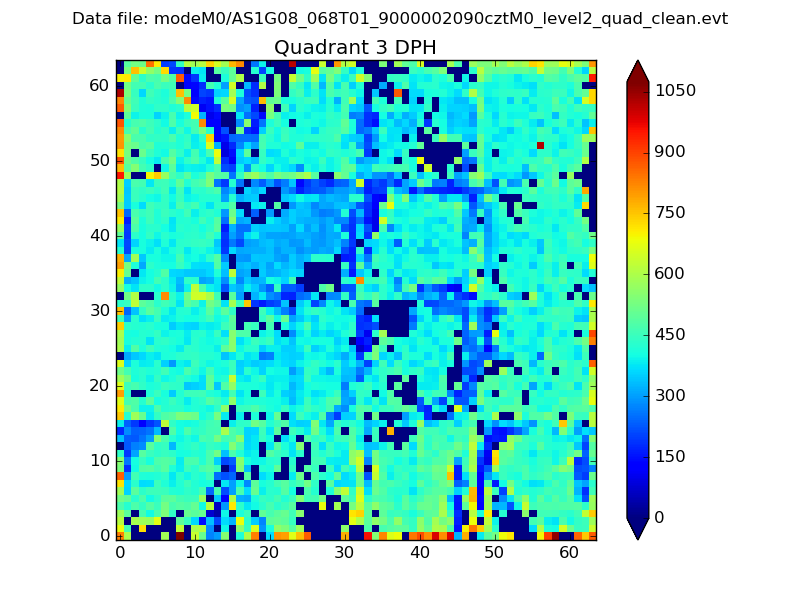 |
 |
Quadrant C |
| Plot type | Count rate plots | Images |
|---|---|---|
| Comparison with Poisson distribution Blue bars denote a histogram of data divided into 1 sec bins. Red curve is a Poisson curve with rate = median count rate of data. |
 |
 |
| Quadrant-wise count rates Data is divided into 100 sec bins |
 |
|
| Module-wise count rates for Quadrant A Data is divided into 100 sec bins |
 |
 |
| Module-wise count rates for Quadrant B Data is divided into 100 sec bins |
 |
 |
| Module-wise count rates for Quadrant C Data is divided into 100 sec bins |
 |
 |
| Module-wise count rates for Quadrant D Data is divided into 100 sec bins |
 |
 |
| Parameter | Plot |
|---|---|
| CZT HV Monitor |  |
| D_VDD |  |
| Temperature 1 |  |
| Veto HV Monitor |  |
| Veto LLD |  |
| Alpha Counter |  |
| _CPM_Rate |  |
| CZT Counter |  |
| +2.5 Volts monitor |  |
| +5 Volts monitor |  |
| _ROLL_ROT |  |
| _Roll_DEC |  |
| _Roll_RA |  |
| Veto Counter |  |