| Param | Original file | Final file |
|---|---|---|
| Filename | modeM0/AS1G08_068T01_9000002090_14150cztM0_level2.evt | modeM0/AS1G08_068T01_9000002090_14150cztM0_level2_quad_clean.evt |
| Size (bytes) | 157,884,480 | 37,702,080 |
| Size | 150.6 MB | 36.0 MB |
| Events in quadrant A | 1,005,030 | 255,000 |
| Events in quadrant B | 1,031,458 | 272,090 |
| Events in quadrant C | 1,097,833 | 244,304 |
| Events in quadrant D | 1,505,249 | 221,264 |
| Mode M9 | |||
|---|---|---|---|
| Quadrant | BADHDUFLAG | Total packets | Discarded packets |
| A | 0 | 5 | 2 |
| B | 0 | 6 | 3 |
| C | 0 | 7 | 4 |
| D | 0 | 5 | 3 |
| Mode M0 | |||
|---|---|---|---|
| Quadrant | BADHDUFLAG | Total packets | Discarded packets |
| A | 0 | 7344 | 3091 |
| B | 0 | 7428 | 3122 |
| C | 0 | 7770 | 3443 |
| D | 0 | 9772 | 4049 |
| Mode SS | |||
|---|---|---|---|
| Quadrant | BADHDUFLAG | Total packets | Discarded packets |
| A | 0 | 71 | 35 |
| B | 0 | 72 | 24 |
| C | 0 | 71 | 31 |
| D | 0 | 71 | 27 |
| Quadrant | Total seconds | Saturated seconds | Saturation percentage |
|---|---|---|---|
| A | 2077 | 1 | 0.048146% |
| B | 2087 | 5 | 0.239578% |
| C | 2030 | 4 | 0.197044% |
| D | 1966 | 29 | 1.475076% |
Noise dominated data is calculated using 1-second bins in cleaned event files. If a bin has >2000 counts, and if more than 50% of those come from <1% of pixels, then it is considered to be noise-dominated and hence unusable.
| Quadrant | # 1 sec bins | Bins with >0 counts | Bins with >2000 counts | High rate bins dominated by noise | Noise dominated (total time) | Noise dominated (detector-on time) | Marked lightcurve |
|---|---|---|---|---|---|---|---|
| A | 3946 | 2430 | 0 | 0 | 0.00% | 0.00% |  |
| B | 3957 | 2427 | 0 | 0 | 0.00% | 0.00% | 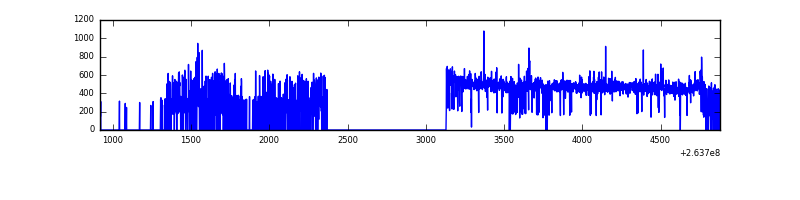 |
| C | 3961 | 2376 | 1 | 1 | 0.03% | 0.04% | 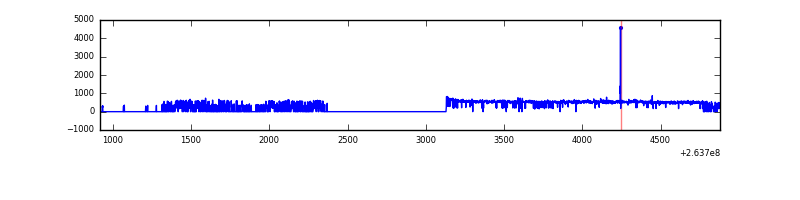 |
| D | 3877 | 2331 | 15 | 15 | 0.39% | 0.64% | 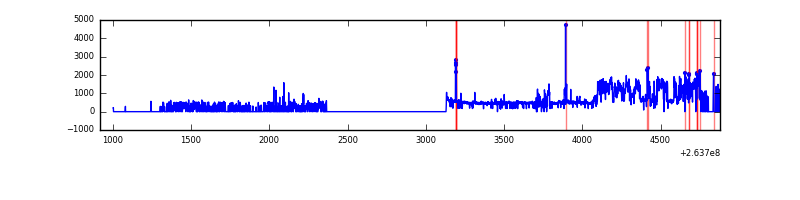 |
Top three noisy pixels from each quadrant. If the there are fewer than three noisy pixels in the level2.evt file, extra rows are filled as -1
| Pixel properties | Quadrant properties | ||||||
|---|---|---|---|---|---|---|---|
| Quadrant | DetID | PixID | Counts | Sigma | Mean | Median | Sigma |
| A | 12 | 189 | 25357 | 478.21 | 251 | 246 | 52.5 |
| A | 8 | 15 | 9806 | 182.06 | 251 | 246 | 52.5 |
| A | 0 | 226 | 2142 | 36.11 | 251 | 246 | 52.5 |
| B | 0 | 189 | 10948 | 210.66 | 256 | 251 | 50.8 |
| B | 3 | 209 | 5826 | 109.79 | 256 | 251 | 50.8 |
| B | 12 | 111 | 5728 | 107.86 | 256 | 251 | 50.8 |
| C | 3 | 233 | 156069 | 2700.09 | 240 | 240 | 57.7 |
| C | 14 | 234 | 5957 | 99.06 | 240 | 240 | 57.7 |
| C | 13 | 61 | 1682 | 24.99 | 240 | 240 | 57.7 |
| D | 10 | 157 | 575708 | 10445.01 | 227 | 222 | 55.1 |
| D | 15 | 0 | 21513 | 386.43 | 227 | 222 | 55.1 |
| D | 1 | 52 | 18630 | 334.1 | 227 | 222 | 55.1 |
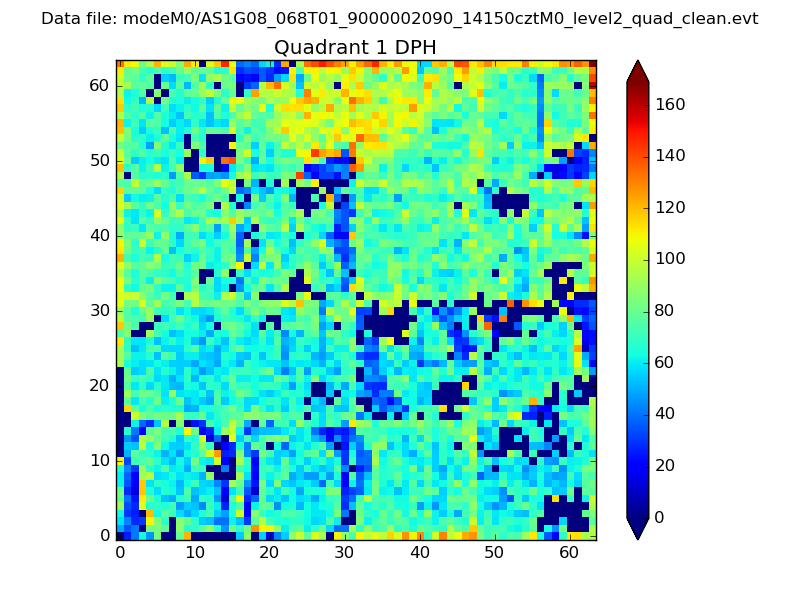
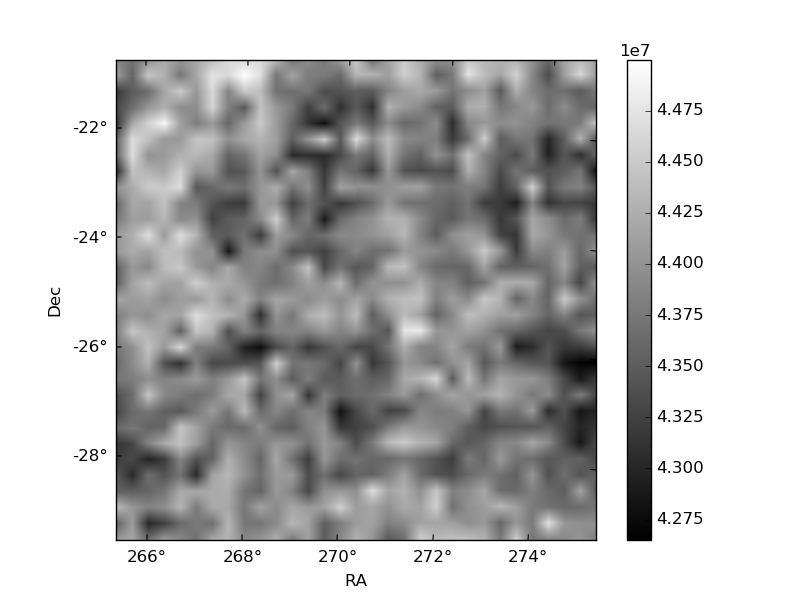
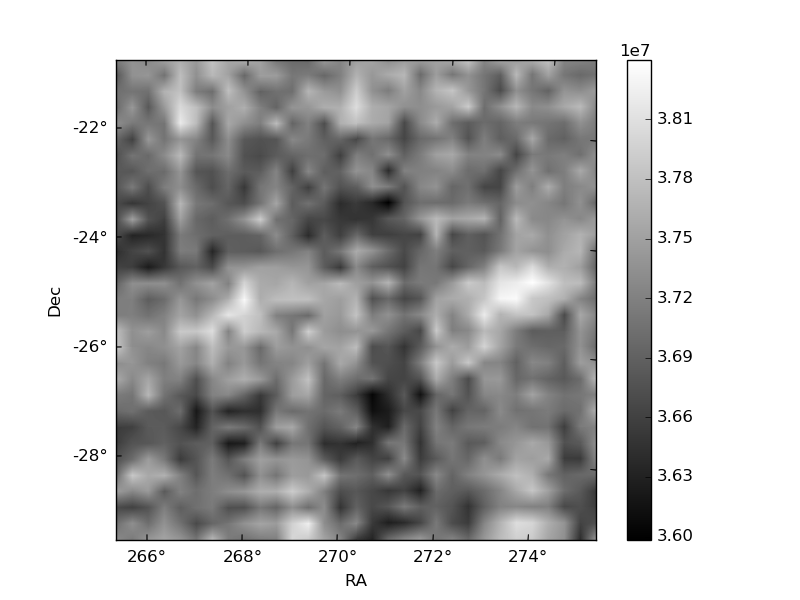
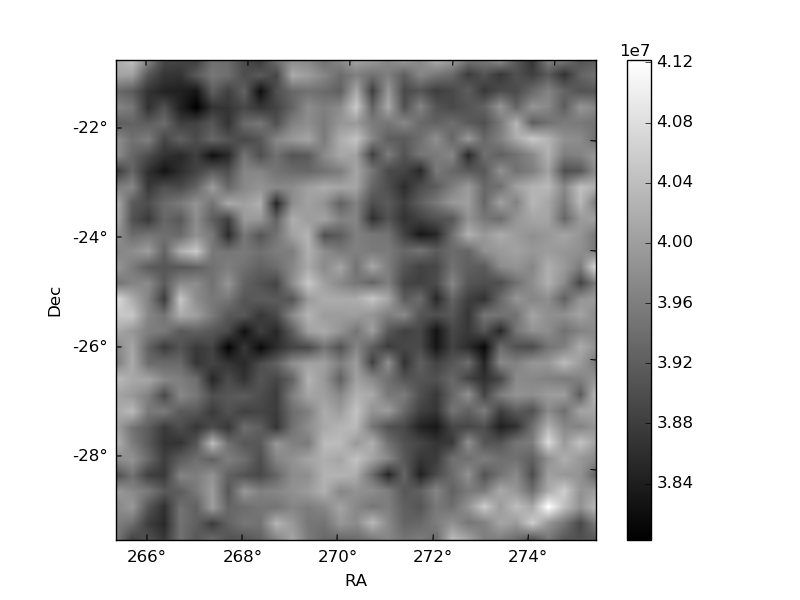
Histogram calculated using DETX and DETY for each event in the final _common_clean file
| Quadrant A |  |
 |
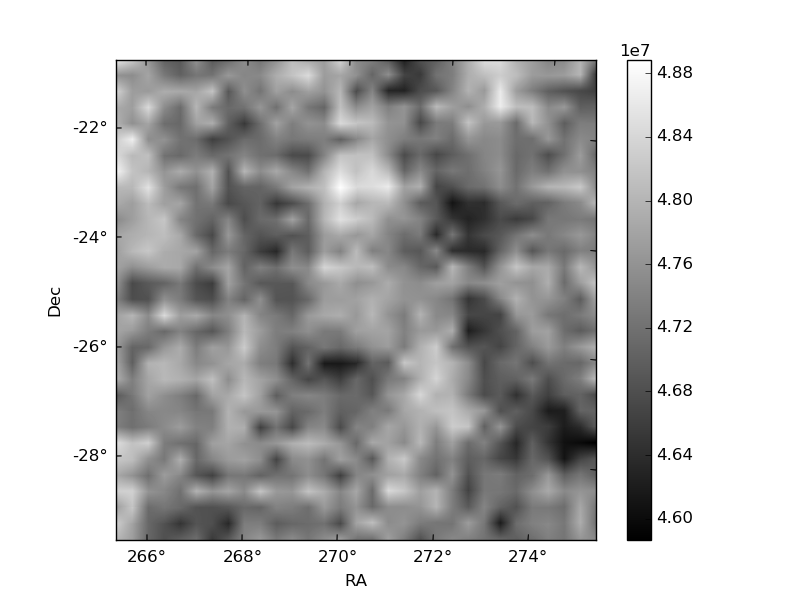
Quadrant B |
|---|---|---|---|
| Quadrant D |  |
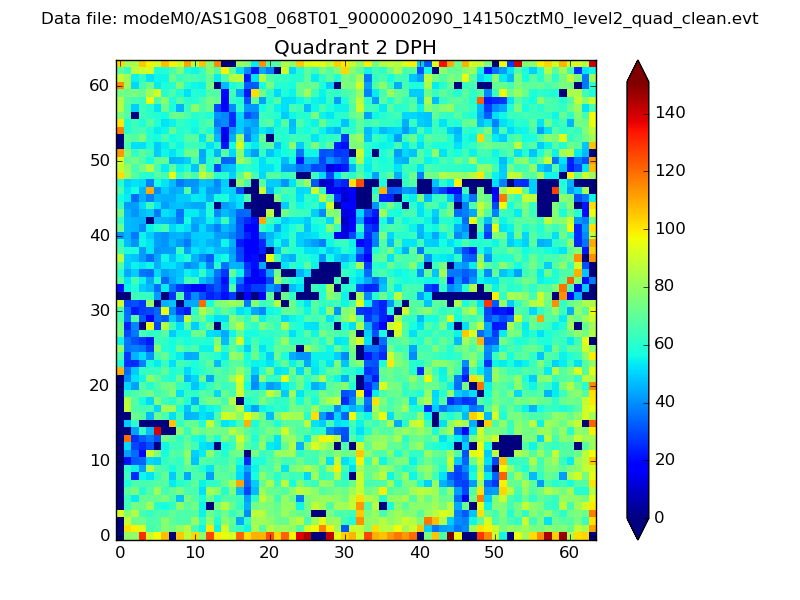 |
Quadrant C |
| Plot type | Count rate plots | Images |
|---|---|---|
| Comparison with Poisson distribution Blue bars denote a histogram of data divided into 1 sec bins. Red curve is a Poisson curve with rate = median count rate of data. |
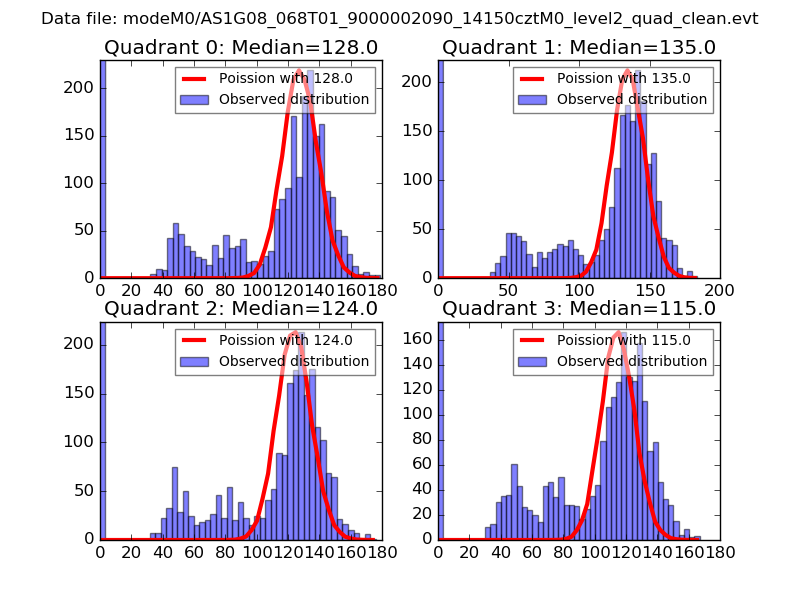 |
 |
| Quadrant-wise count rates Data is divided into 100 sec bins |
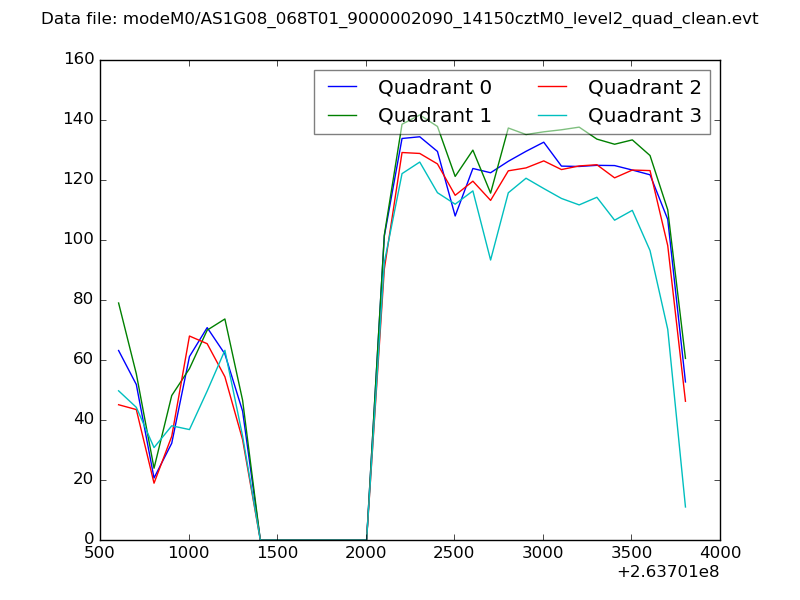 |
|
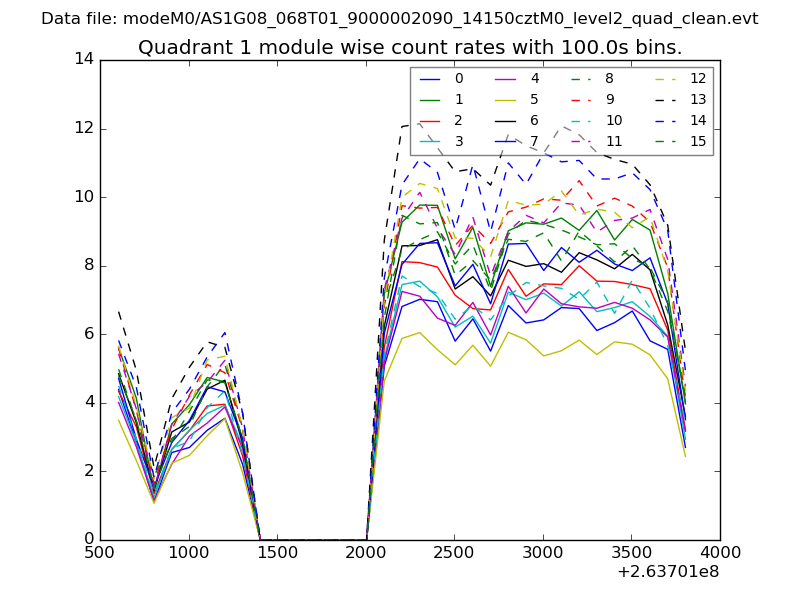
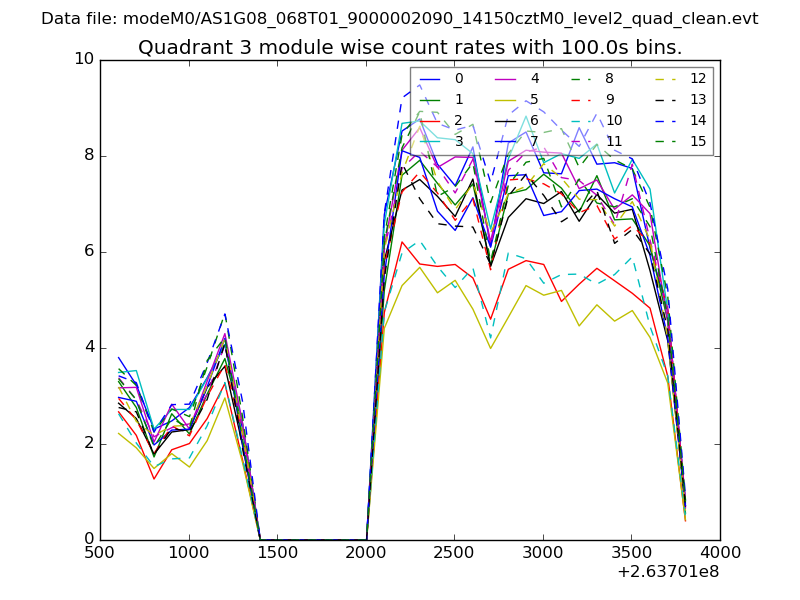
| Module-wise count rates for Quadrant A Data is divided into 100 sec bins |
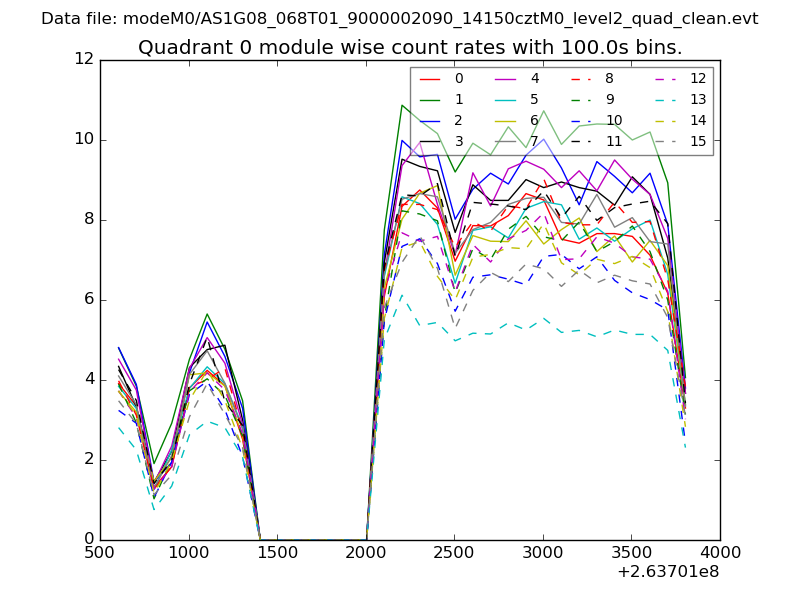 |
 |
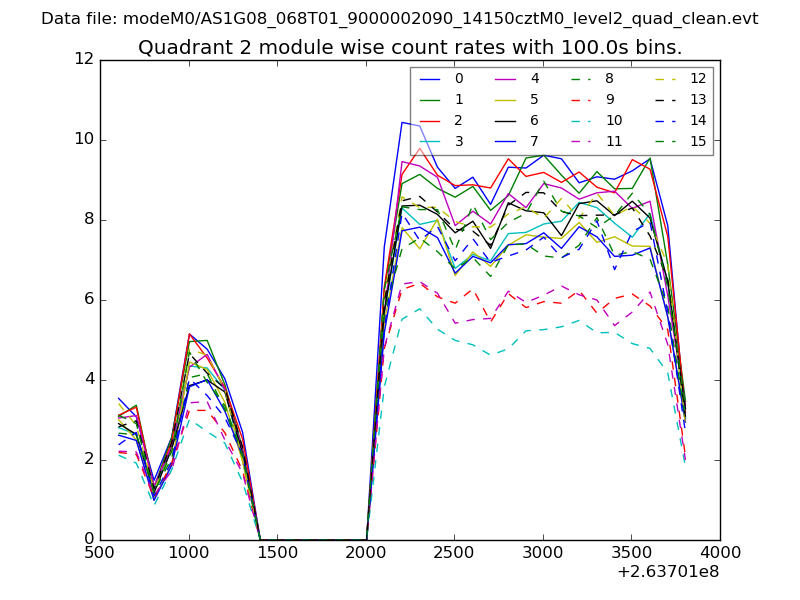
| Module-wise count rates for Quadrant B Data is divided into 100 sec bins |
 |
 |
| Module-wise count rates for Quadrant C Data is divided into 100 sec bins |
 |
 |
| Module-wise count rates for Quadrant D Data is divided into 100 sec bins |
 |
 |
| Parameter | Plot |
|---|---|
| CZT HV Monitor | 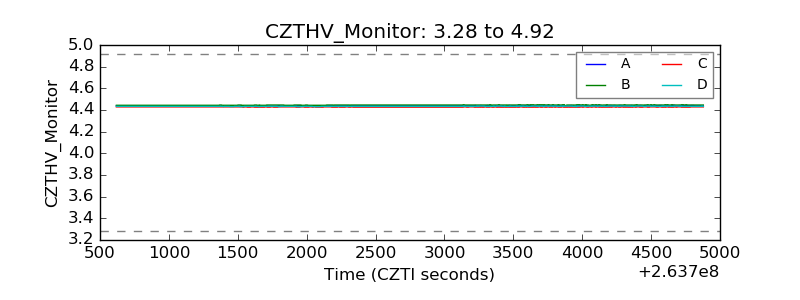 |
| D_VDD | 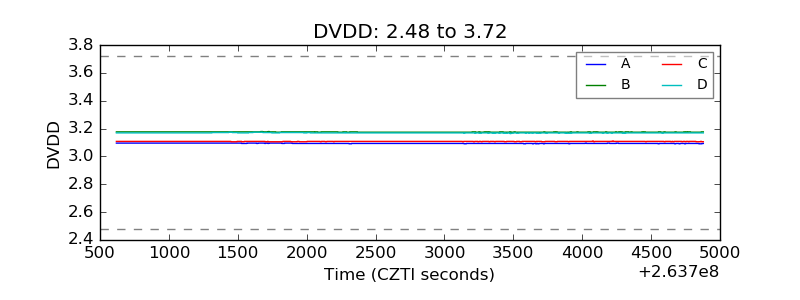 |
| Temperature 1 | 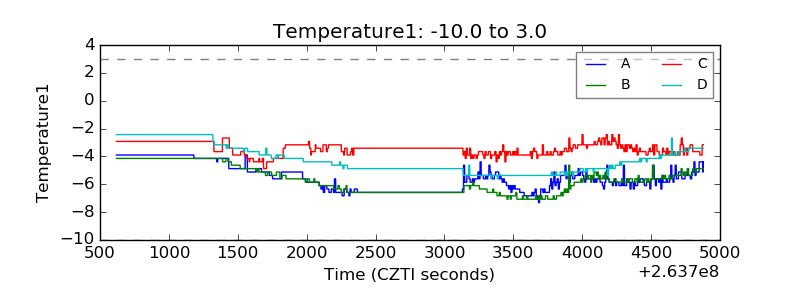 |
| Veto HV Monitor | 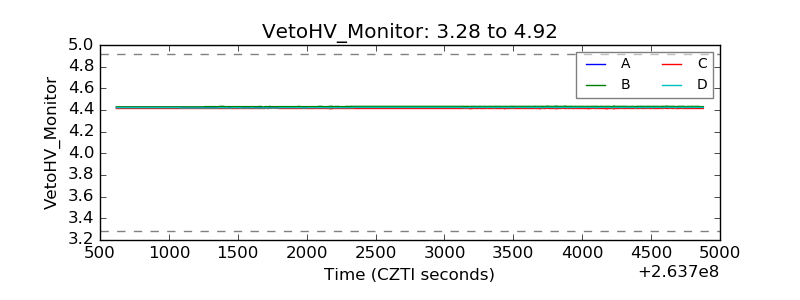 |
| Veto LLD | 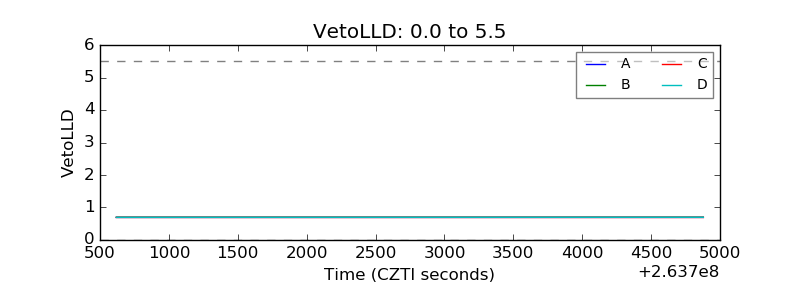 |
| Alpha Counter | 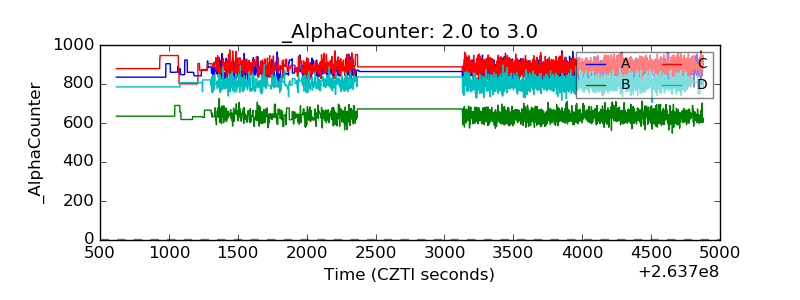 |
| _CPM_Rate | 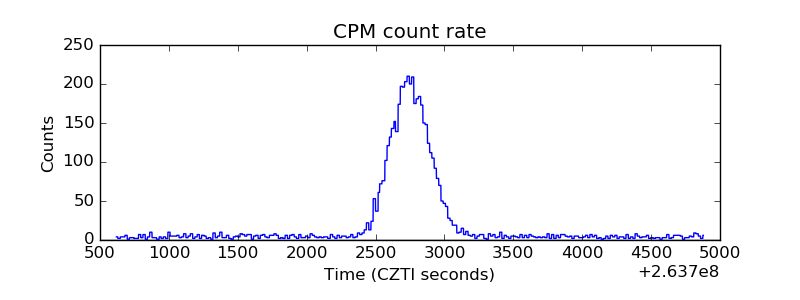 |
| CZT Counter |  |
| +2.5 Volts monitor |  |
| +5 Volts monitor | 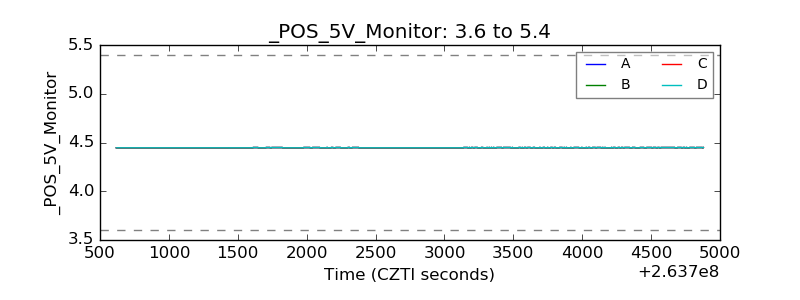 |
| _ROLL_ROT | 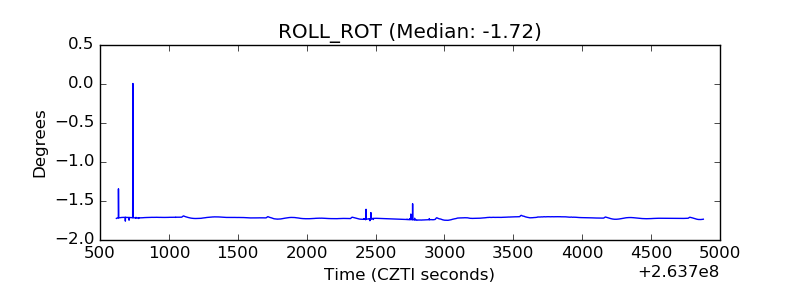 |
| _Roll_DEC | 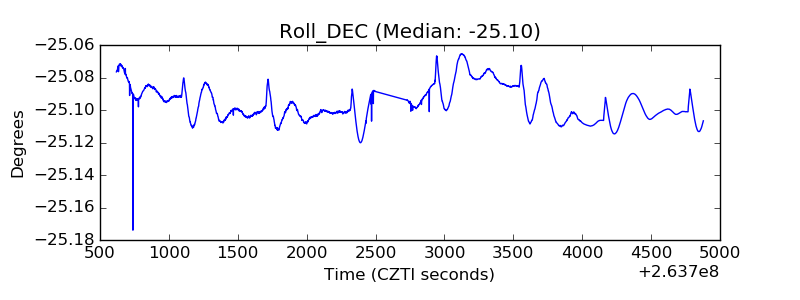 |
| _Roll_RA |  |
| Veto Counter | 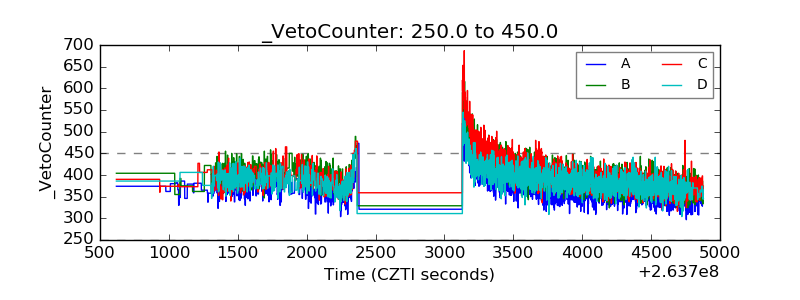 |