| Param | Original file | Final file |
|---|---|---|
| Filename | modeM0/AS1G08_068T01_9000002090_14151cztM0_level2.evt | modeM0/AS1G08_068T01_9000002090_14151cztM0_level2_quad_clean.evt |
| Size (bytes) | 1,539,089,280 | 241,868,160 |
| Size | 1.4 GB | 230.7 MB |
| Events in quadrant A | 9,595,513 | 1,510,955 |
| Events in quadrant B | 10,175,066 | 1,581,951 |
| Events in quadrant C | 10,501,912 | 1,464,769 |
| Events in quadrant D | 14,977,709 | 1,378,914 |
| Mode M9 | |||
|---|---|---|---|
| Quadrant | BADHDUFLAG | Total packets | Discarded packets |
| A | 0 | 23 | 0 |
| B | 0 | 23 | 0 |
| C | 0 | 23 | 0 |
| D | 0 | 23 | 0 |
| Mode M0 | |||
|---|---|---|---|
| Quadrant | BADHDUFLAG | Total packets | Discarded packets |
| A | 0 | 41286 | 4 |
| B | 0 | 42668 | 3 |
| C | 0 | 42484 | 3 |
| D | 0 | 57792 | 3 |
| Mode SS | |||
|---|---|---|---|
| Quadrant | BADHDUFLAG | Total packets | Discarded packets |
| A | 0 | 410 | 0 |
| B | 0 | 410 | 0 |
| C | 0 | 410 | 0 |
| D | 0 | 410 | 0 |
| Quadrant | Total seconds | Saturated seconds | Saturation percentage |
|---|---|---|---|
| A | 20161 | 130 | 0.644809% |
| B | 20161 | 141 | 0.699370% |
| C | 20161 | 89 | 0.441446% |
| D | 20161 | 1750 | 8.680125% |
Noise dominated data is calculated using 1-second bins in cleaned event files. If a bin has >2000 counts, and if more than 50% of those come from <1% of pixels, then it is considered to be noise-dominated and hence unusable.
| Quadrant | # 1 sec bins | Bins with >0 counts | Bins with >2000 counts | High rate bins dominated by noise | Noise dominated (total time) | Noise dominated (detector-on time) | Marked lightcurve |
|---|---|---|---|---|---|---|---|
| A | 25667 | 20166 | 2 | 2 | 0.01% | 0.01% | 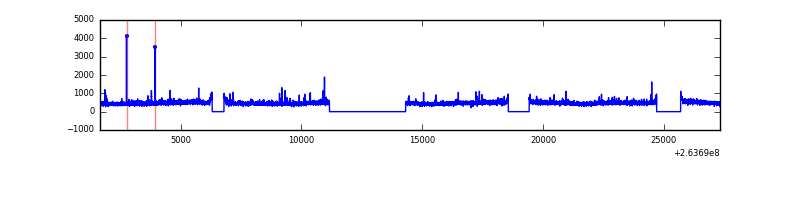 |
| B | 25667 | 20166 | 13 | 13 | 0.05% | 0.06% | 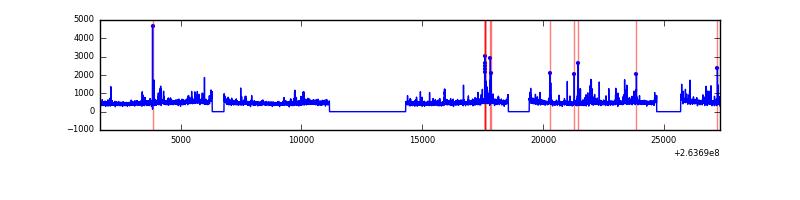 |
| C | 25667 | 20166 | 0 | 0 | 0.00% | 0.00% | 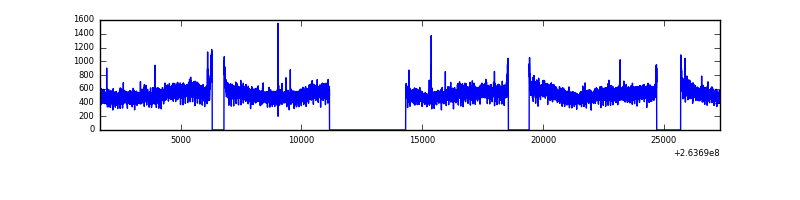 |
| D | 25667 | 20166 | 1302 | 1302 | 5.07% | 6.46% | 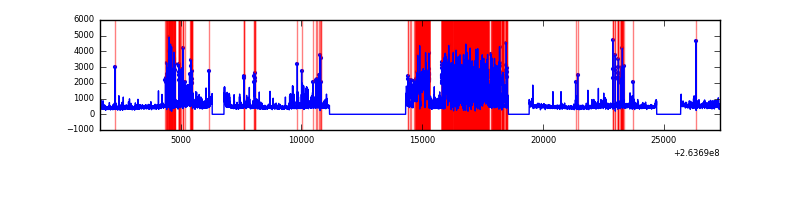 |
Top three noisy pixels from each quadrant. If the there are fewer than three noisy pixels in the level2.evt file, extra rows are filled as -1
| Pixel properties | Quadrant properties | ||||||
|---|---|---|---|---|---|---|---|
| Quadrant | DetID | PixID | Counts | Sigma | Mean | Median | Sigma |
| A | 8 | 15 | 89252 | 176.7 | 2440 | 2390 | 491.6 |
| A | 12 | 189 | 61783 | 120.82 | 2440 | 2390 | 491.6 |
| A | 12 | 96 | 53735 | 104.45 | 2440 | 2390 | 491.6 |
| B | 0 | 189 | 185420 | 396.82 | 2441 | 2389 | 461.2 |
| B | 3 | 209 | 127410 | 271.05 | 2441 | 2389 | 461.2 |
| B | 0 | 85 | 108129 | 229.25 | 2441 | 2389 | 461.2 |
| C | 3 | 233 | 1319288 | 2418.49 | 2354 | 2371 | 544.5 |
| C | 13 | 61 | 16279 | 25.54 | 2354 | 2371 | 544.5 |
| C | 10 | 22 | 10917 | 15.69 | 2354 | 2371 | 544.5 |
| D | 10 | 157 | 4224783 | 7849.89 | 2271 | 2220 | 537.9 |
| D | 1 | 52 | 987010 | 1830.76 | 2271 | 2220 | 537.9 |
| D | 2 | 152 | 263458 | 485.65 | 2271 | 2220 | 537.9 |
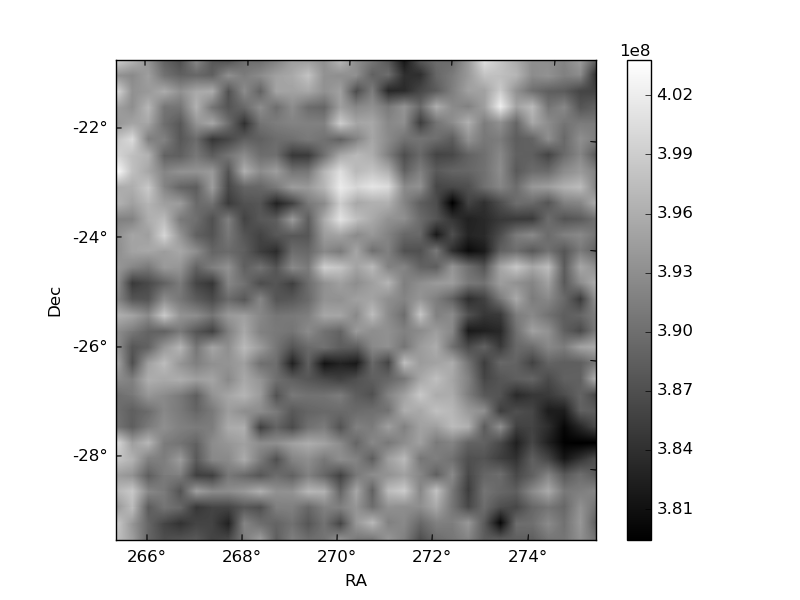
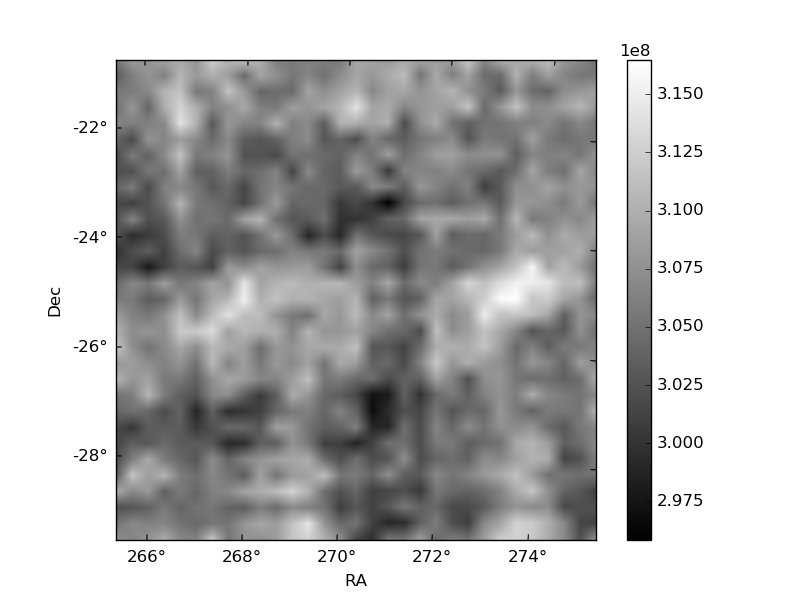
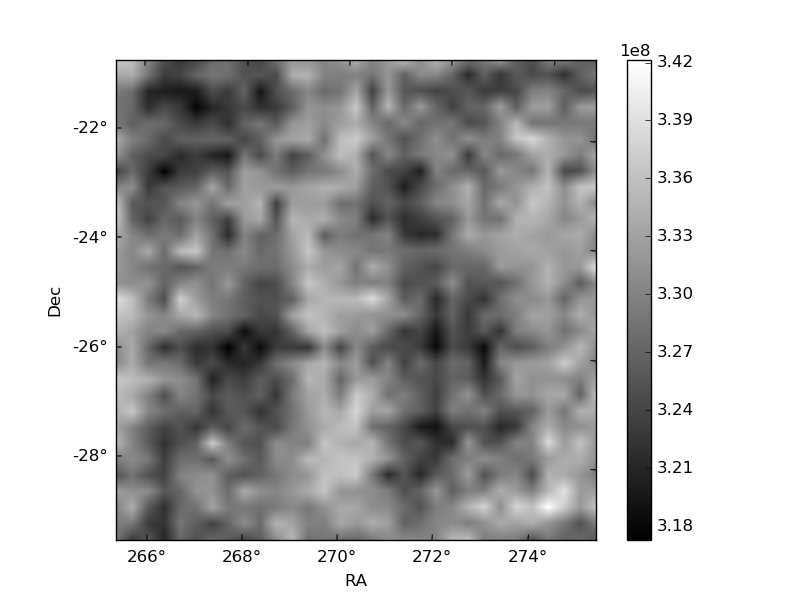
Histogram calculated using DETX and DETY for each event in the final _common_clean file
| Quadrant A | 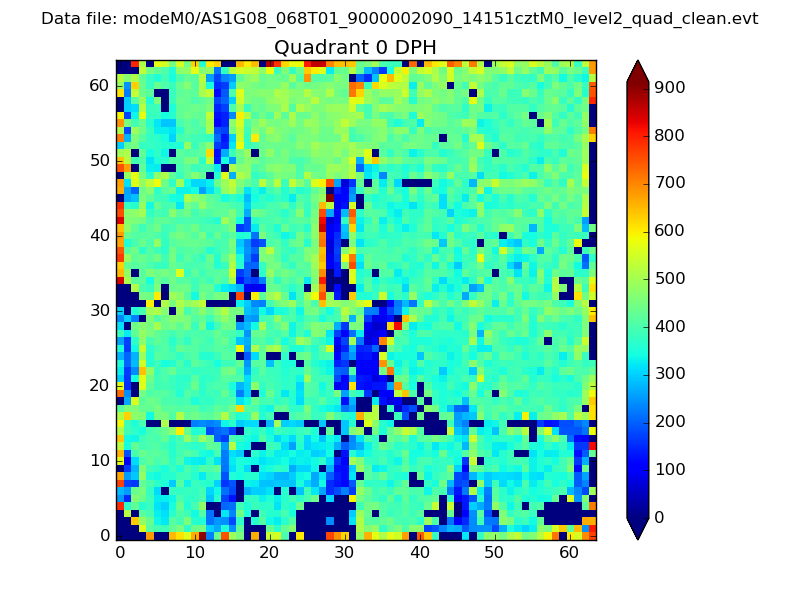 |
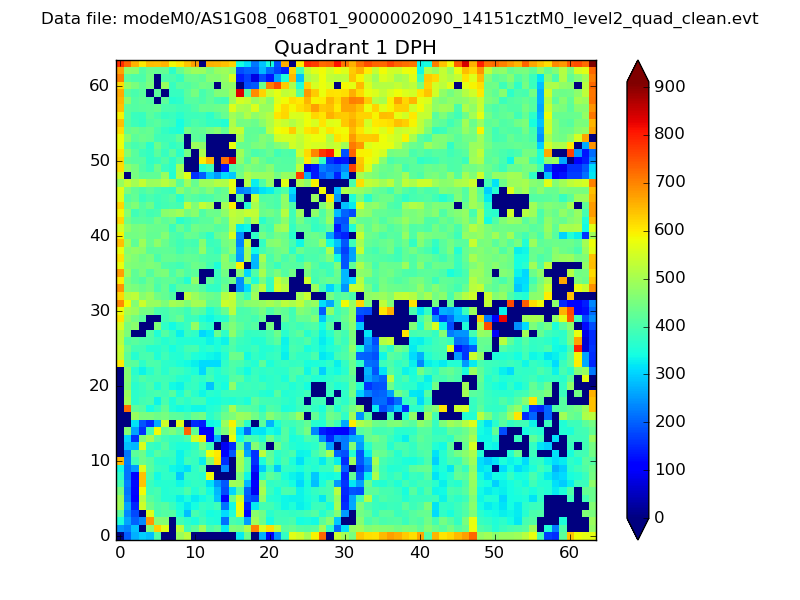 |
Quadrant B |
|---|---|---|---|
| Quadrant D | 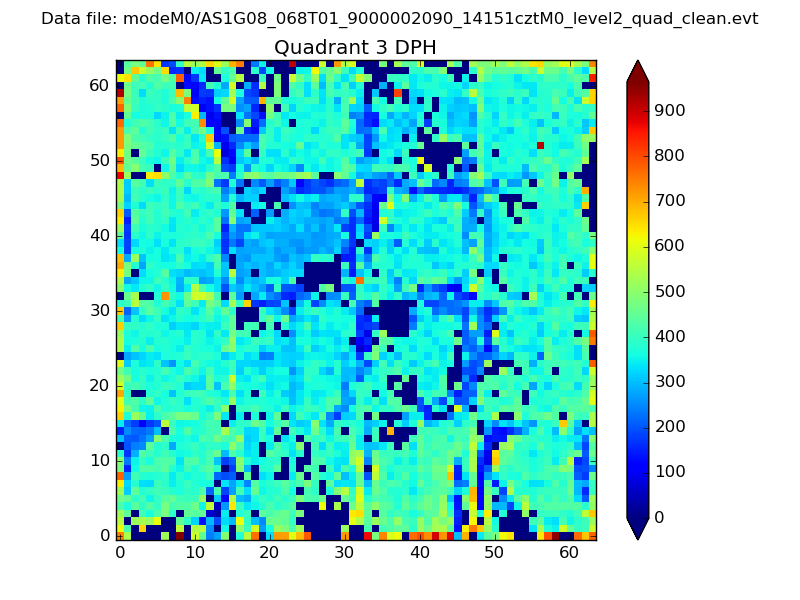 |
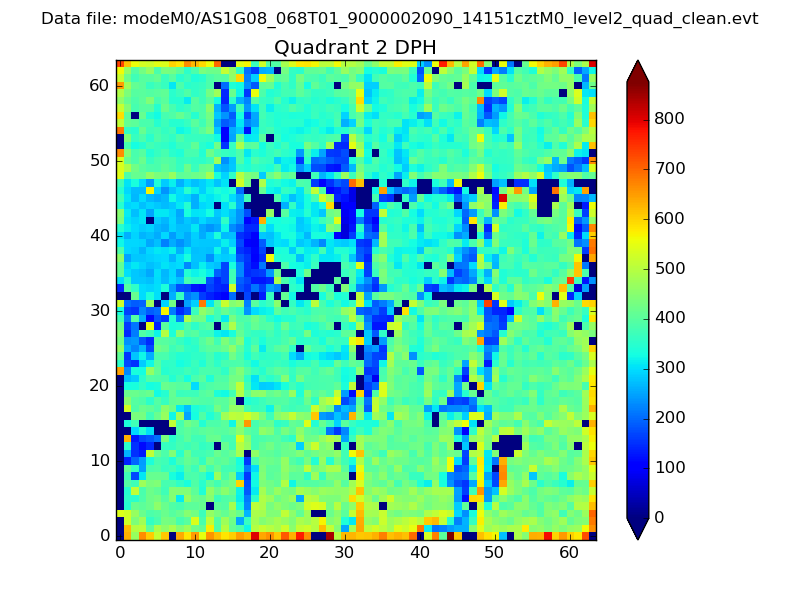 |
Quadrant C |
| Plot type | Count rate plots | Images |
|---|---|---|
| Comparison with Poisson distribution Blue bars denote a histogram of data divided into 1 sec bins. Red curve is a Poisson curve with rate = median count rate of data. |
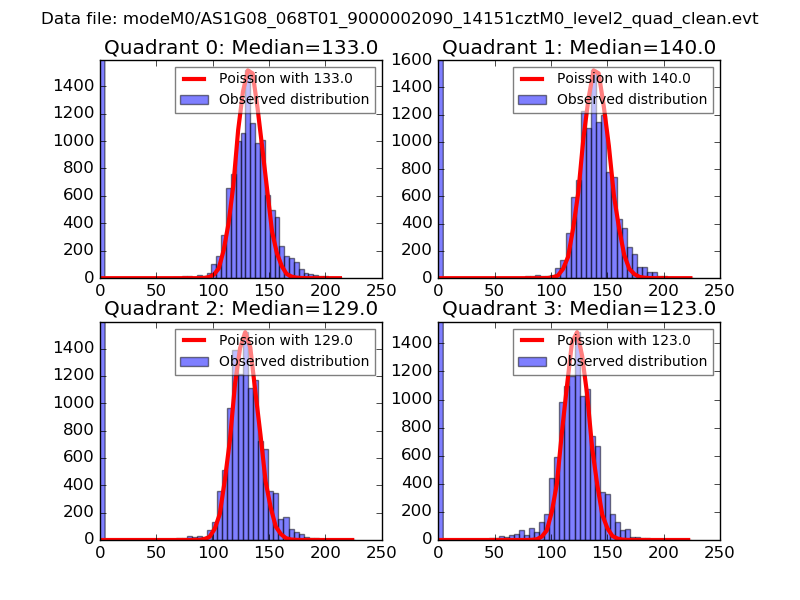 |
 |
| Quadrant-wise count rates Data is divided into 100 sec bins |
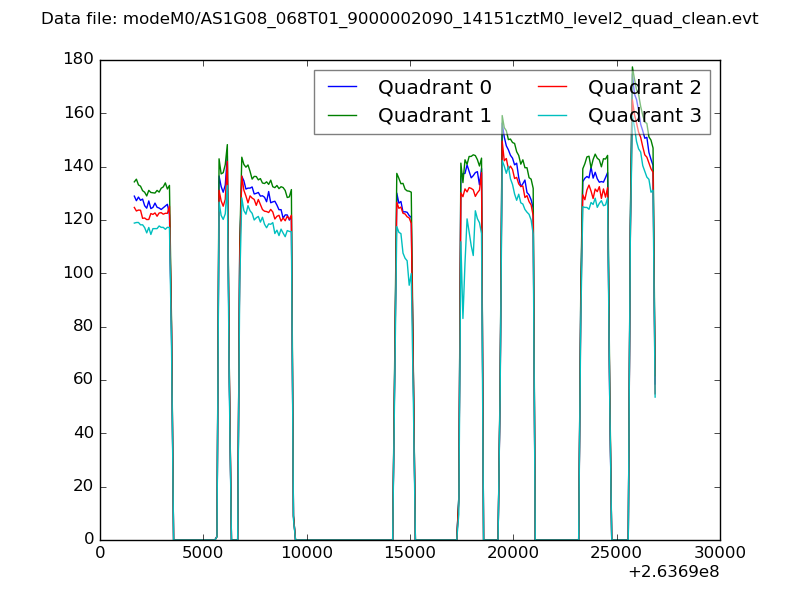 |
|
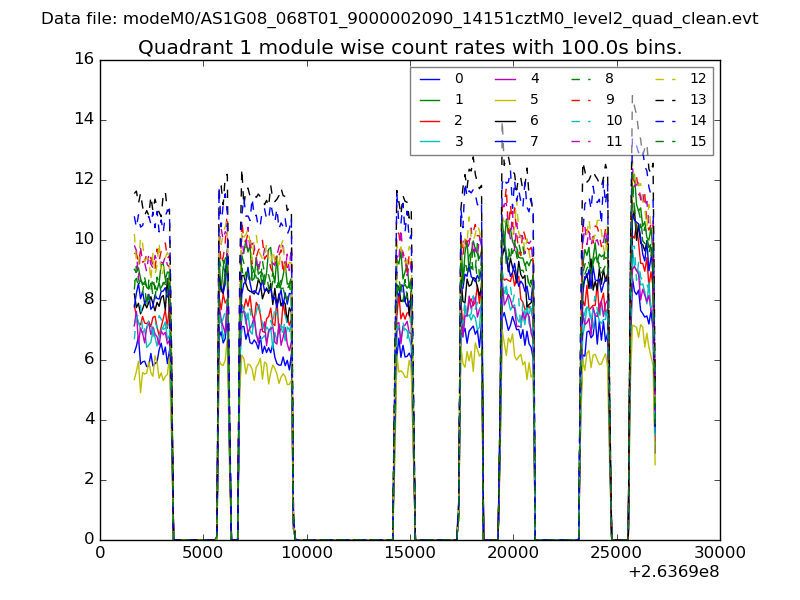
| Module-wise count rates for Quadrant A Data is divided into 100 sec bins |
 |
 |
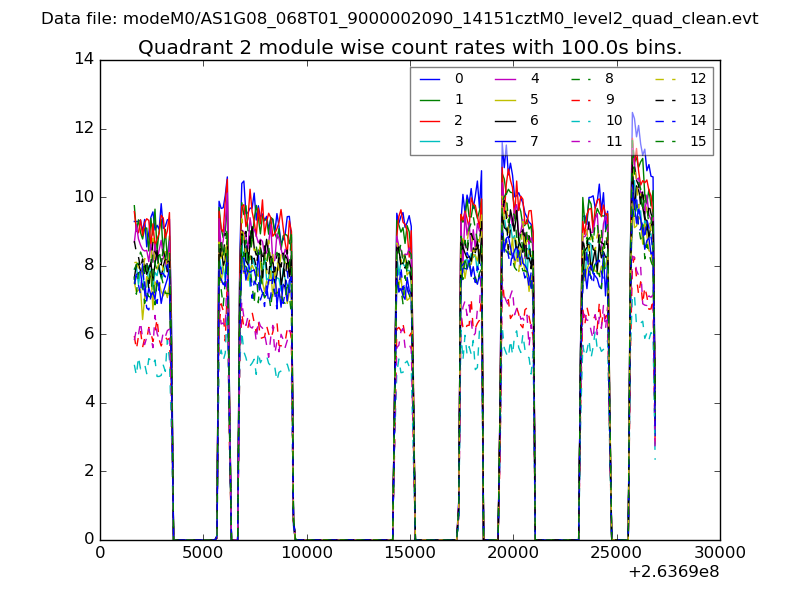
| Module-wise count rates for Quadrant B Data is divided into 100 sec bins |
 |
 |
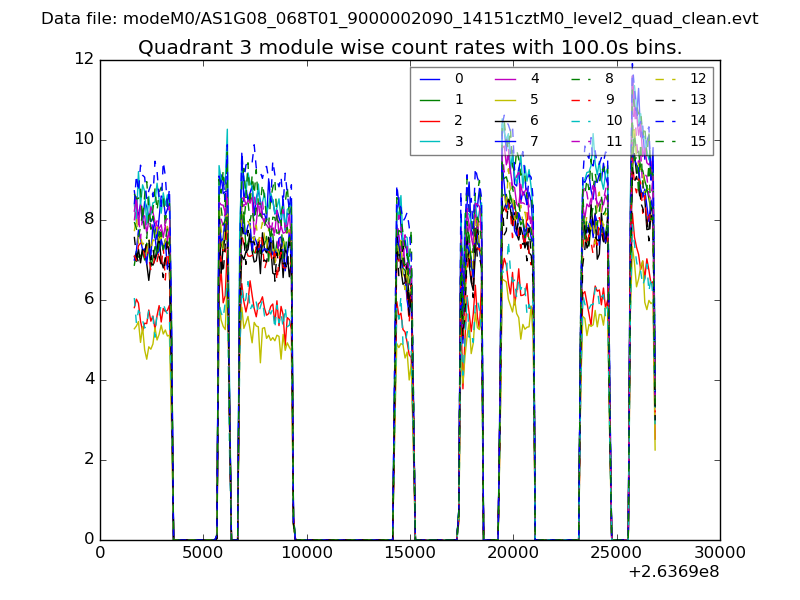
| Module-wise count rates for Quadrant C Data is divided into 100 sec bins |
 |
 |
| Module-wise count rates for Quadrant D Data is divided into 100 sec bins |
 |
 |
| Parameter | Plot |
|---|---|
| CZT HV Monitor | 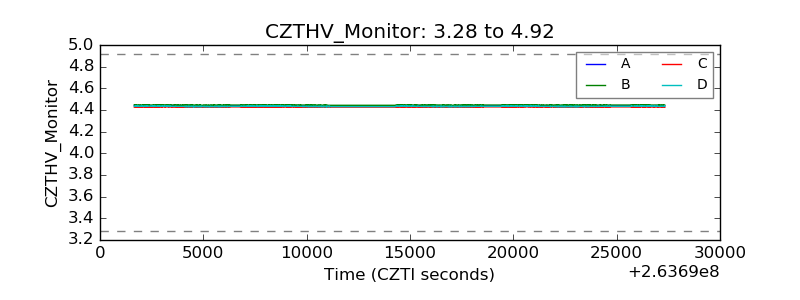 |
| D_VDD | 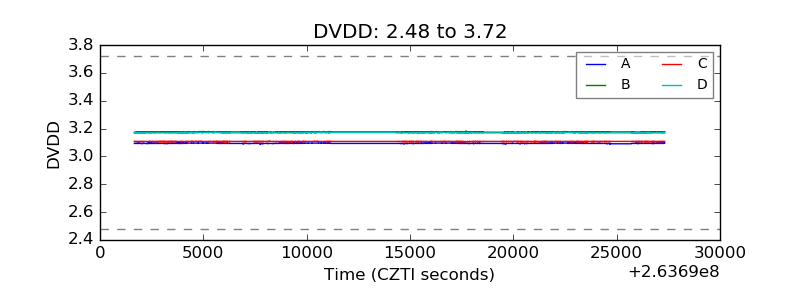 |
| Temperature 1 | 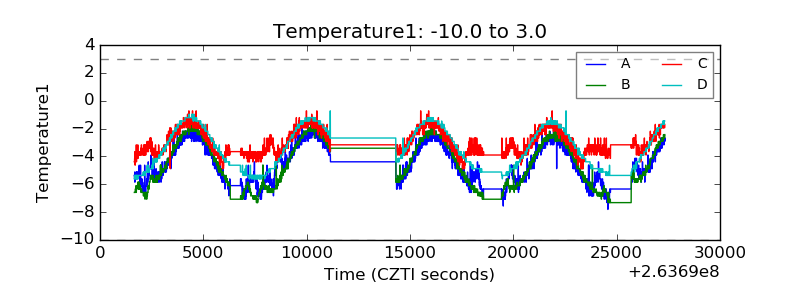 |
| Veto HV Monitor | 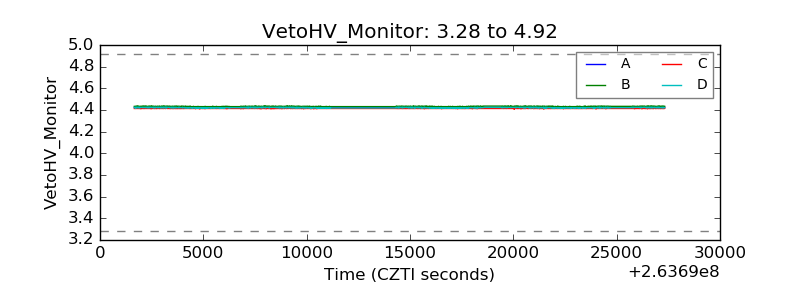 |
| Veto LLD | 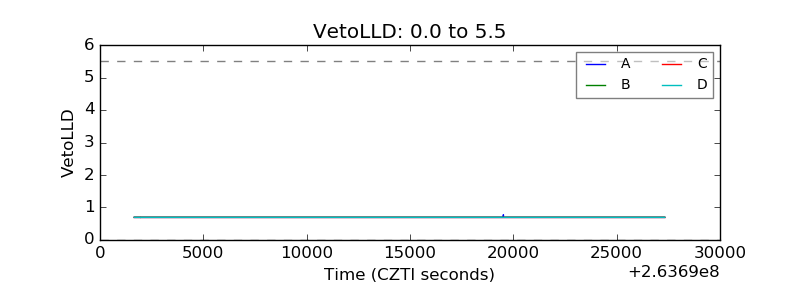 |
| Alpha Counter | 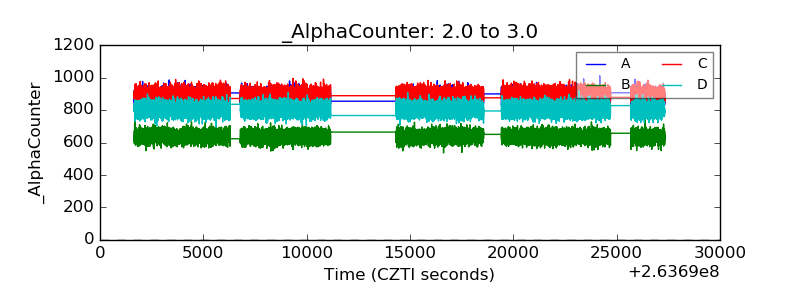 |
| _CPM_Rate | 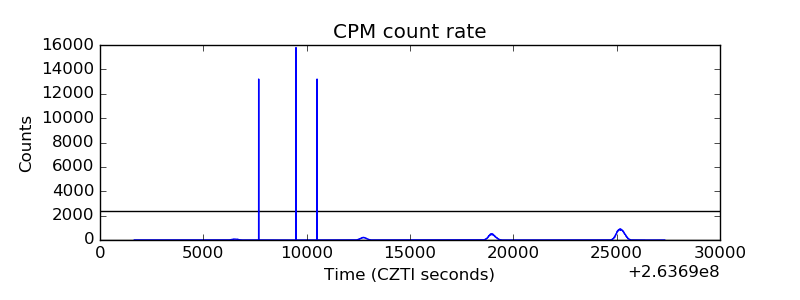 |
| CZT Counter | 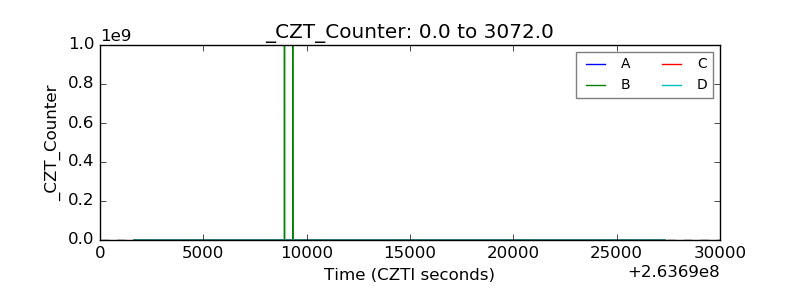 |
| +2.5 Volts monitor | 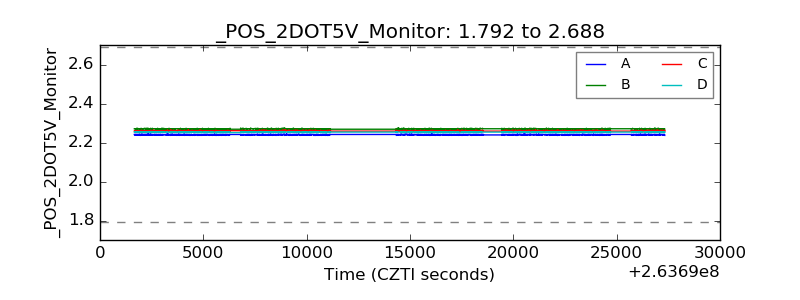 |
| +5 Volts monitor |  |
| _ROLL_ROT | 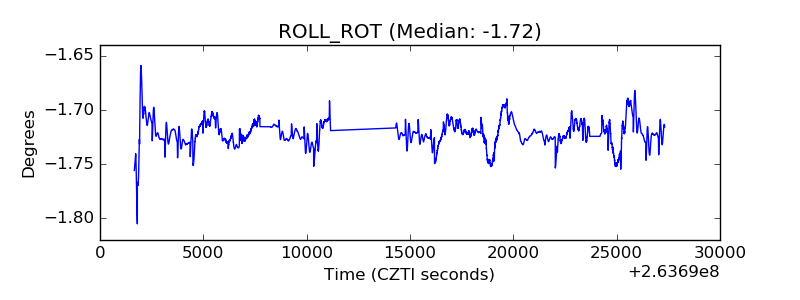 |
| _Roll_DEC | 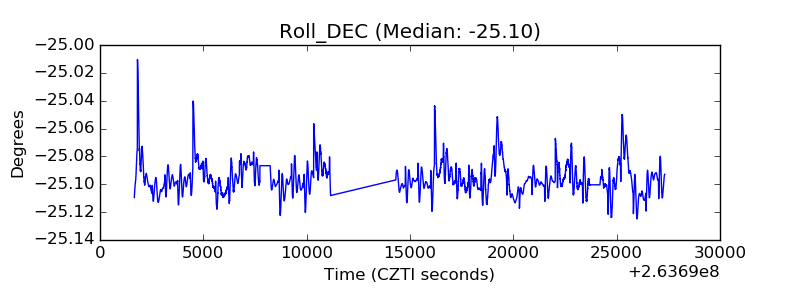 |
| _Roll_RA | 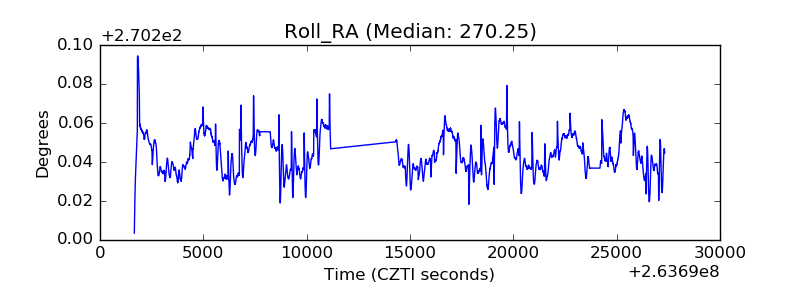 |
| Veto Counter | 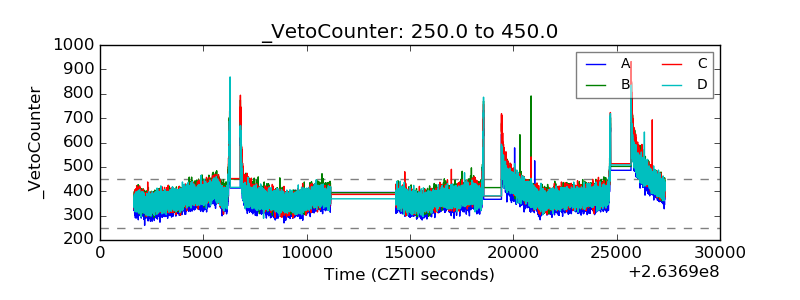 |