| Param | Original file | Final file |
|---|---|---|
| Filename | modeM0/AS1G08_068T01_9000002090_14153cztM0_level2.evt | modeM0/AS1G08_068T01_9000002090_14153cztM0_level2_quad_clean.evt |
| Size (bytes) | 1,383,336,000 | 210,631,680 |
| Size | 1.3 GB | 200.9 MB |
| Events in quadrant A | 8,521,114 | 1,319,411 |
| Events in quadrant B | 9,149,684 | 1,377,984 |
| Events in quadrant C | 9,309,142 | 1,271,437 |
| Events in quadrant D | 13,721,202 | 1,191,947 |
| Mode M9 | |||
|---|---|---|---|
| Quadrant | BADHDUFLAG | Total packets | Discarded packets |
| A | 0 | 26 | 0 |
| B | 0 | 26 | 0 |
| C | 0 | 26 | 0 |
| D | 0 | 26 | 0 |
| Mode M0 | |||
|---|---|---|---|
| Quadrant | BADHDUFLAG | Total packets | Discarded packets |
| A | 0 | 36193 | 3 |
| B | 0 | 37693 | 3 |
| C | 0 | 37420 | 3 |
| D | 0 | 52109 | 3 |
| Mode SS | |||
|---|---|---|---|
| Quadrant | BADHDUFLAG | Total packets | Discarded packets |
| A | 0 | 360 | 0 |
| B | 0 | 360 | 0 |
| C | 0 | 360 | 0 |
| D | 0 | 360 | 0 |
| Quadrant | Total seconds | Saturated seconds | Saturation percentage |
|---|---|---|---|
| A | 17674 | 103 | 0.582777% |
| B | 17674 | 137 | 0.775150% |
| C | 17674 | 81 | 0.458300% |
| D | 17674 | 1604 | 9.075478% |
Noise dominated data is calculated using 1-second bins in cleaned event files. If a bin has >2000 counts, and if more than 50% of those come from <1% of pixels, then it is considered to be noise-dominated and hence unusable.
| Quadrant | # 1 sec bins | Bins with >0 counts | Bins with >2000 counts | High rate bins dominated by noise | Noise dominated (total time) | Noise dominated (detector-on time) | Marked lightcurve |
|---|---|---|---|---|---|---|---|
| A | 20230 | 17678 | 0 | 0 | 0.00% | 0.00% | 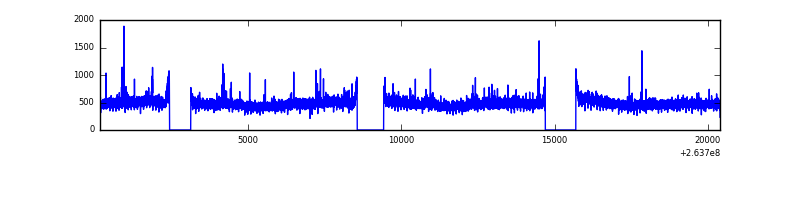 |
| B | 20230 | 17678 | 25 | 25 | 0.12% | 0.14% | 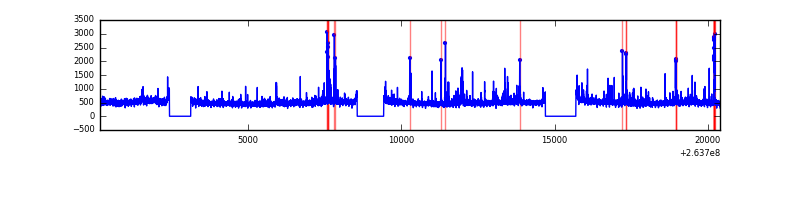 |
| C | 20230 | 17678 | 1 | 1 | 0.00% | 0.01% | 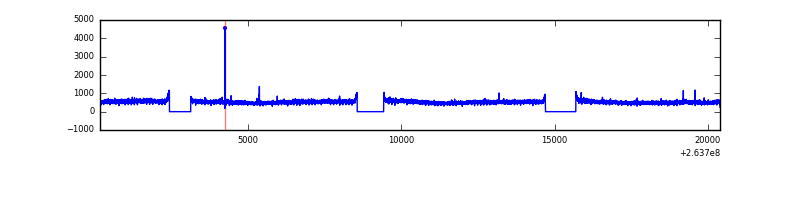 |
| D | 20230 | 17678 | 1206 | 1206 | 5.96% | 6.82% | 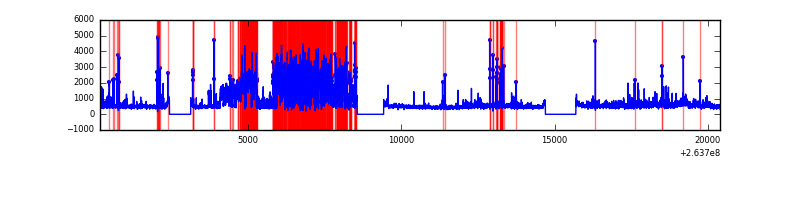 |
Top three noisy pixels from each quadrant. If the there are fewer than three noisy pixels in the level2.evt file, extra rows are filled as -1
| Pixel properties | Quadrant properties | ||||||
|---|---|---|---|---|---|---|---|
| Quadrant | DetID | PixID | Counts | Sigma | Mean | Median | Sigma |
| A | 8 | 15 | 88123 | 196.51 | 2172 | 2125 | 437.6 |
| A | 12 | 189 | 47908 | 104.62 | 2172 | 2125 | 437.6 |
| A | 12 | 96 | 25081 | 52.45 | 2172 | 2125 | 437.6 |
| B | 0 | 85 | 189357 | 455.63 | 2176 | 2129 | 410.9 |
| B | 0 | 189 | 138367 | 331.54 | 2176 | 2129 | 410.9 |
| B | 3 | 209 | 119174 | 284.83 | 2176 | 2129 | 410.9 |
| C | 3 | 233 | 1146141 | 2363.81 | 2091 | 2104 | 484.0 |
| C | 13 | 61 | 14608 | 25.84 | 2091 | 2104 | 484.0 |
| C | 14 | 234 | 12463 | 21.4 | 2091 | 2104 | 484.0 |
| D | 10 | 157 | 4483475 | 9394.12 | 2011 | 1964 | 477.1 |
| D | 12 | 110 | 447204 | 933.31 | 2011 | 1964 | 477.1 |
| D | 1 | 52 | 390260 | 813.94 | 2011 | 1964 | 477.1 |
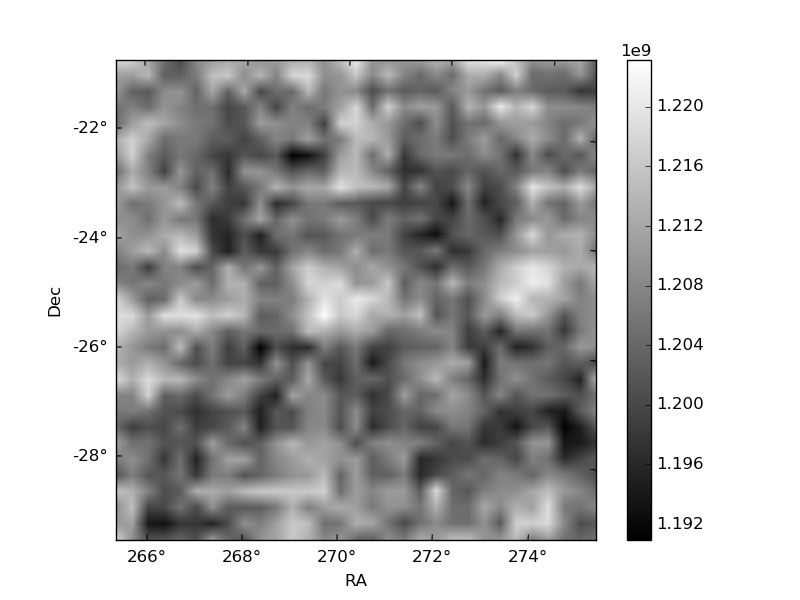
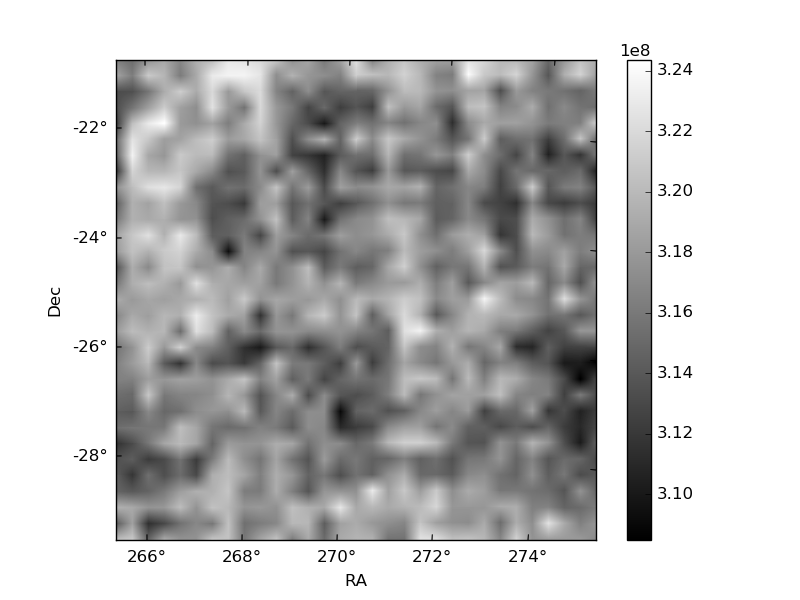
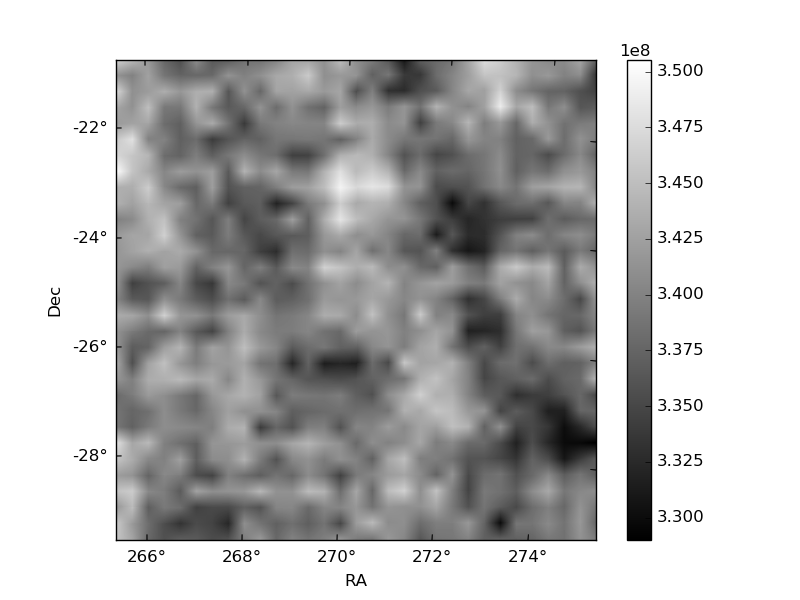
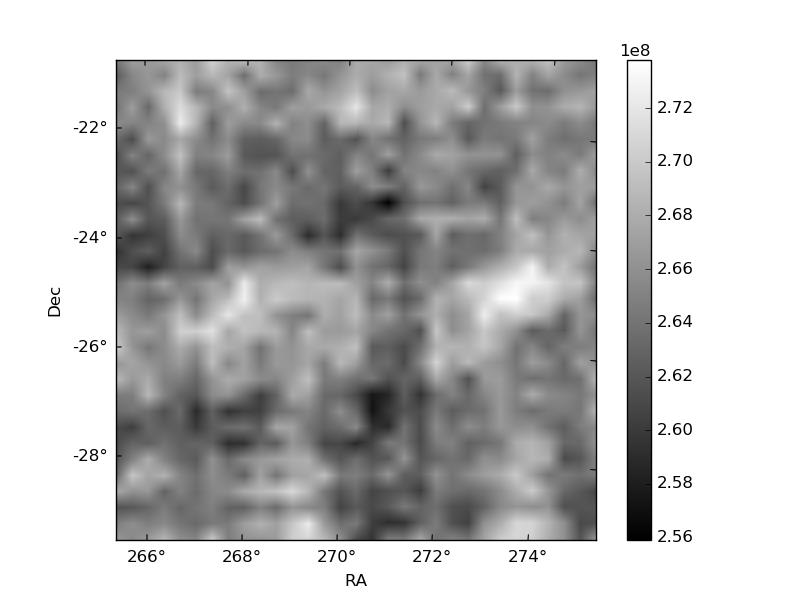
Histogram calculated using DETX and DETY for each event in the final _common_clean file
| Quadrant A | 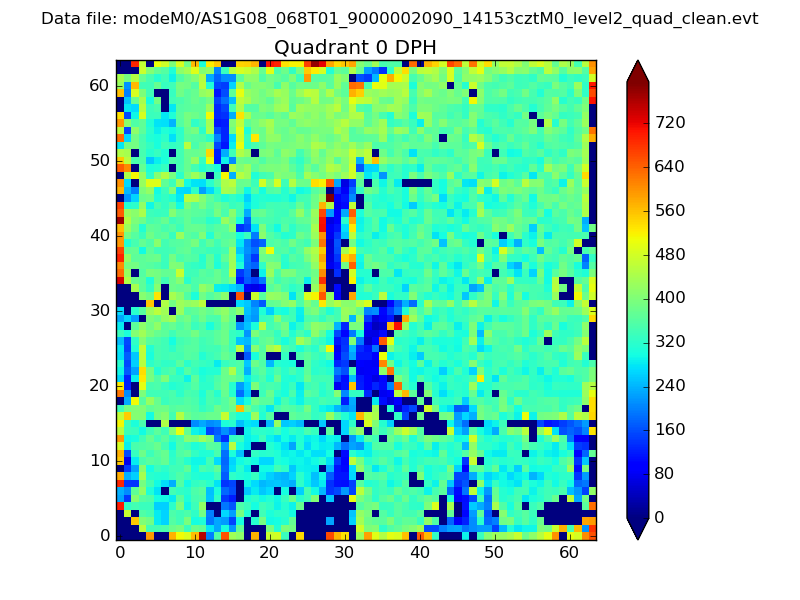 |
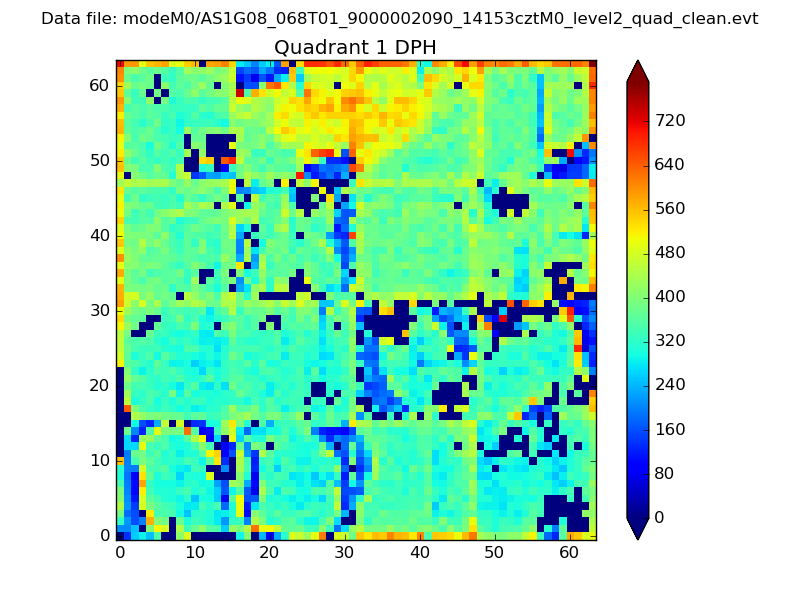 |
Quadrant B |
|---|---|---|---|
| Quadrant D | 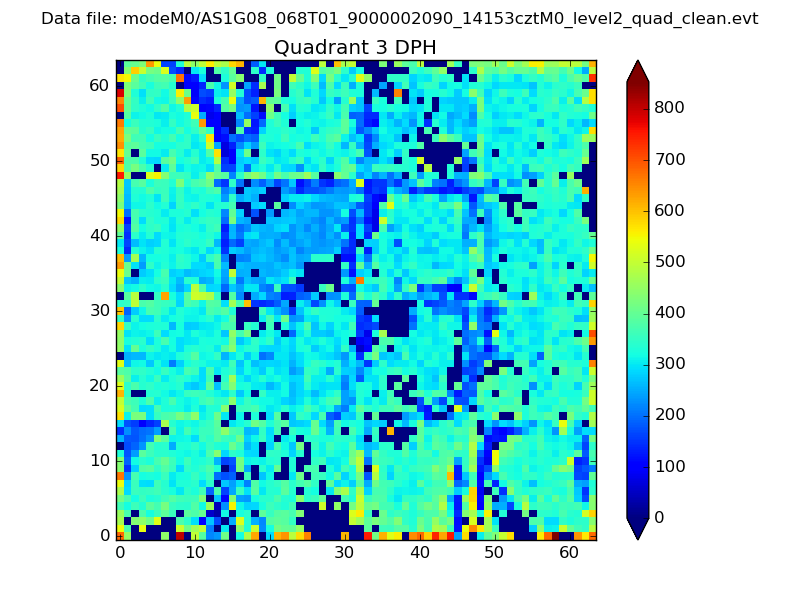 |
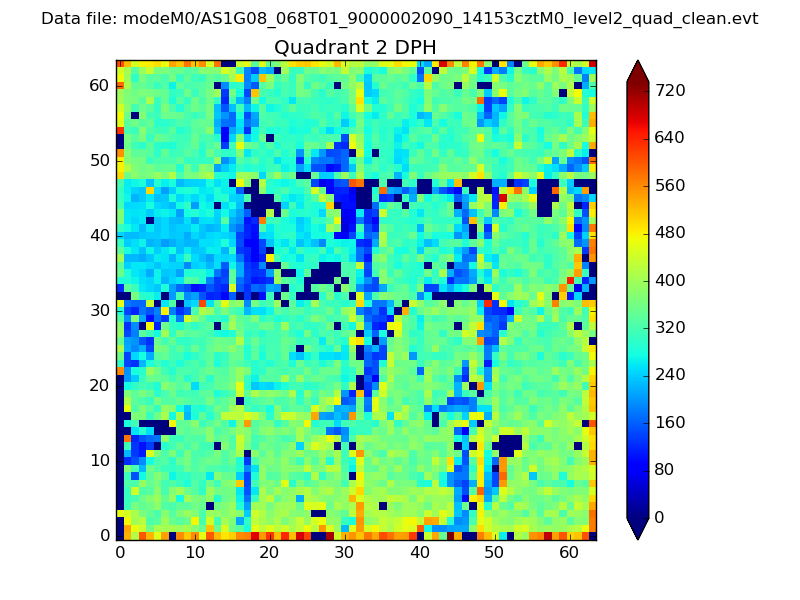 |
Quadrant C |
| Plot type | Count rate plots | Images |
|---|---|---|
| Comparison with Poisson distribution Blue bars denote a histogram of data divided into 1 sec bins. Red curve is a Poisson curve with rate = median count rate of data. |
 |
 |
| Quadrant-wise count rates Data is divided into 100 sec bins |
 |
|
| Module-wise count rates for Quadrant A Data is divided into 100 sec bins |
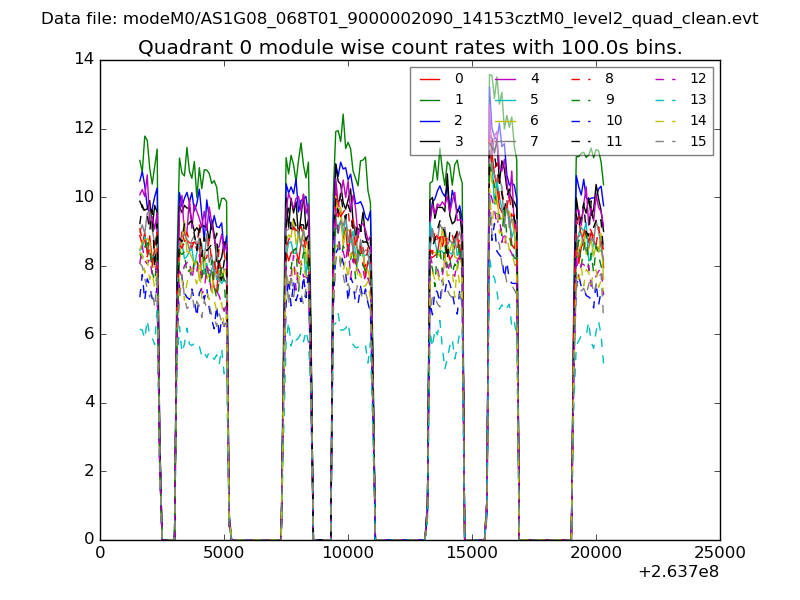 |
 |
| Module-wise count rates for Quadrant B Data is divided into 100 sec bins |
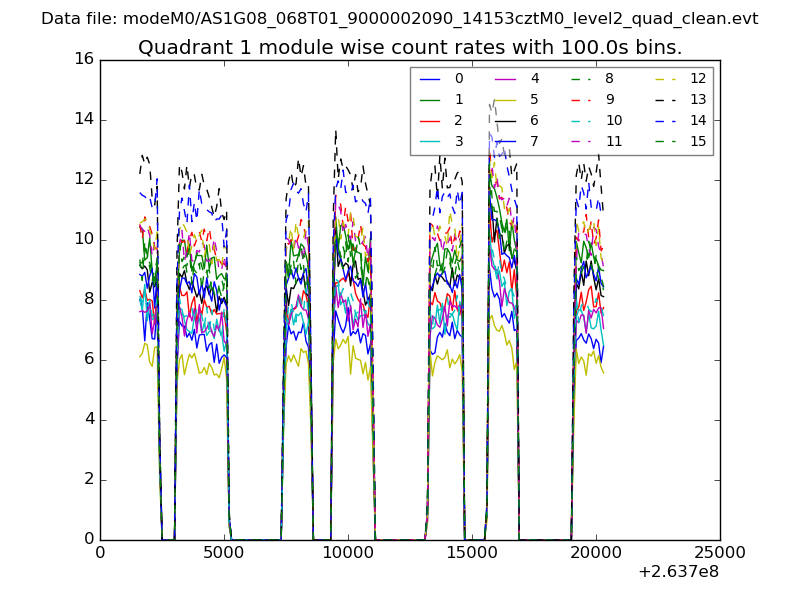 |
 |
| Module-wise count rates for Quadrant C Data is divided into 100 sec bins |
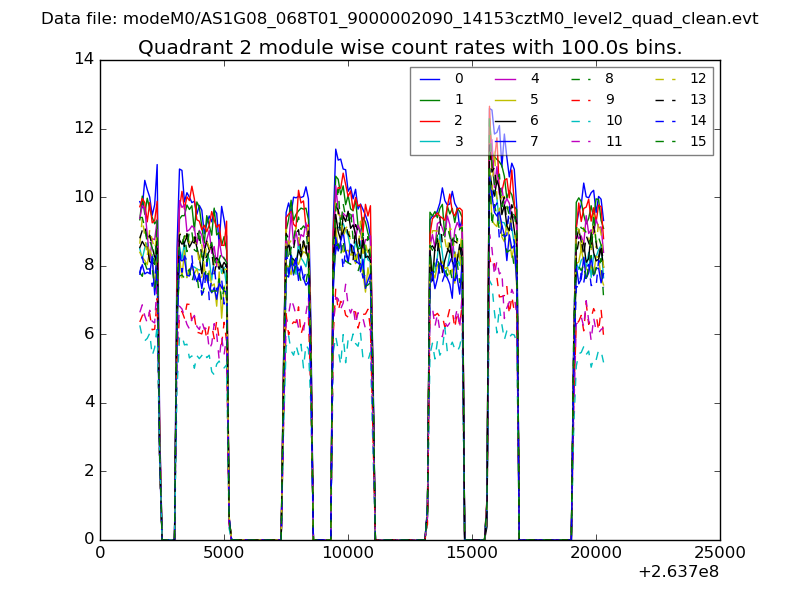 |
 |
| Module-wise count rates for Quadrant D Data is divided into 100 sec bins |
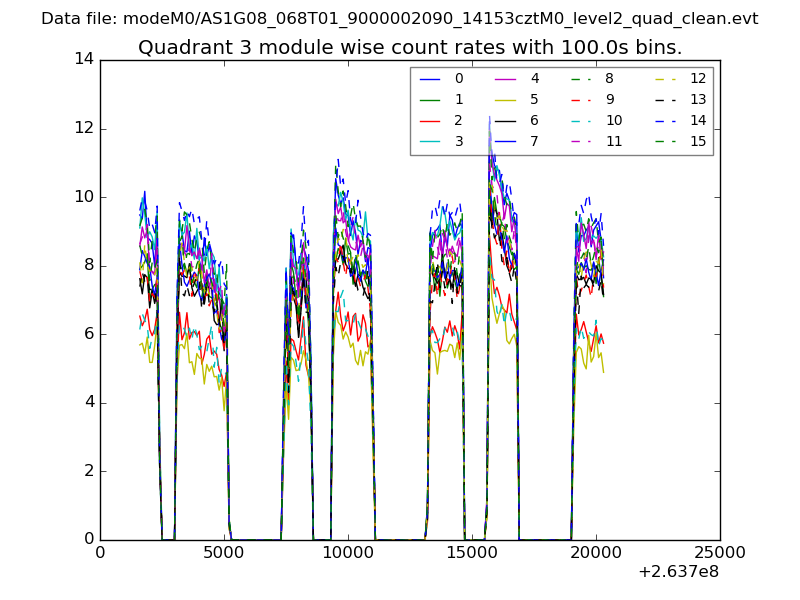 |
 |
| Parameter | Plot |
|---|---|
| CZT HV Monitor |  |
| D_VDD | 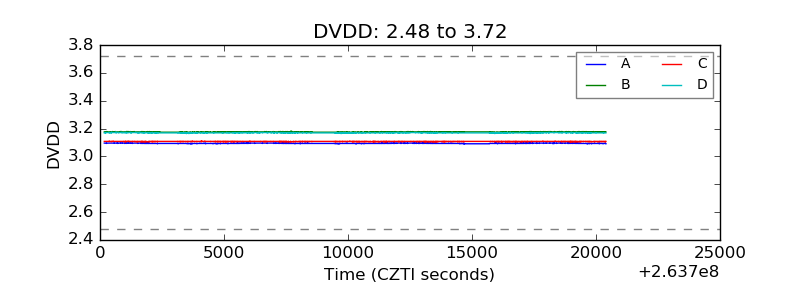 |
| Temperature 1 | 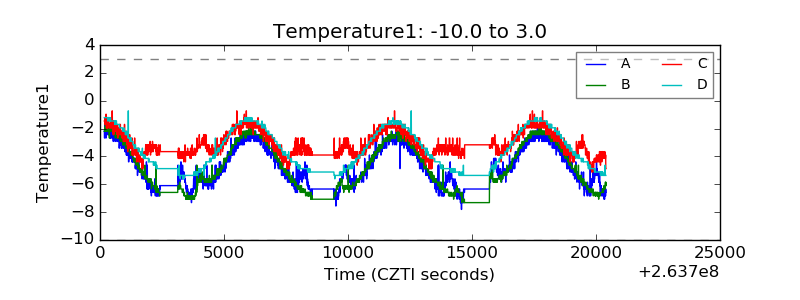 |
| Veto HV Monitor | 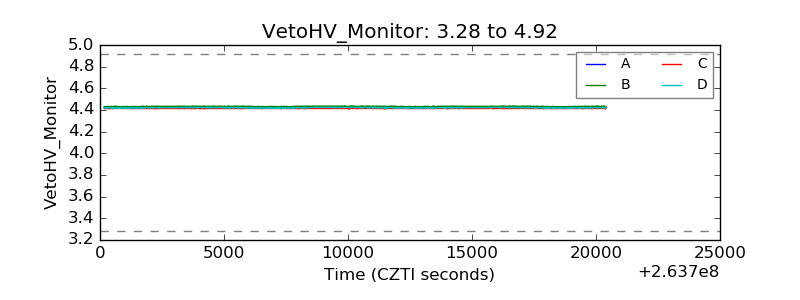 |
| Veto LLD | 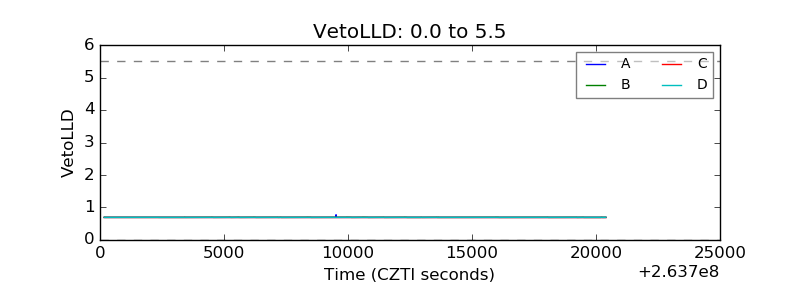 |
| Alpha Counter | 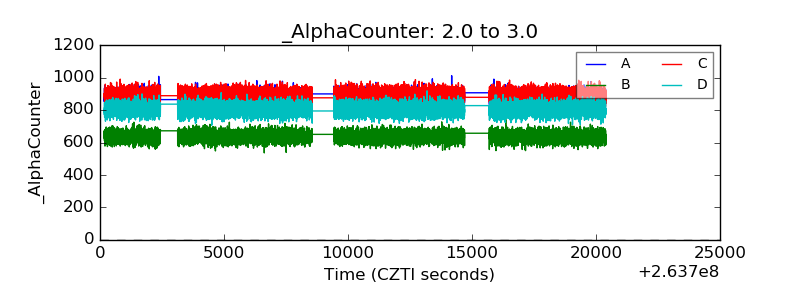 |
| _CPM_Rate |  |
| CZT Counter | 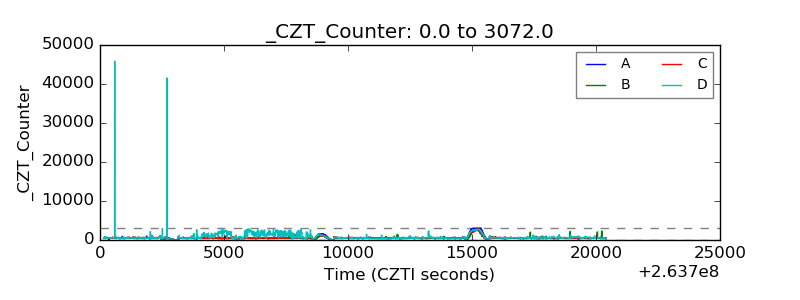 |
| +2.5 Volts monitor |  |
| +5 Volts monitor |  |
| _ROLL_ROT | 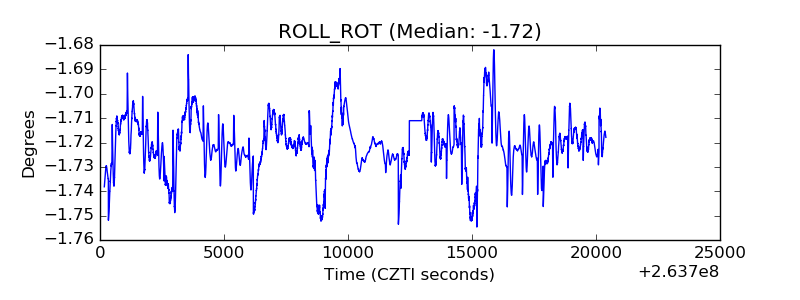 |
| _Roll_DEC | 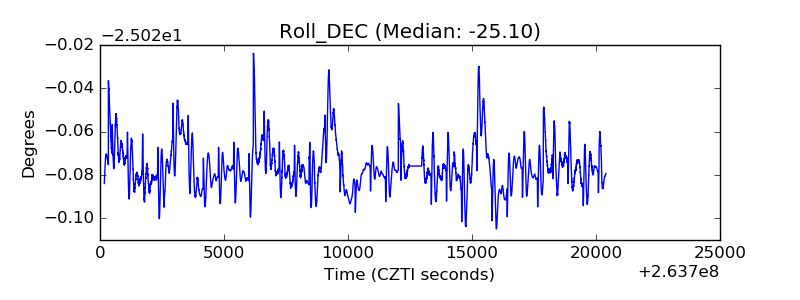 |
| _Roll_RA | 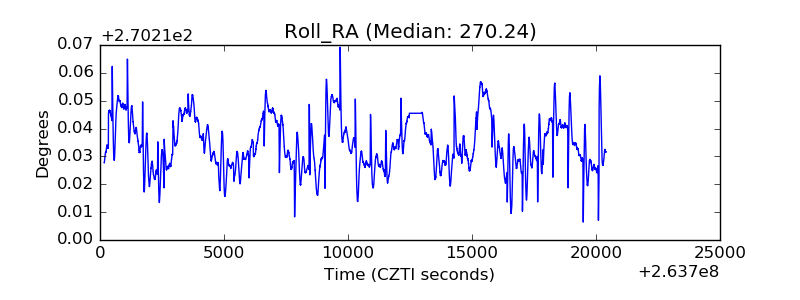 |
| Veto Counter | 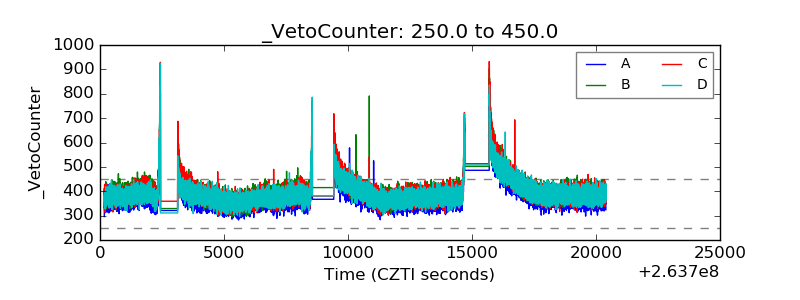 |