| Param | Original file | Final file |
|---|---|---|
| Filename | modeM0/AS1G08_045T01_9000002092cztM0_level2.fits | modeM0/AS1G08_045T01_9000002092cztM0_level2_quad_clean.evt |
| Size (bytes) | 574,701,120 | 583,608,960 |
| Size | 548.1 MB | 556.6 MB |
| Events in quadrant A | 3,610,648 | 3,676,639 |
| Events in quadrant B | 3,232,644 | 3,528,389 |
| Events in quadrant C | 3,487,734 | 3,367,172 |
| Events in quadrant D | 3,004,724 | 3,037,498 |
| Mode M9 | |||
|---|---|---|---|
| Quadrant | BADHDUFLAG | Total packets | Discarded packets |
| A | 0 | 95 | 0 |
| B | 0 | 95 | 0 |
| C | 0 | 95 | 0 |
| D | 0 | 95 | 0 |
| Mode SS | |||
|---|---|---|---|
| Quadrant | BADHDUFLAG | Total packets | Discarded packets |
| A | 0 | 1202 | 0 |
| B | 0 | 1202 | 0 |
| C | 0 | 1202 | 0 |
| D | 0 | 1202 | 0 |
| Mode M0 | |||
|---|---|---|---|
| Quadrant | BADHDUFLAG | Total packets | Discarded packets |
| A | 0 | 125681 | 0 |
| B | 0 | 198412 | 0 |
| C | 0 | 126012 | 0 |
| D | 0 | 158539 | 0 |
| Quadrant | Total seconds | Saturated seconds | Saturation percentage |
|---|---|---|---|
| A | 59286 | 664 | 1.119995% |
| B | 59286 | 8851 | 14.929326% |
| C | 59286 | 472 | 0.796141% |
| D | 59286 | 1246 | 2.101677% |
Noise dominated data is calculated using 1-second bins in cleaned event files. If a bin has >2000 counts, and if more than 50% of those come from <1% of pixels, then it is considered to be noise-dominated and hence unusable.
| Quadrant | # 1 sec bins | Bins with >0 counts | Bins with >2000 counts | High rate bins dominated by noise | Noise dominated (total time) | Noise dominated (detector-on time) | Marked lightcurve |
|---|---|---|---|---|---|---|---|
| A | 68586 | 59284 | 0 | 0 | 0.00% | 0.00% | 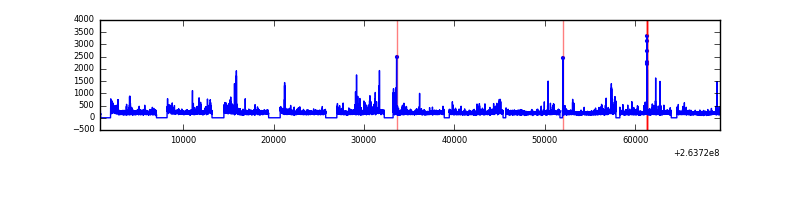 |
| B | 68586 | 59257 | 0 | 0 | 0.00% | 0.00% | 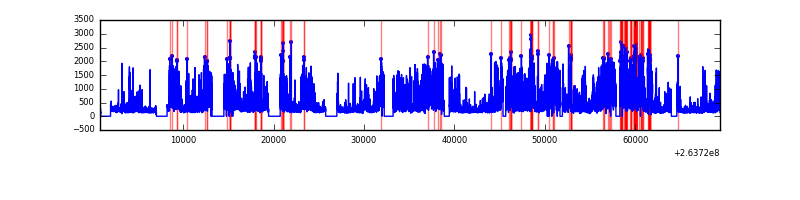 |
| C | 68586 | 59286 | 0 | 0 | 0.00% | 0.00% |  |
| D | 68586 | 59281 | 0 | 0 | 0.00% | 0.00% | 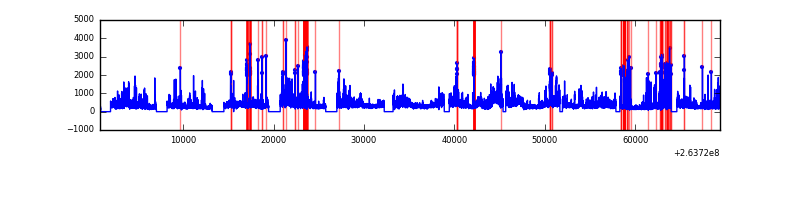 |
Top three noisy pixels from each quadrant. If the there are fewer than three noisy pixels in the level2.evt file, extra rows are filled as -1
| Pixel properties | Quadrant properties | ||||||
|---|---|---|---|---|---|---|---|
| Quadrant | DetID | PixID | Counts | Sigma | Mean | Median | Sigma |
| A | 0 | 29 | 3406 | 10.74 | 942 | 883 | 235.0 |
| A | 7 | 110 | 2991 | 8.97 | 942 | 883 | 235.0 |
| A | 9 | 19 | 2801 | 8.16 | 942 | 883 | 235.0 |
| B | 2 | 9 | 2782 | 11.64 | 853 | 815 | 169.0 |
| B | 5 | 128 | 2188 | 8.12 | 853 | 815 | 169.0 |
| B | 5 | 225 | 2115 | 7.69 | 853 | 815 | 169.0 |
| C | 1 | 81 | 2698 | 7.69 | 920 | 855 | 239.8 |
| C | 1 | 80 | 2606 | 7.3 | 920 | 855 | 239.8 |
| C | 12 | 241 | 2472 | 6.74 | 920 | 855 | 239.8 |
| D | 3 | 14 | 2203 | 6.13 | 858 | 779 | 232.3 |
| D | 6 | 231 | 2138 | 5.85 | 858 | 779 | 232.3 |
| D | 7 | 3 | 2114 | 5.75 | 858 | 779 | 232.3 |
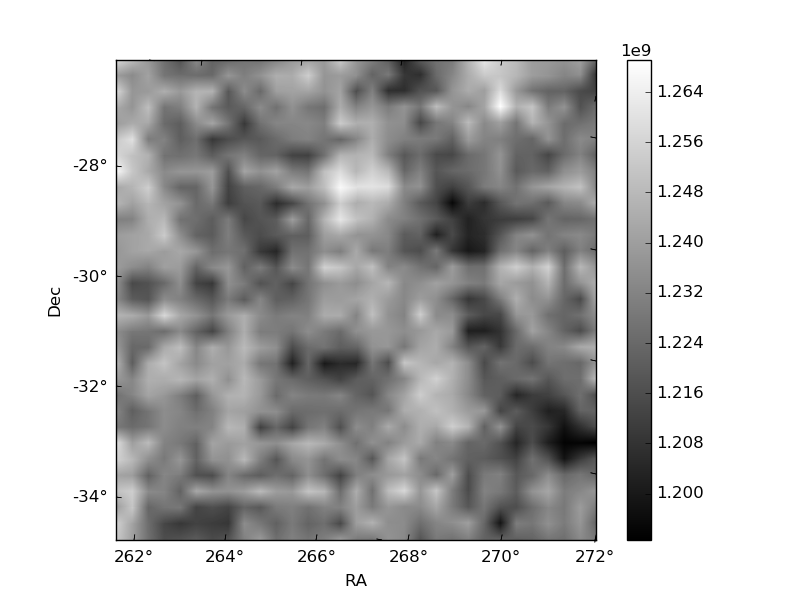
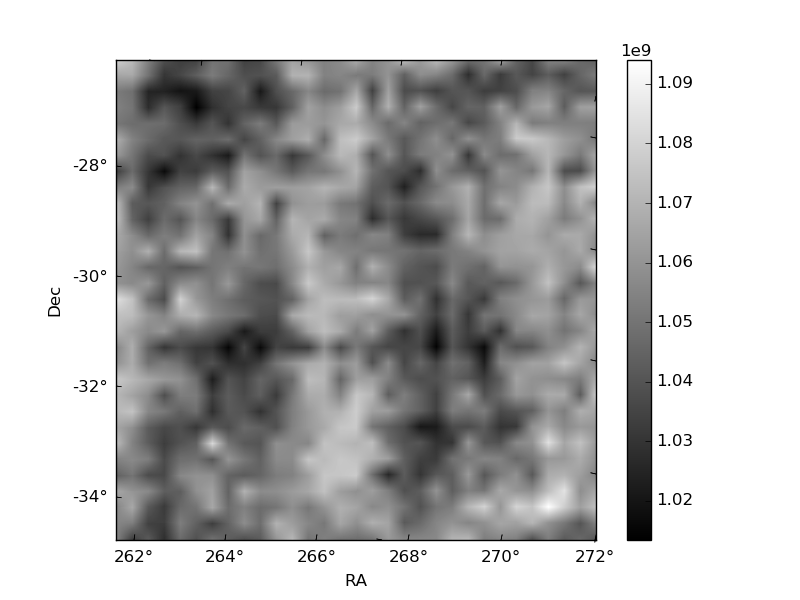
Histogram calculated using DETX and DETY for each event in the final _common_clean file
| Quadrant A | 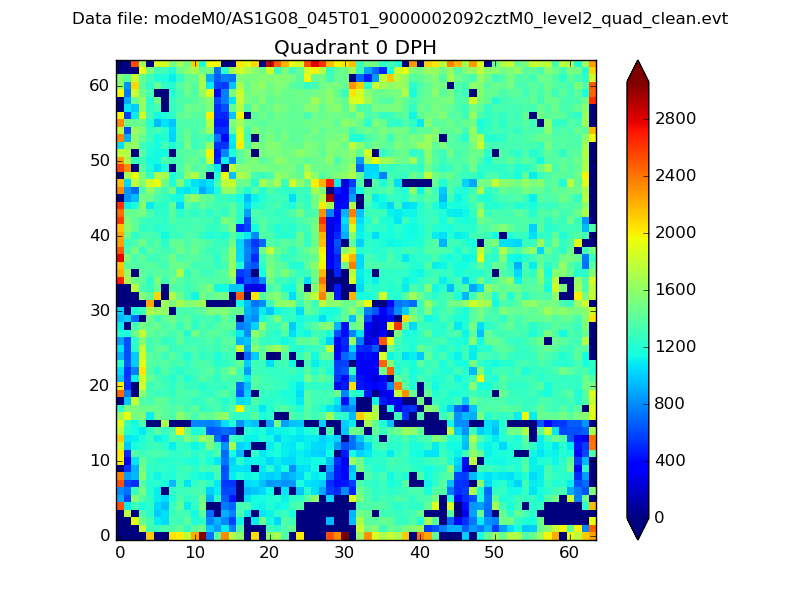 |
 |
Quadrant B |
|---|---|---|---|
| Quadrant D |  |
 |
Quadrant C |
| Plot type | Count rate plots | Images |
|---|---|---|
| Comparison with Poisson distribution Blue bars denote a histogram of data divided into 1 sec bins. Red curve is a Poisson curve with rate = median count rate of data. |
 |
 |
| Quadrant-wise count rates Data is divided into 100 sec bins |
 |
|
| Module-wise count rates for Quadrant A Data is divided into 100 sec bins |
 |
 |
| Module-wise count rates for Quadrant B Data is divided into 100 sec bins |
 |
 |
| Module-wise count rates for Quadrant C Data is divided into 100 sec bins |
 |
 |
| Module-wise count rates for Quadrant D Data is divided into 100 sec bins |
 |
 |
| Parameter | Plot |
|---|---|
| CZT HV Monitor |  |
| D_VDD | 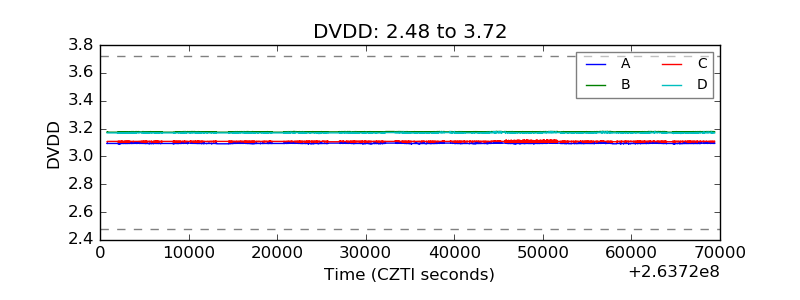 |
| Temperature 1 |  |
| Veto HV Monitor |  |
| Veto LLD | 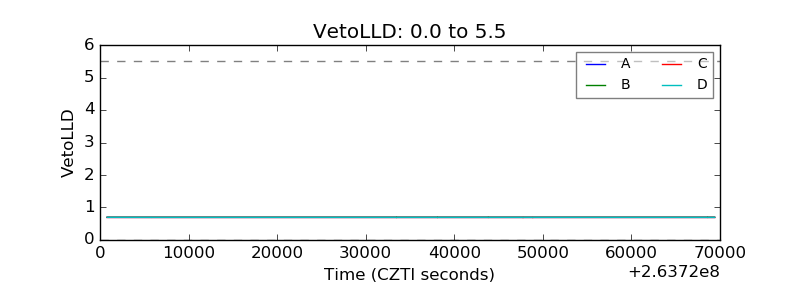 |
| Alpha Counter | 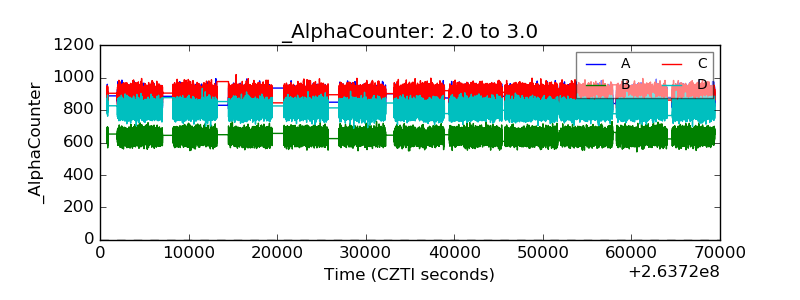 |
| _CPM_Rate |  |
| CZT Counter |  |
| +2.5 Volts monitor |  |
| +5 Volts monitor |  |
| _ROLL_ROT |  |
| _Roll_DEC |  |
| _Roll_RA |  |
| Veto Counter | 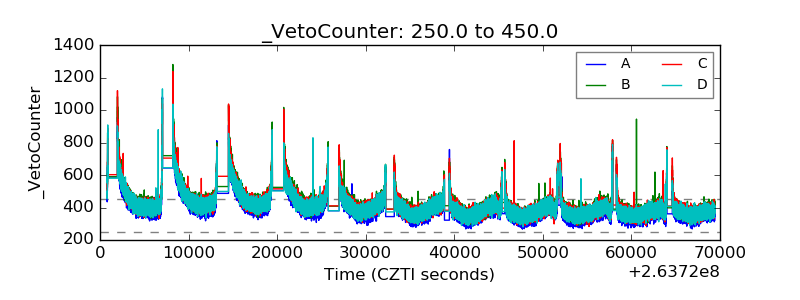 |