| Param | Original file | Final file |
|---|---|---|
| Filename | modeM0/AS1G08_045T01_9000002092_14153cztM0_level2.evt | modeM0/AS1G08_045T01_9000002092_14153cztM0_level2_quad_clean.evt |
| Size (bytes) | 140,904,000 | 22,288,320 |
| Size | 134.4 MB | 21.3 MB |
| Events in quadrant A | 971,533 | 139,577 |
| Events in quadrant B | 1,011,450 | 145,317 |
| Events in quadrant C | 989,674 | 134,299 |
| Events in quadrant D | 1,175,448 | 129,098 |
| Mode M9 | |||
|---|---|---|---|
| Quadrant | BADHDUFLAG | Total packets | Discarded packets |
| A | 0 | 11 | 0 |
| B | 0 | 11 | 0 |
| C | 0 | 11 | 0 |
| D | 0 | 11 | 0 |
| Mode SS | |||
|---|---|---|---|
| Quadrant | BADHDUFLAG | Total packets | Discarded packets |
| A | 0 | 36 | 0 |
| B | 0 | 36 | 0 |
| C | 0 | 36 | 0 |
| D | 0 | 36 | 0 |
| Mode M0 | |||
|---|---|---|---|
| Quadrant | BADHDUFLAG | Total packets | Discarded packets |
| A | 0 | 3981 | 2 |
| B | 0 | 4085 | 1 |
| C | 0 | 4007 | 1 |
| D | 0 | 4755 | 1 |
| Quadrant | Total seconds | Saturated seconds | Saturation percentage |
|---|---|---|---|
| A | 1719 | 66 | 3.839442% |
| B | 1719 | 68 | 3.955788% |
| C | 1719 | 43 | 2.501454% |
| D | 1719 | 56 | 3.257708% |
Noise dominated data is calculated using 1-second bins in cleaned event files. If a bin has >2000 counts, and if more than 50% of those come from <1% of pixels, then it is considered to be noise-dominated and hence unusable.
| Quadrant | # 1 sec bins | Bins with >0 counts | Bins with >2000 counts | High rate bins dominated by noise | Noise dominated (total time) | Noise dominated (detector-on time) | Marked lightcurve |
|---|---|---|---|---|---|---|---|
| A | 2815 | 1720 | 0 | 0 | 0.00% | 0.00% | 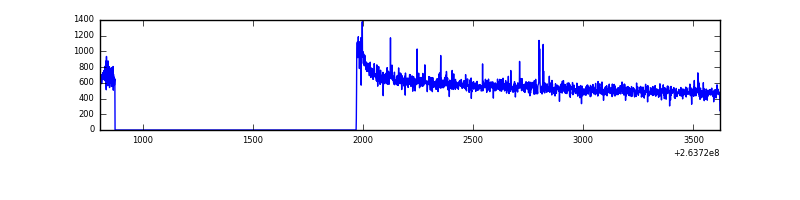 |
| B | 2815 | 1721 | 1 | 1 | 0.04% | 0.06% | 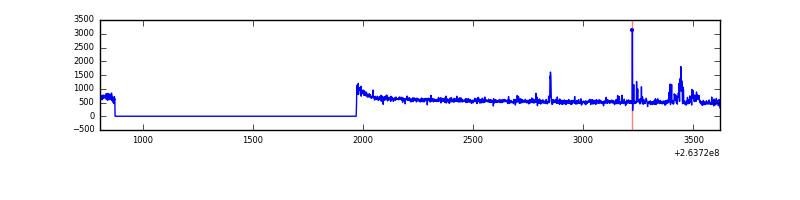 |
| C | 2815 | 1721 | 0 | 0 | 0.00% | 0.00% | 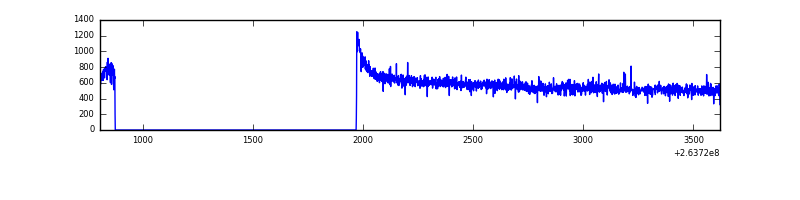 |
| D | 2815 | 1721 | 1 | 1 | 0.04% | 0.06% | 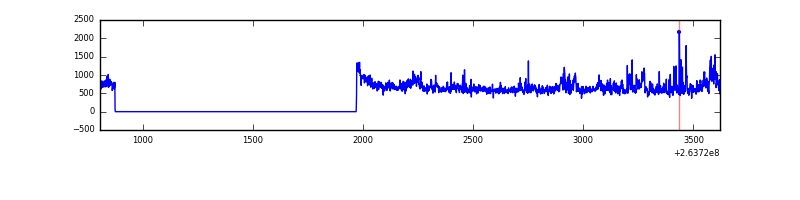 |
Top three noisy pixels from each quadrant. If the there are fewer than three noisy pixels in the level2.evt file, extra rows are filled as -1
| Pixel properties | Quadrant properties | ||||||
|---|---|---|---|---|---|---|---|
| Quadrant | DetID | PixID | Counts | Sigma | Mean | Median | Sigma |
| A | 12 | 96 | 5597 | 104.72 | 249 | 243 | 51.1 |
| A | 9 | 143 | 5098 | 94.96 | 249 | 243 | 51.1 |
| A | 0 | 226 | 2282 | 39.88 | 249 | 243 | 51.1 |
| B | 0 | 189 | 34253 | 711.61 | 244 | 239 | 47.8 |
| B | 3 | 209 | 8668 | 176.34 | 244 | 239 | 47.8 |
| B | 4 | 80 | 7574 | 153.46 | 244 | 239 | 47.8 |
| C | 3 | 233 | 62723 | 1127.74 | 237 | 239 | 55.4 |
| C | 10 | 22 | 1870 | 29.44 | 237 | 239 | 55.4 |
| C | 13 | 61 | 1636 | 25.21 | 237 | 239 | 55.4 |
| D | 1 | 52 | 121733 | 2093.0 | 241 | 236 | 58.0 |
| D | 12 | 110 | 72149 | 1238.83 | 241 | 236 | 58.0 |
| D | 2 | 152 | 31385 | 536.6 | 241 | 236 | 58.0 |
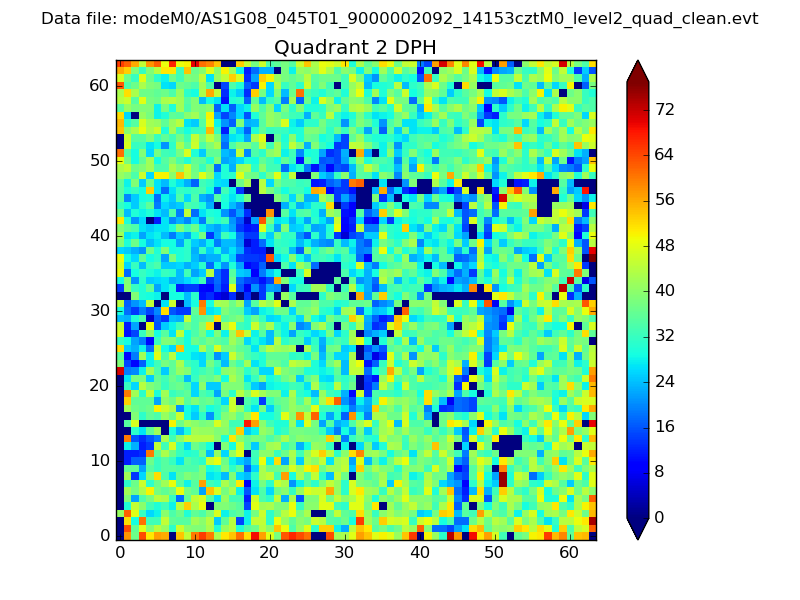
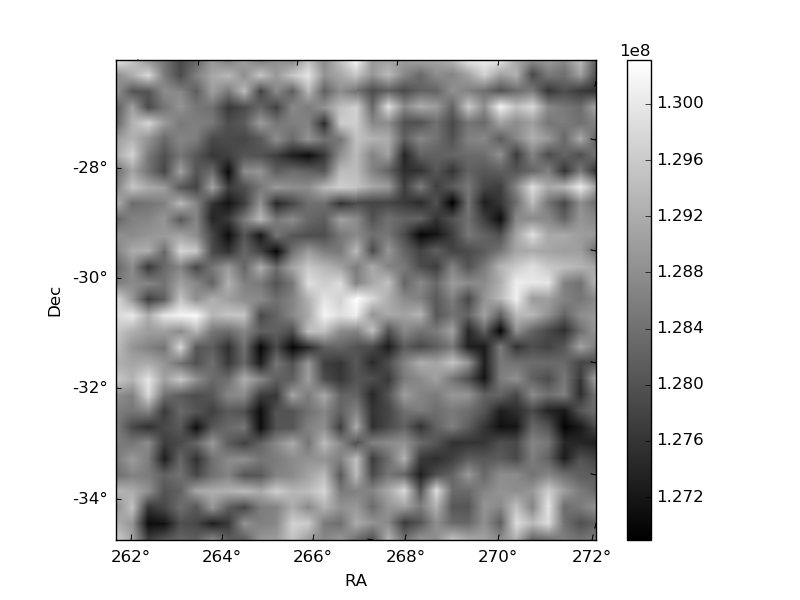
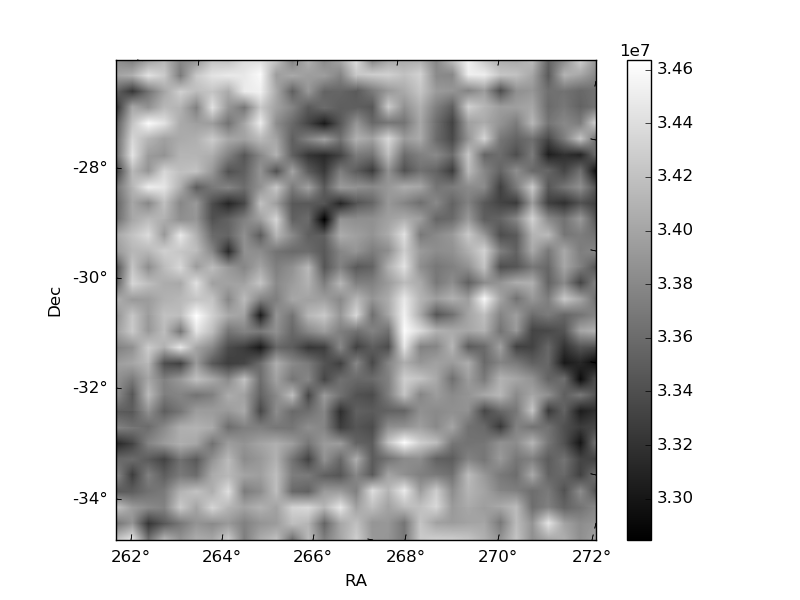
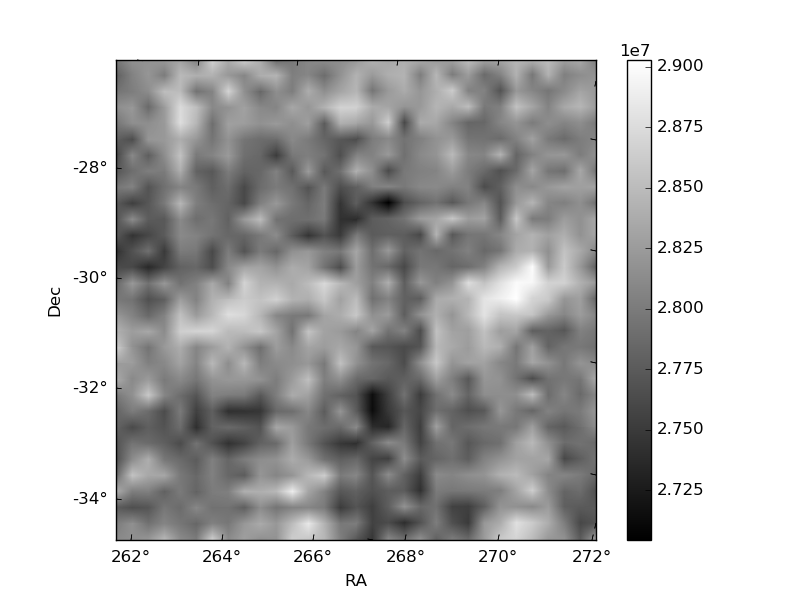
Histogram calculated using DETX and DETY for each event in the final _common_clean file
| Quadrant A | 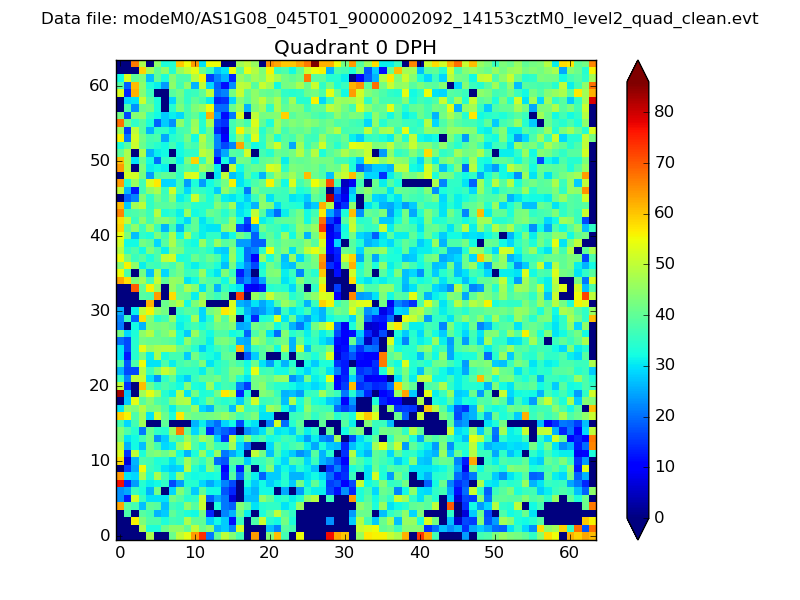 |
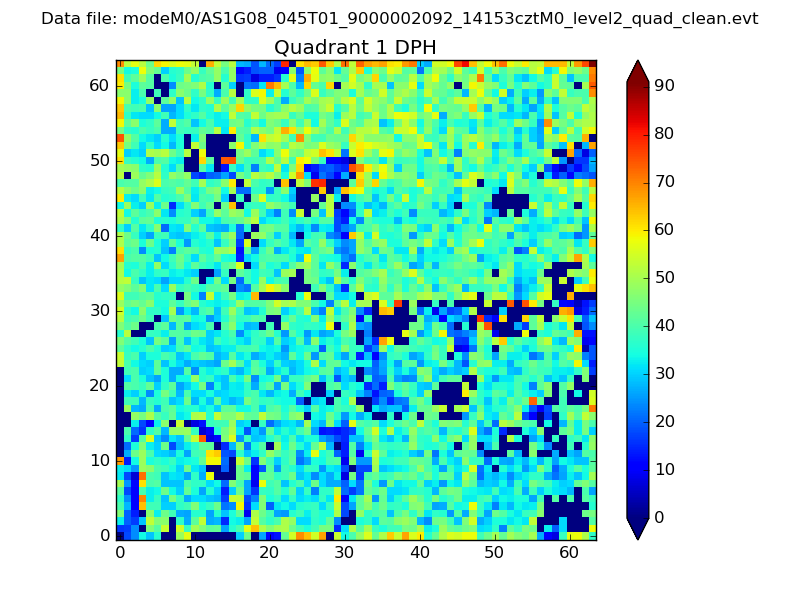 |
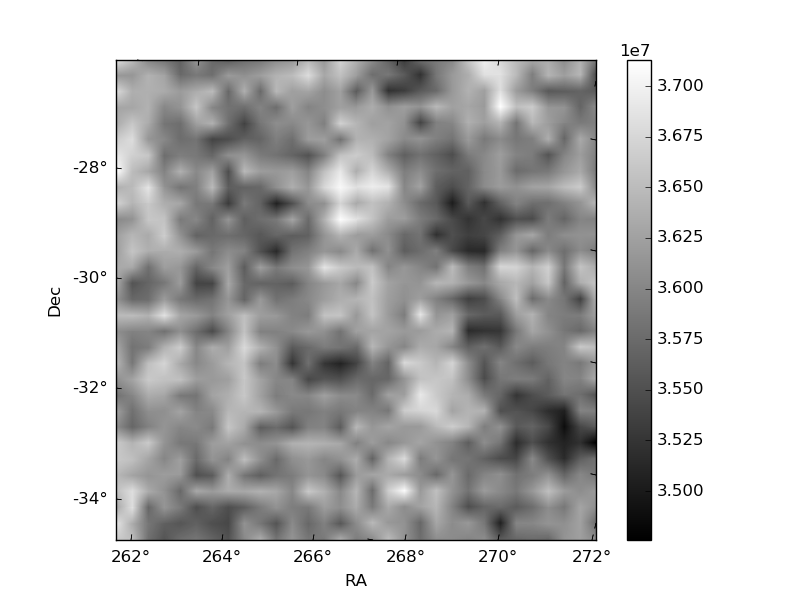
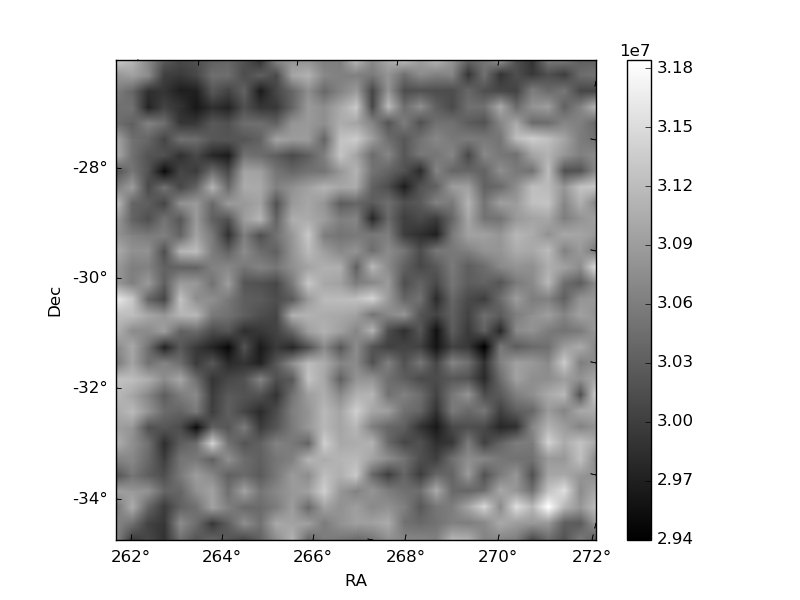
Quadrant B |
|---|---|---|---|
| Quadrant D | 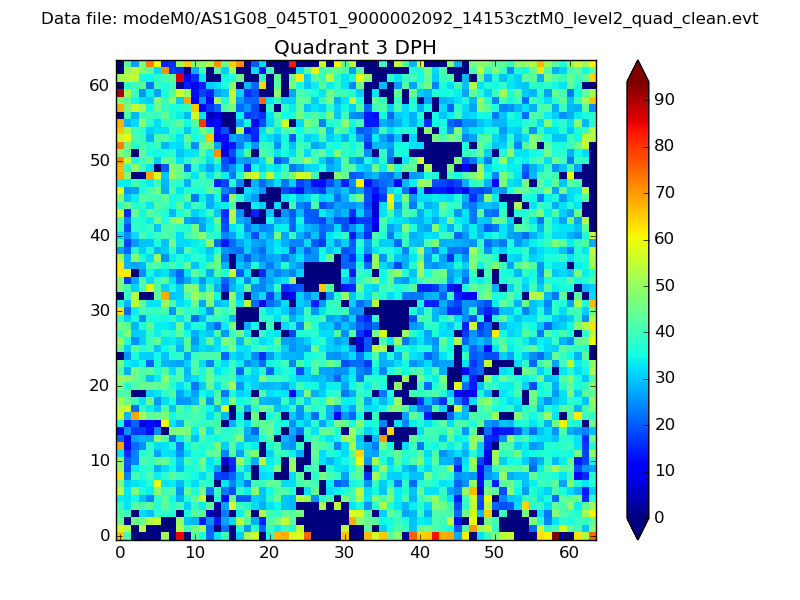 |
 |
Quadrant C |
| Plot type | Count rate plots | Images |
|---|---|---|
| Comparison with Poisson distribution Blue bars denote a histogram of data divided into 1 sec bins. Red curve is a Poisson curve with rate = median count rate of data. |
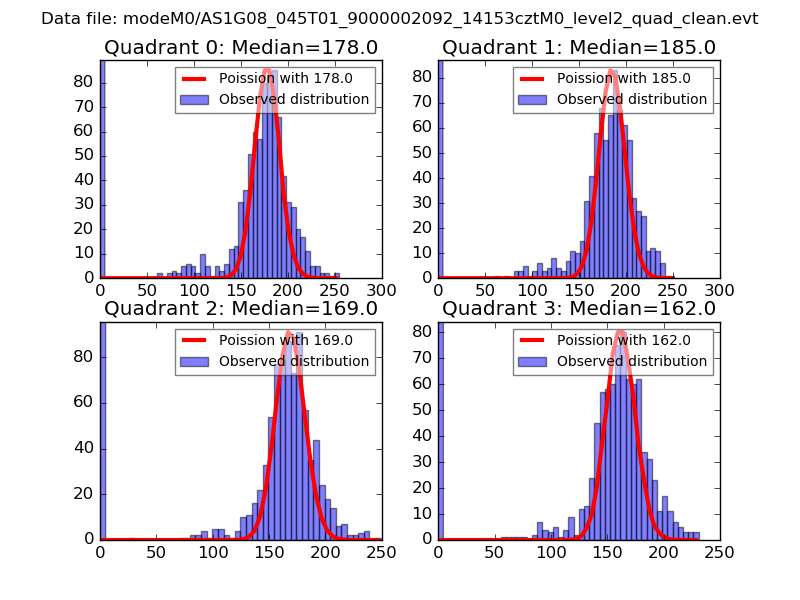 |
 |
| Quadrant-wise count rates Data is divided into 100 sec bins |
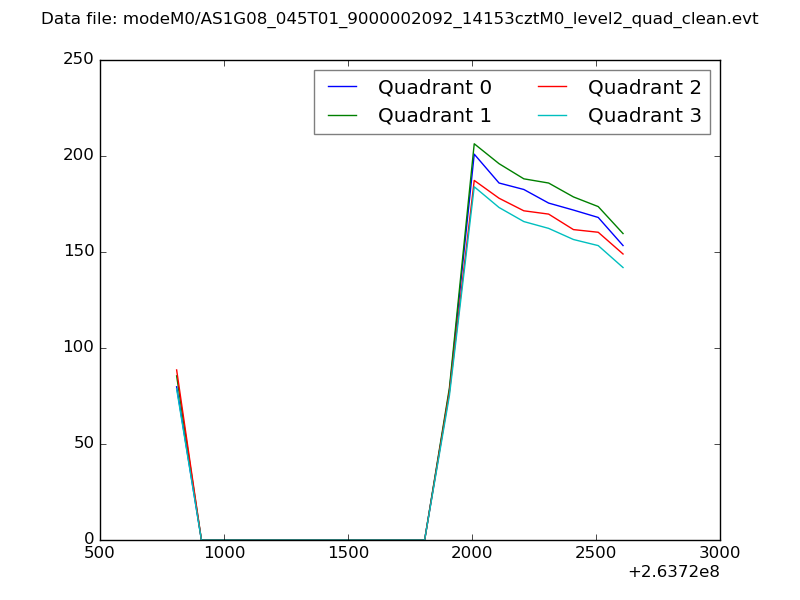 |
|
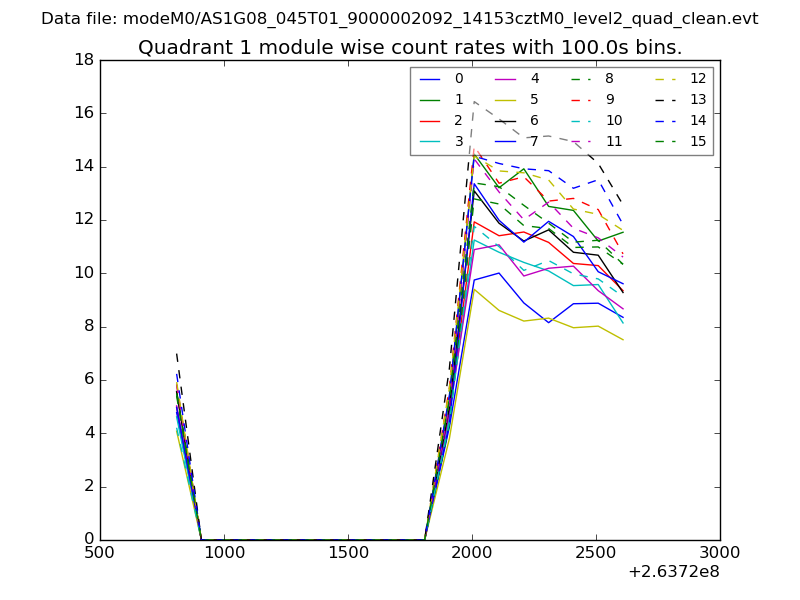
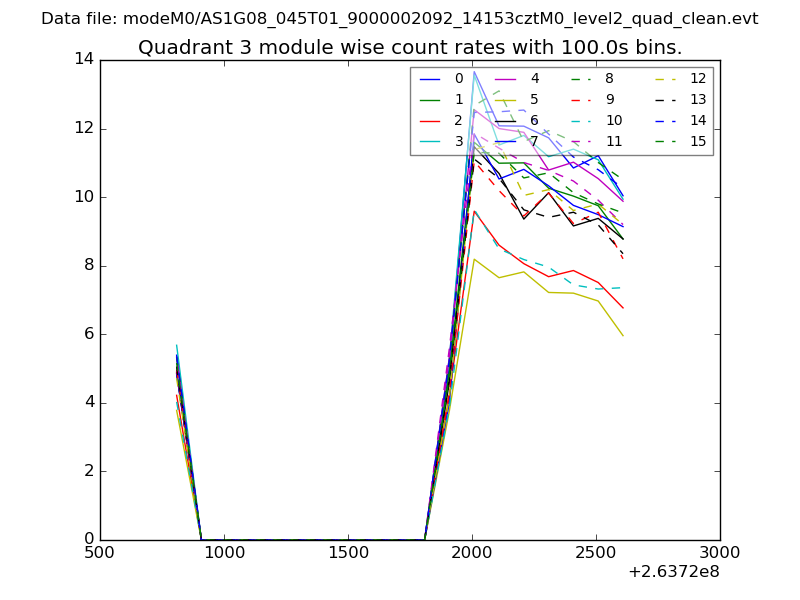
| Module-wise count rates for Quadrant A Data is divided into 100 sec bins |
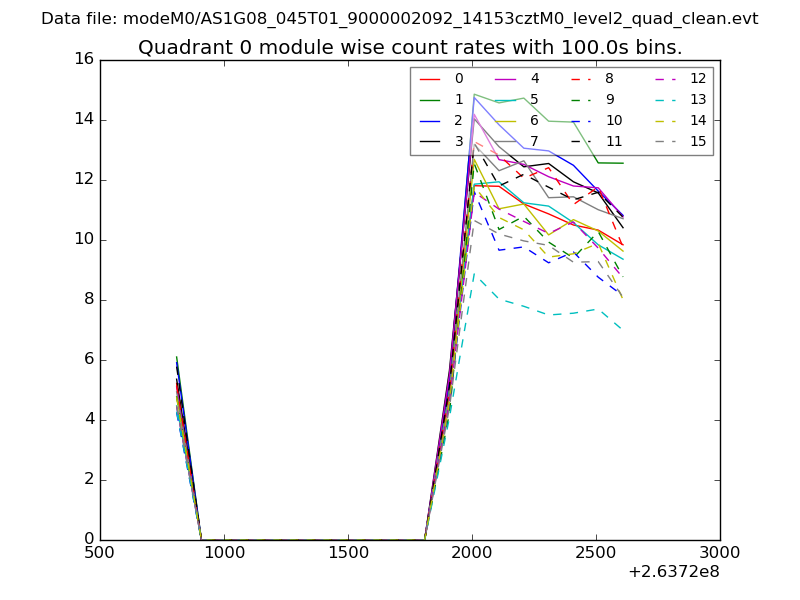 |
 |
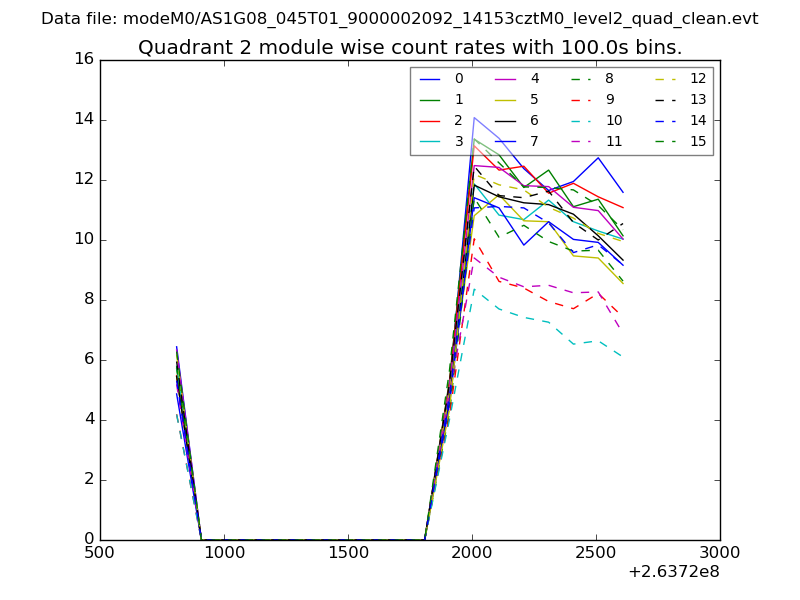
| Module-wise count rates for Quadrant B Data is divided into 100 sec bins |
 |
 |
| Module-wise count rates for Quadrant C Data is divided into 100 sec bins |
 |
 |
| Module-wise count rates for Quadrant D Data is divided into 100 sec bins |
 |
 |
| Parameter | Plot |
|---|---|
| CZT HV Monitor | 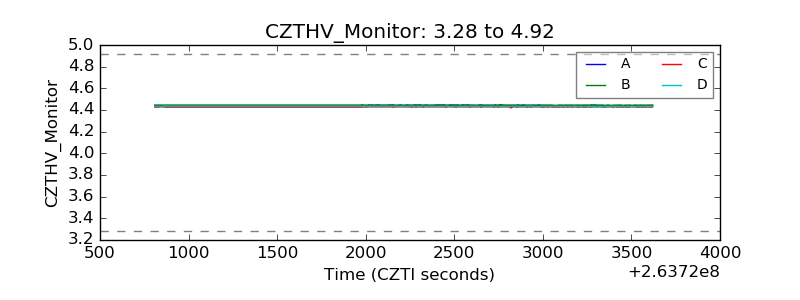 |
| D_VDD | 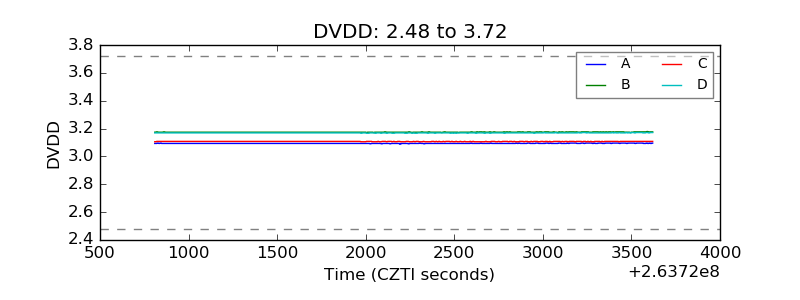 |
| Temperature 1 | 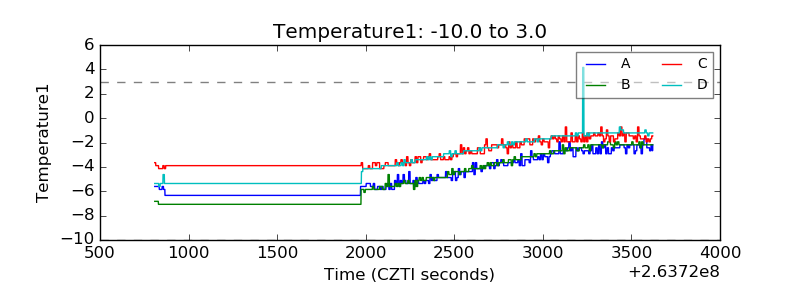 |
| Veto HV Monitor | 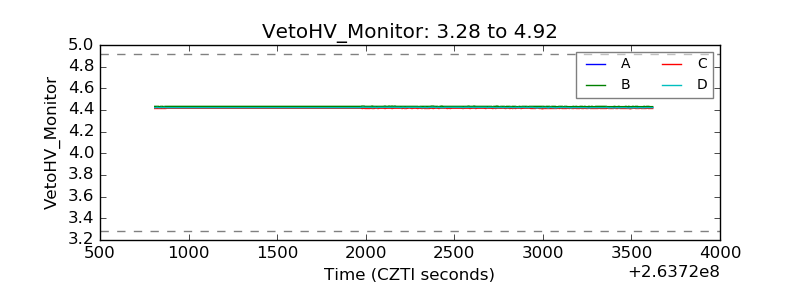 |
| Veto LLD | 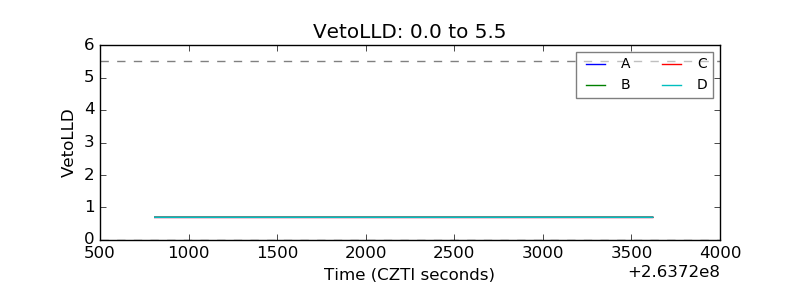 |
| Alpha Counter | 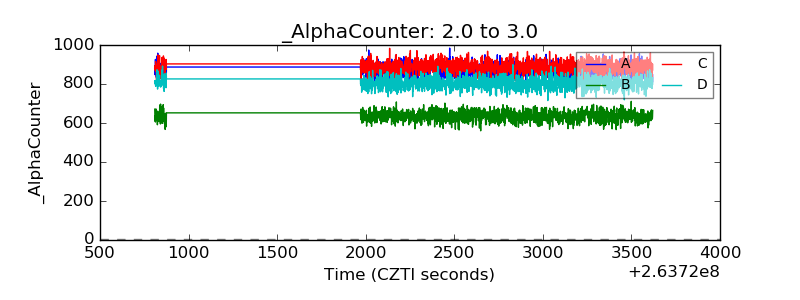 |
| _CPM_Rate | 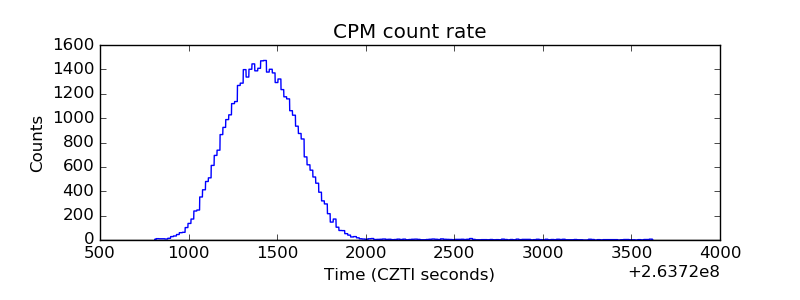 |
| CZT Counter | 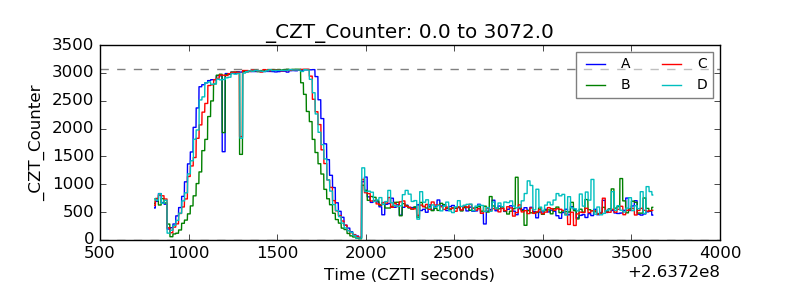 |
| +2.5 Volts monitor |  |
| +5 Volts monitor | 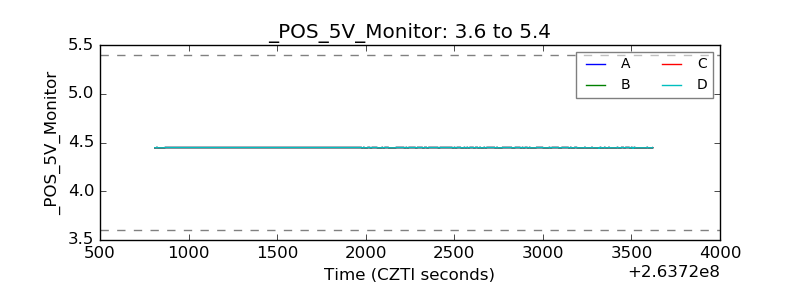 |
| _ROLL_ROT | 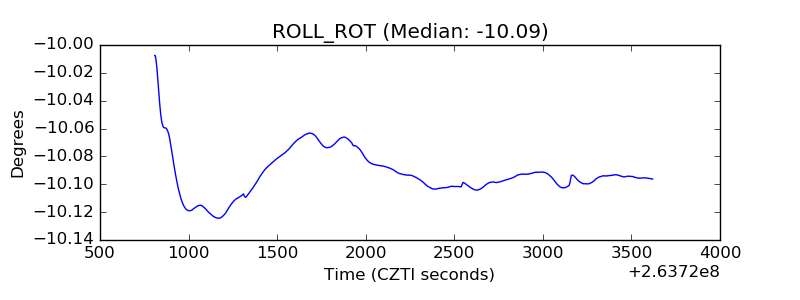 |
| _Roll_DEC | 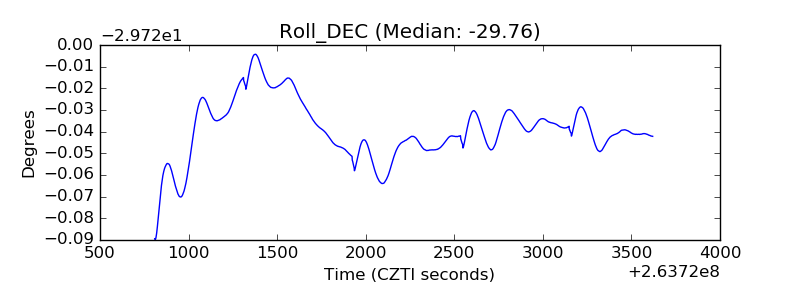 |
| _Roll_RA | 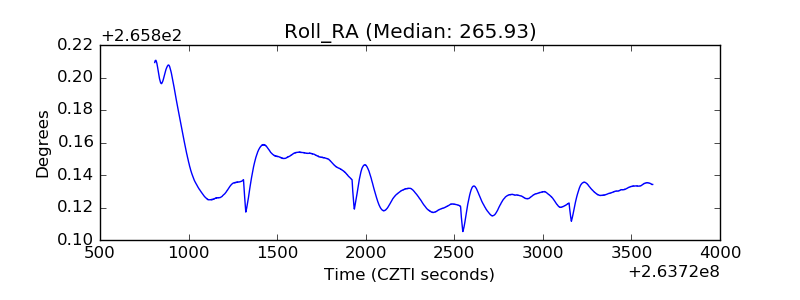 |
| Veto Counter | 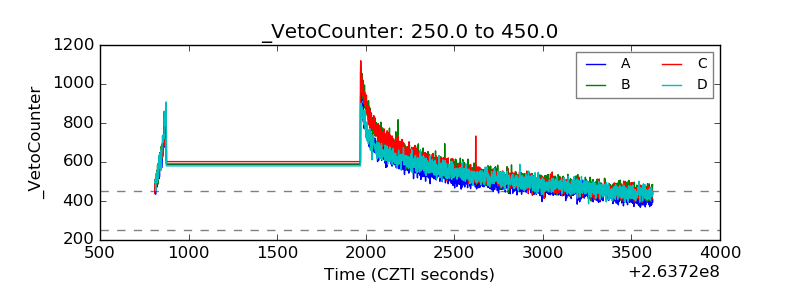 |