| Param | Original file | Final file |
|---|---|---|
| Filename | modeM0/AS1G08_045T01_9000002092_14155cztM0_level2.evt | modeM0/AS1G08_045T01_9000002092_14155cztM0_level2_quad_clean.evt |
| Size (bytes) | 609,465,600 | 68,276,160 |
| Size | 581.2 MB | 65.1 MB |
| Events in quadrant A | 3,597,802 | 423,416 |
| Events in quadrant B | 6,864,078 | 395,912 |
| Events in quadrant C | 3,629,290 | 404,229 |
| Events in quadrant D | 3,926,906 | 390,468 |
| Mode M9 | |||
|---|---|---|---|
| Quadrant | BADHDUFLAG | Total packets | Discarded packets |
| A | 0 | 16 | 0 |
| B | 0 | 16 | 0 |
| C | 0 | 16 | 0 |
| D | 0 | 17 | 0 |
| Mode SS | |||
|---|---|---|---|
| Quadrant | BADHDUFLAG | Total packets | Discarded packets |
| A | 0 | 132 | 0 |
| B | 0 | 132 | 0 |
| C | 0 | 132 | 0 |
| D | 0 | 132 | 0 |
| Mode M0 | |||
|---|---|---|---|
| Quadrant | BADHDUFLAG | Total packets | Discarded packets |
| A | 0 | 14714 | 3 |
| B | 0 | 24707 | 2 |
| C | 0 | 14482 | 2 |
| D | 0 | 16047 | 2 |
| Quadrant | Total seconds | Saturated seconds | Saturation percentage |
|---|---|---|---|
| A | 6493 | 85 | 1.309102% |
| B | 6493 | 1412 | 21.746496% |
| C | 6493 | 60 | 0.924072% |
| D | 6493 | 110 | 1.694132% |
Noise dominated data is calculated using 1-second bins in cleaned event files. If a bin has >2000 counts, and if more than 50% of those come from <1% of pixels, then it is considered to be noise-dominated and hence unusable.
| Quadrant | # 1 sec bins | Bins with >0 counts | Bins with >2000 counts | High rate bins dominated by noise | Noise dominated (total time) | Noise dominated (detector-on time) | Marked lightcurve |
|---|---|---|---|---|---|---|---|
| A | 7809 | 6495 | 3 | 3 | 0.04% | 0.05% | 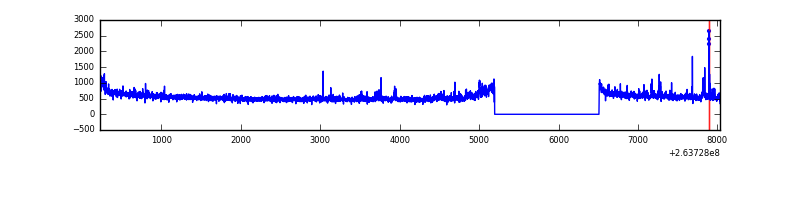 |
| B | 7809 | 6494 | 851 | 851 | 10.90% | 13.10% |  |
| C | 7809 | 6495 | 0 | 0 | 0.00% | 0.00% | 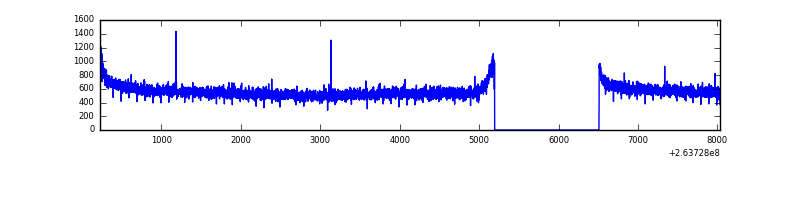 |
| D | 7809 | 6495 | 34 | 34 | 0.44% | 0.52% | 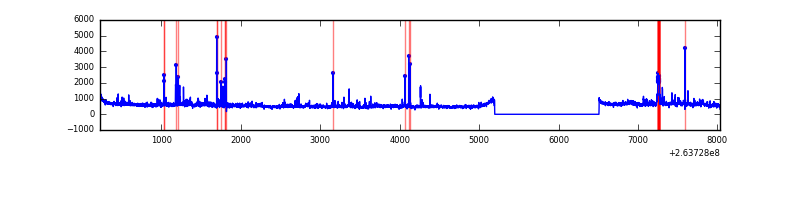 |
Top three noisy pixels from each quadrant. If the there are fewer than three noisy pixels in the level2.evt file, extra rows are filled as -1
| Pixel properties | Quadrant properties | ||||||
|---|---|---|---|---|---|---|---|
| Quadrant | DetID | PixID | Counts | Sigma | Mean | Median | Sigma |
| A | 12 | 189 | 78388 | 429.46 | 899 | 882 | 180.5 |
| A | 9 | 143 | 57617 | 314.37 | 899 | 882 | 180.5 |
| A | 0 | 226 | 8025 | 39.58 | 899 | 882 | 180.5 |
| B | 0 | 85 | 3517123 | 23216.83 | 811 | 795 | 151.5 |
| B | 0 | 189 | 102958 | 674.54 | 811 | 795 | 151.5 |
| B | 3 | 209 | 30408 | 195.52 | 811 | 795 | 151.5 |
| C | 3 | 233 | 299562 | 1538.49 | 854 | 860 | 194.2 |
| C | 13 | 61 | 6103 | 27.0 | 854 | 860 | 194.2 |
| C | 10 | 22 | 3029 | 11.17 | 854 | 860 | 194.2 |
| D | 8 | 195 | 234270 | 1157.08 | 857 | 839 | 201.7 |
| D | 2 | 152 | 173574 | 856.22 | 857 | 839 | 201.7 |
| D | 15 | 0 | 138913 | 684.41 | 857 | 839 | 201.7 |
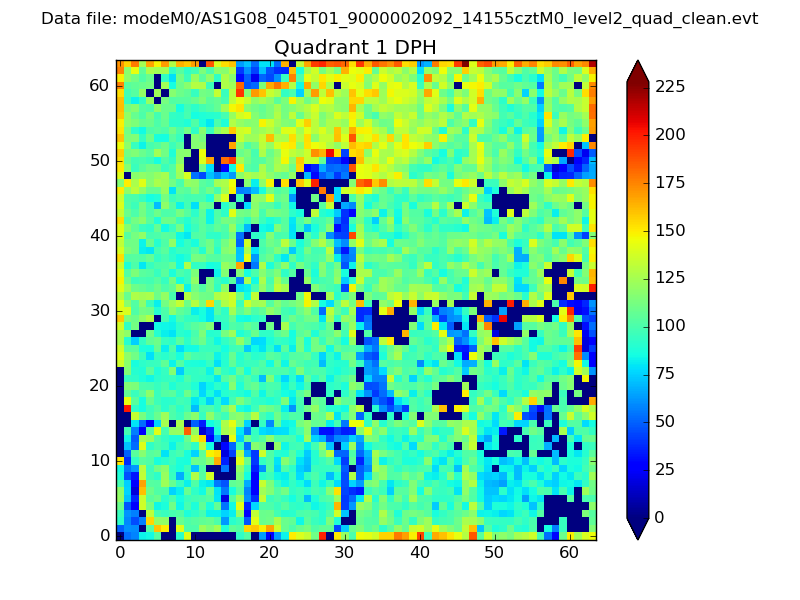
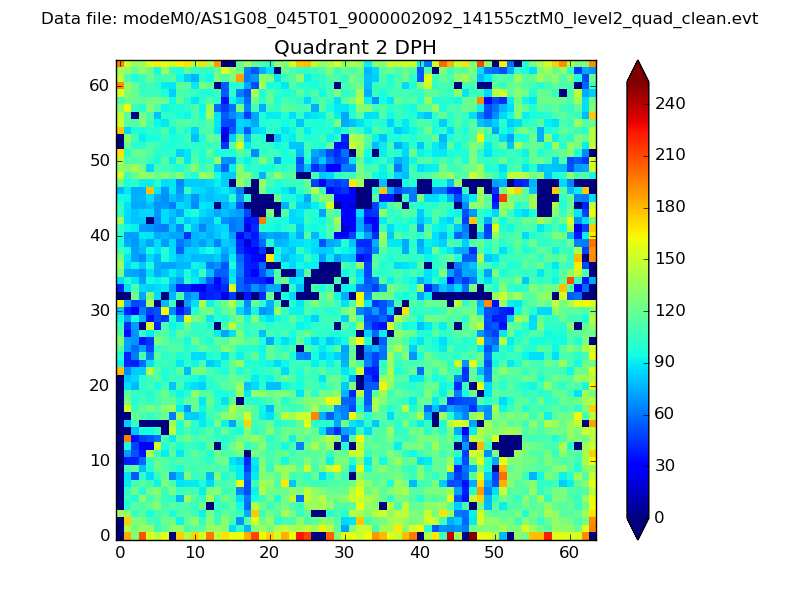
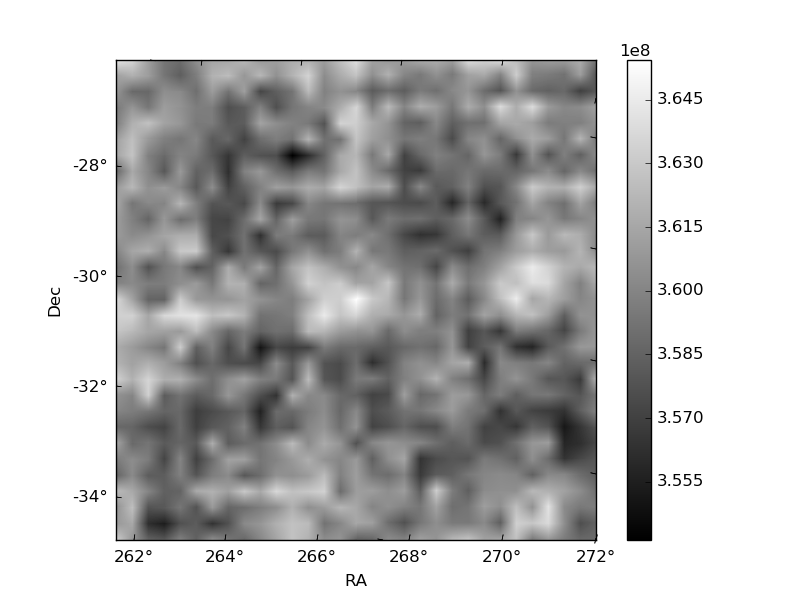
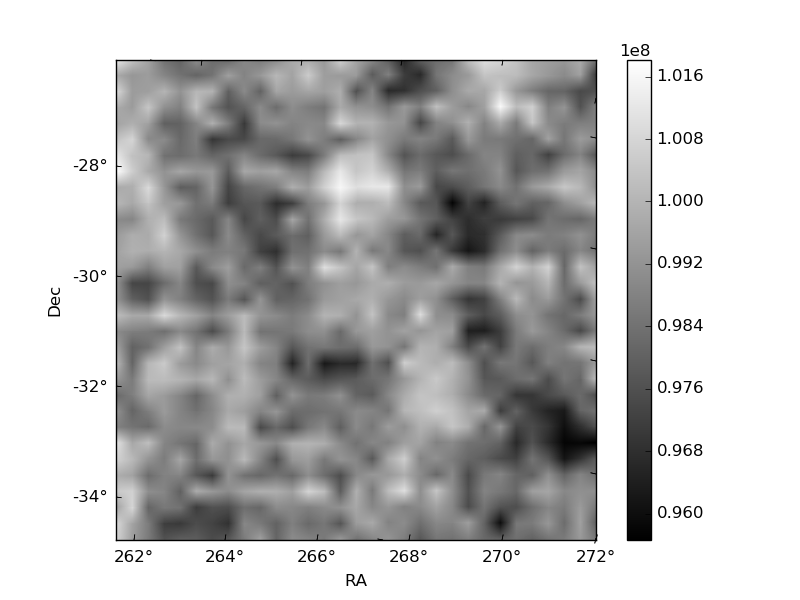
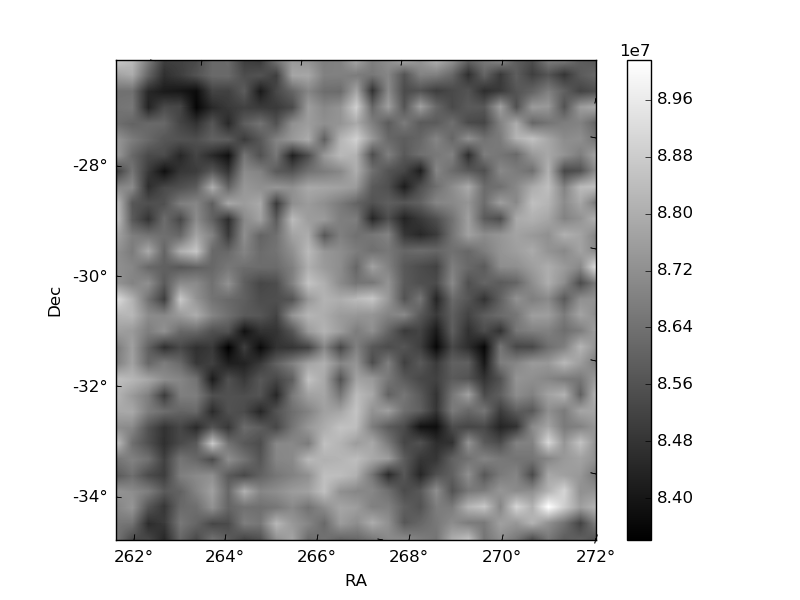
Histogram calculated using DETX and DETY for each event in the final _common_clean file
| Quadrant A | 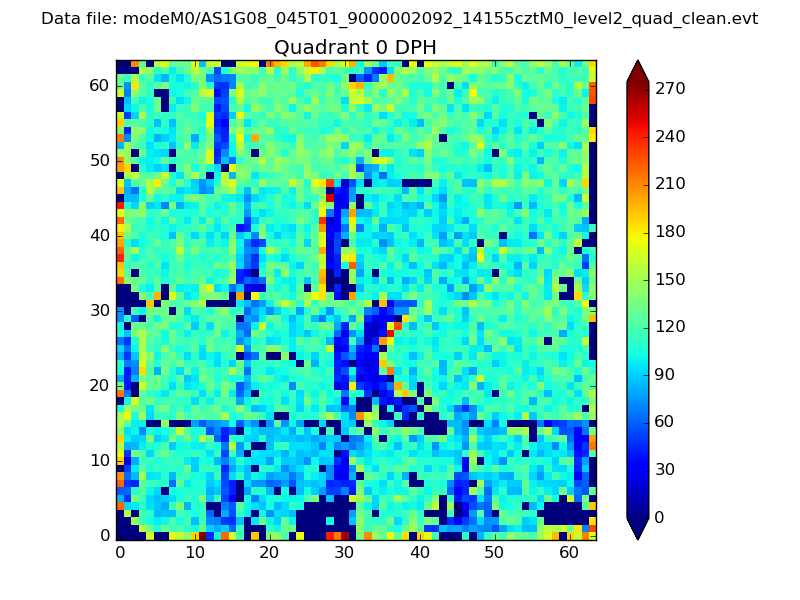 |
 |
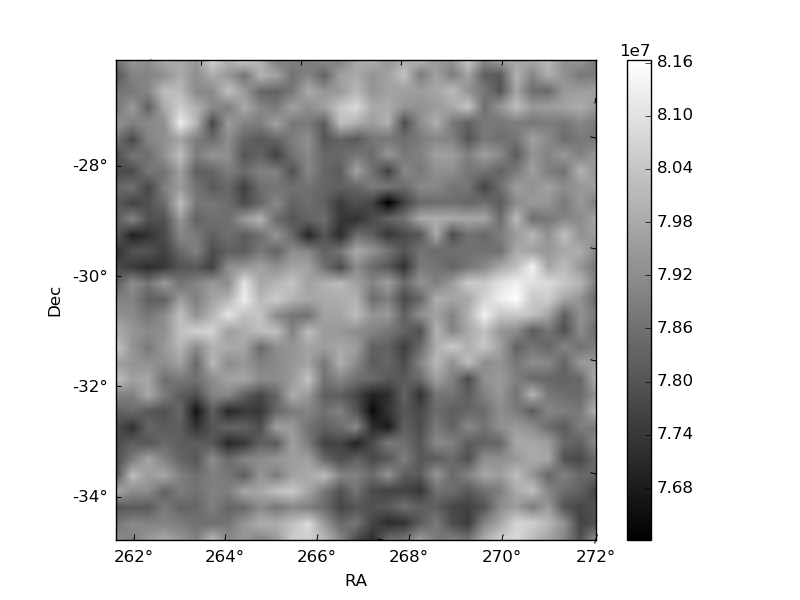
Quadrant B |
|---|---|---|---|
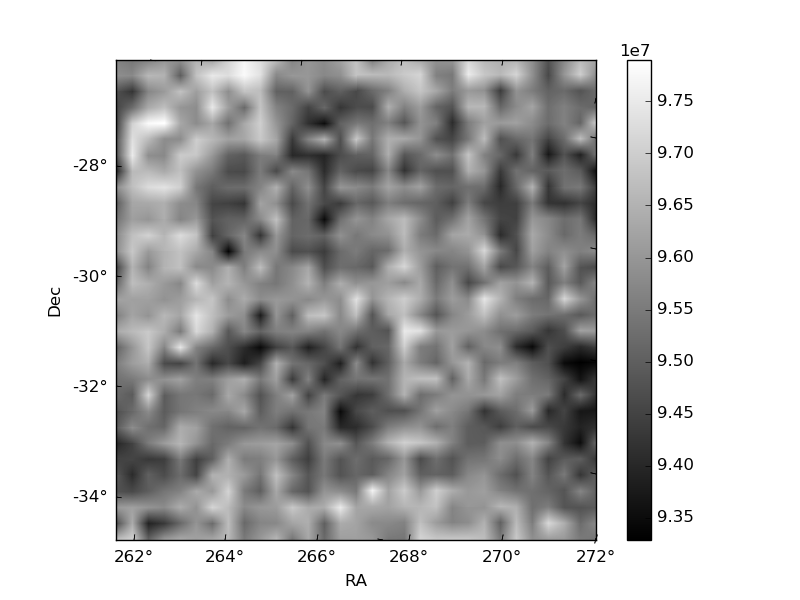
| Quadrant D | 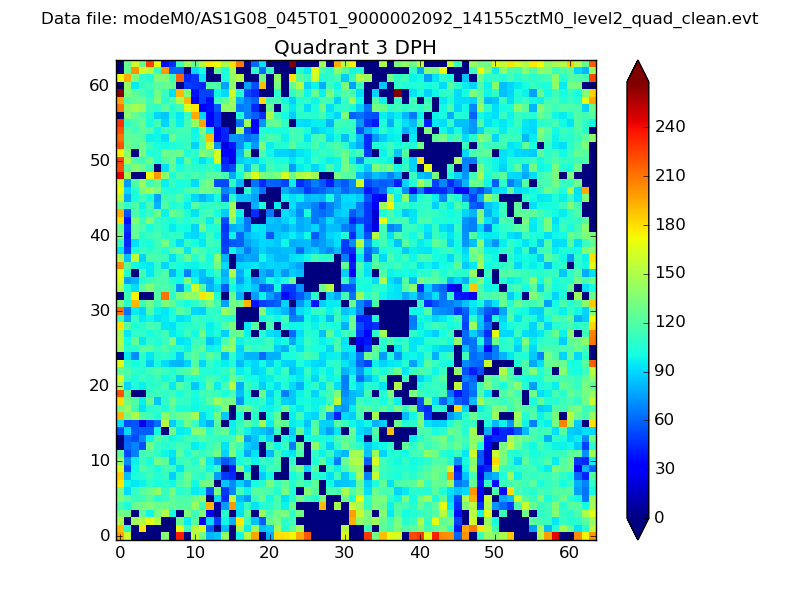 |
 |
Quadrant C |
| Plot type | Count rate plots | Images |
|---|---|---|
| Comparison with Poisson distribution Blue bars denote a histogram of data divided into 1 sec bins. Red curve is a Poisson curve with rate = median count rate of data. |
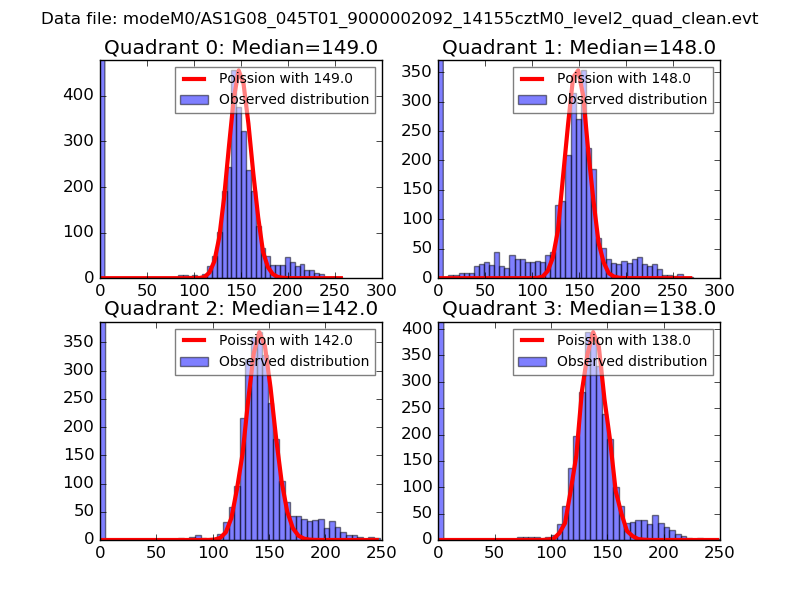 |
 |
| Quadrant-wise count rates Data is divided into 100 sec bins |
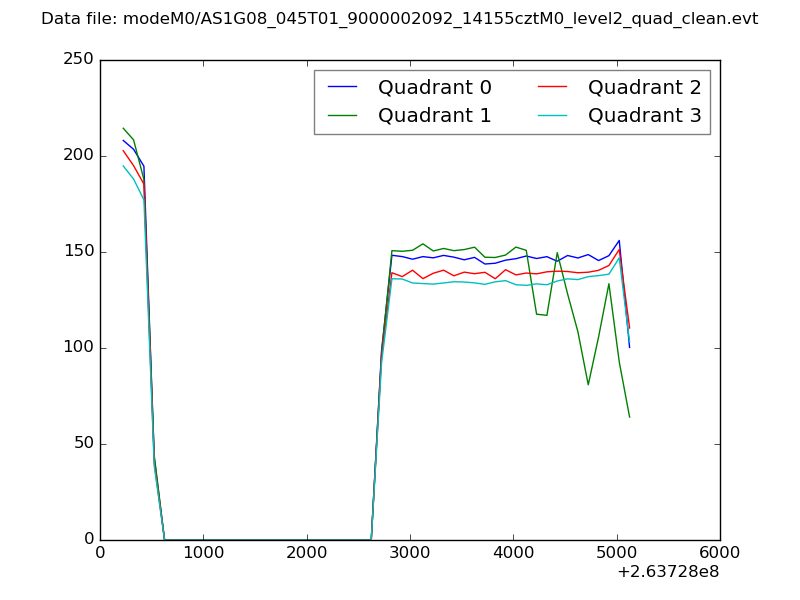 |
|
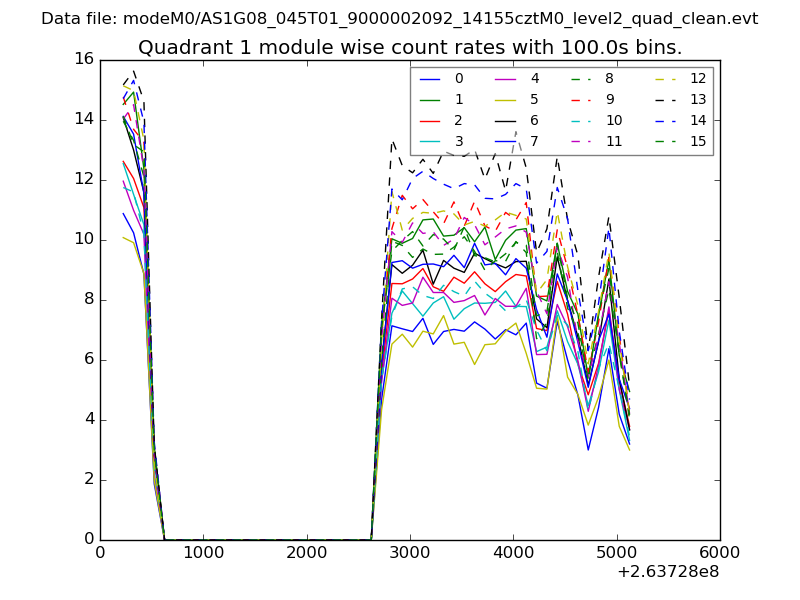
| Module-wise count rates for Quadrant A Data is divided into 100 sec bins |
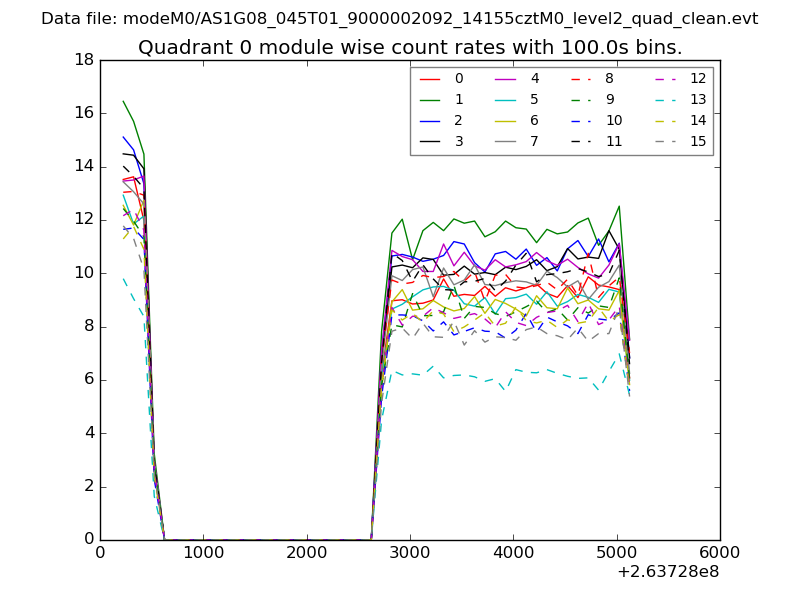 |
 |
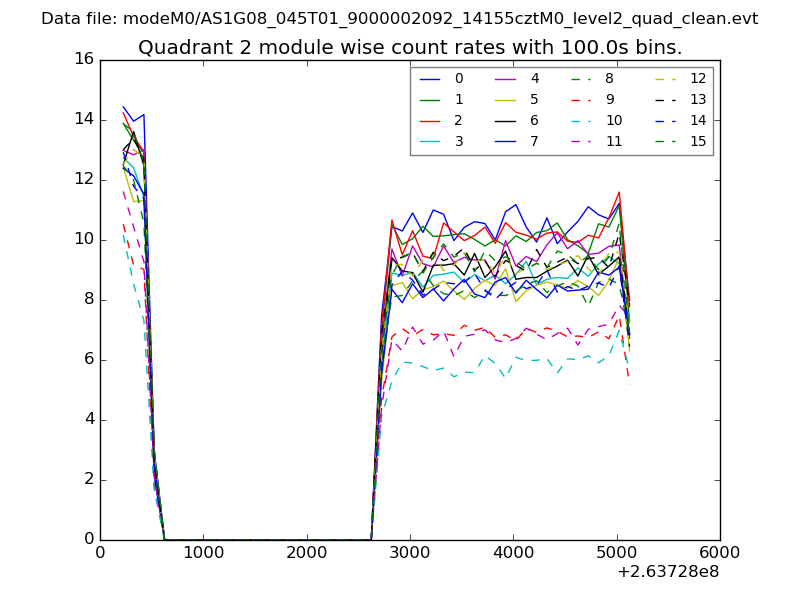
| Module-wise count rates for Quadrant B Data is divided into 100 sec bins |
 |
 |
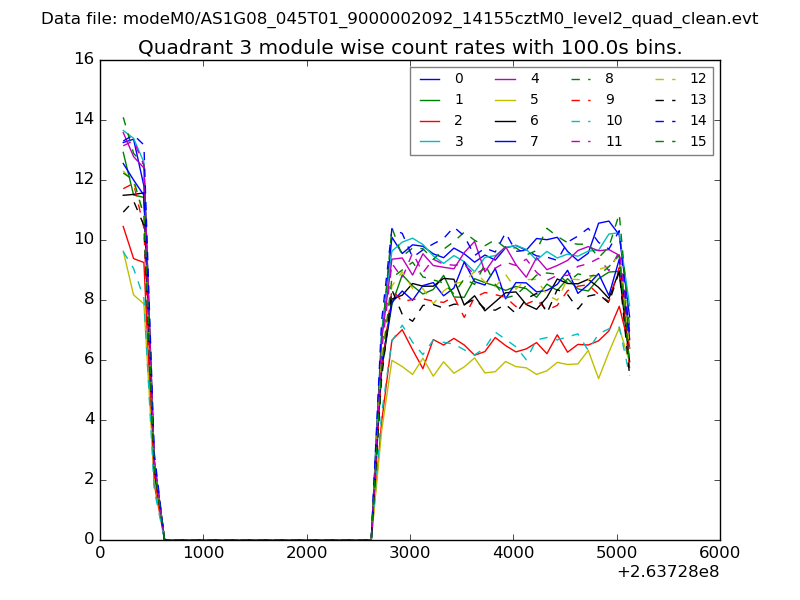
| Module-wise count rates for Quadrant C Data is divided into 100 sec bins |
 |
 |
| Module-wise count rates for Quadrant D Data is divided into 100 sec bins |
 |
 |
| Parameter | Plot |
|---|---|
| CZT HV Monitor | 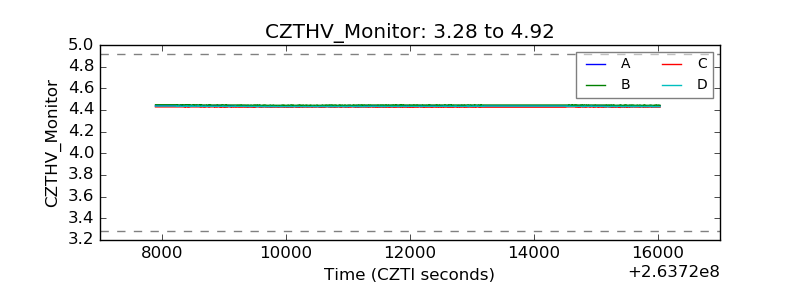 |
| D_VDD |  |
| Temperature 1 | 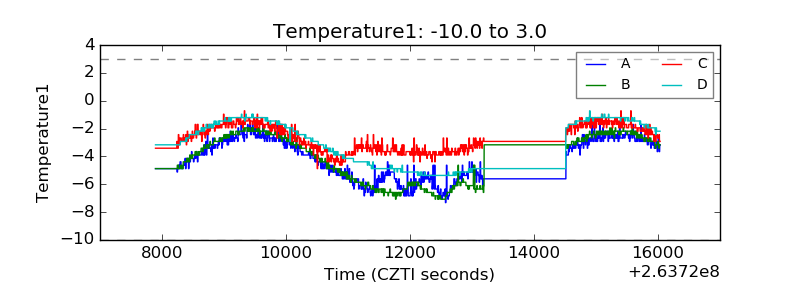 |
| Veto HV Monitor | 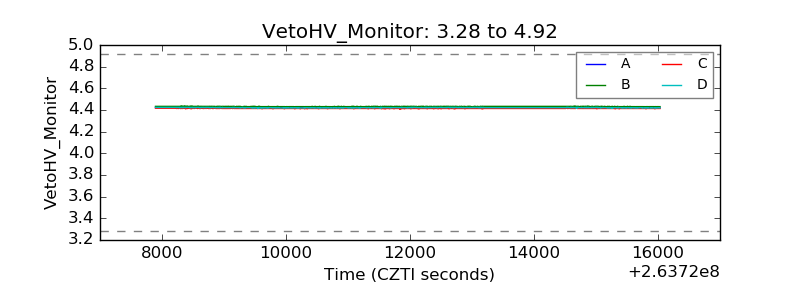 |
| Veto LLD |  |
| Alpha Counter | 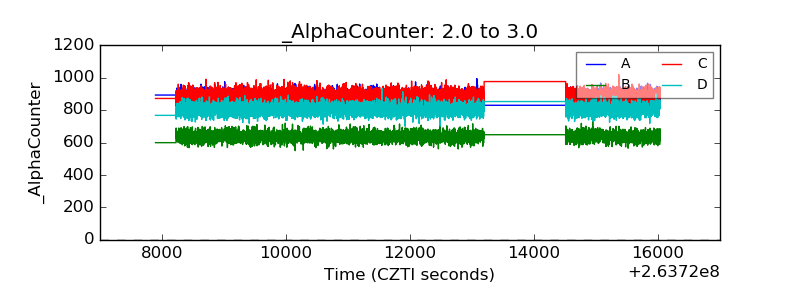 |
| _CPM_Rate | 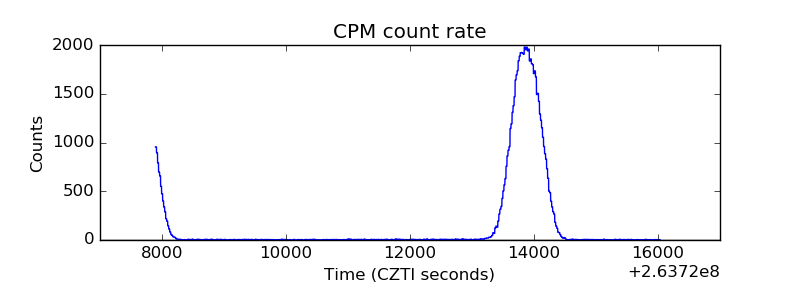 |
| CZT Counter | 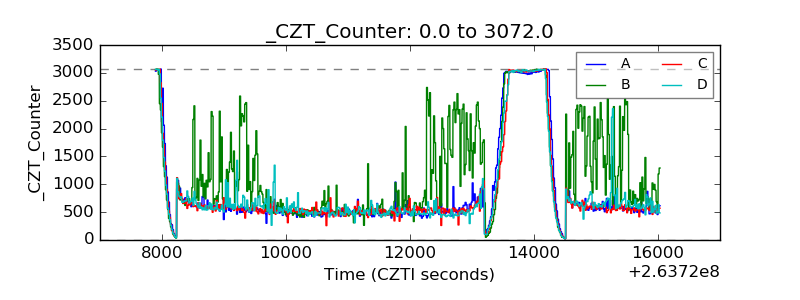 |
| +2.5 Volts monitor |  |
| +5 Volts monitor |  |
| _ROLL_ROT |  |
| _Roll_DEC | 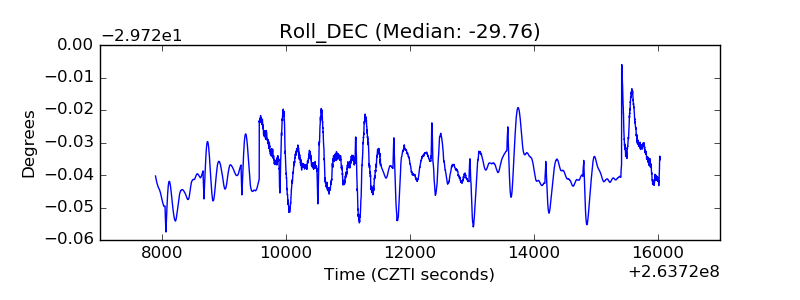 |
| _Roll_RA | 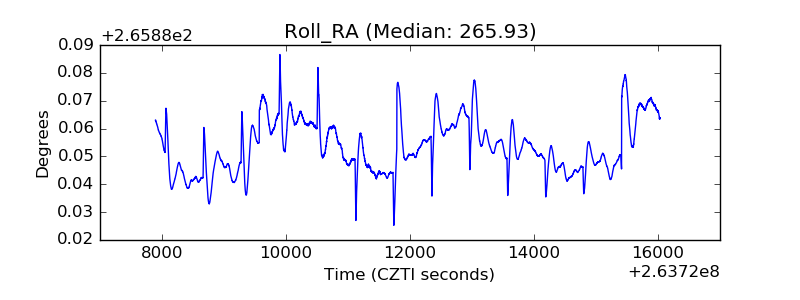 |
| Veto Counter | 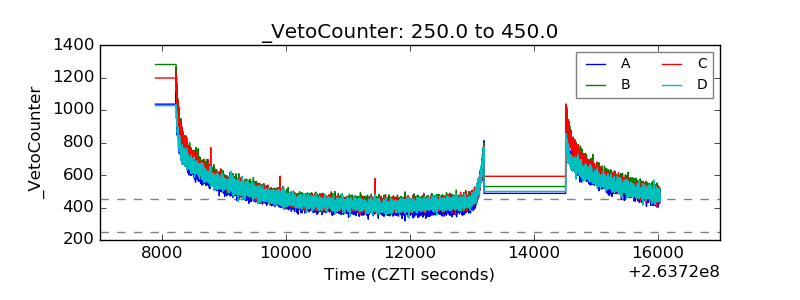 |