| Param | Original file | Final file |
|---|---|---|
| Filename | modeM0/AS1G08_045T01_9000002092_14156cztM0_level2.evt | modeM0/AS1G08_045T01_9000002092_14156cztM0_level2_quad_clean.evt |
| Size (bytes) | 606,363,840 | 68,823,360 |
| Size | 578.3 MB | 65.6 MB |
| Events in quadrant A | 3,436,399 | 422,770 |
| Events in quadrant B | 6,083,861 | 428,458 |
| Events in quadrant C | 3,627,311 | 403,919 |
| Events in quadrant D | 4,785,740 | 384,580 |
| Mode M9 | |||
|---|---|---|---|
| Quadrant | BADHDUFLAG | Total packets | Discarded packets |
| A | 0 | 14 | 0 |
| B | 0 | 14 | 0 |
| C | 0 | 14 | 0 |
| D | 0 | 15 | 0 |
| Mode SS | |||
|---|---|---|---|
| Quadrant | BADHDUFLAG | Total packets | Discarded packets |
| A | 0 | 128 | 0 |
| B | 0 | 128 | 0 |
| C | 0 | 128 | 0 |
| D | 0 | 128 | 0 |
| Mode M0 | |||
|---|---|---|---|
| Quadrant | BADHDUFLAG | Total packets | Discarded packets |
| A | 0 | 14092 | 3 |
| B | 0 | 22296 | 2 |
| C | 0 | 14656 | 2 |
| D | 0 | 18836 | 2 |
| Quadrant | Total seconds | Saturated seconds | Saturation percentage |
|---|---|---|---|
| A | 6366 | 121 | 1.900723% |
| B | 6366 | 1022 | 16.054037% |
| C | 6366 | 82 | 1.288093% |
| D | 6366 | 223 | 3.502985% |
Noise dominated data is calculated using 1-second bins in cleaned event files. If a bin has >2000 counts, and if more than 50% of those come from <1% of pixels, then it is considered to be noise-dominated and hence unusable.
| Quadrant | # 1 sec bins | Bins with >0 counts | Bins with >2000 counts | High rate bins dominated by noise | Noise dominated (total time) | Noise dominated (detector-on time) | Marked lightcurve |
|---|---|---|---|---|---|---|---|
| A | 7657 | 6368 | 3 | 3 | 0.04% | 0.05% | 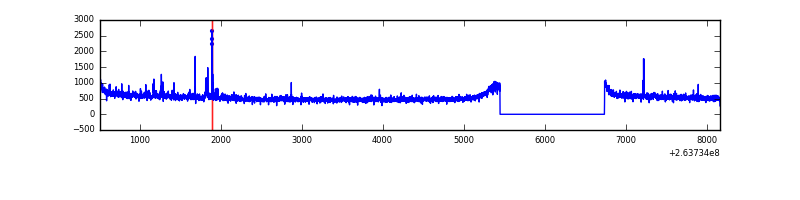 |
| B | 7657 | 6368 | 528 | 528 | 6.90% | 8.29% | 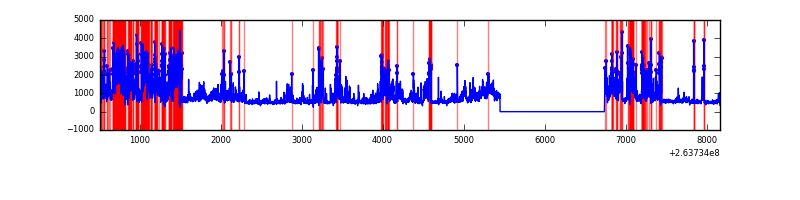 |
| C | 7657 | 6368 | 1 | 1 | 0.01% | 0.02% |  |
| D | 7657 | 6368 | 95 | 95 | 1.24% | 1.49% | 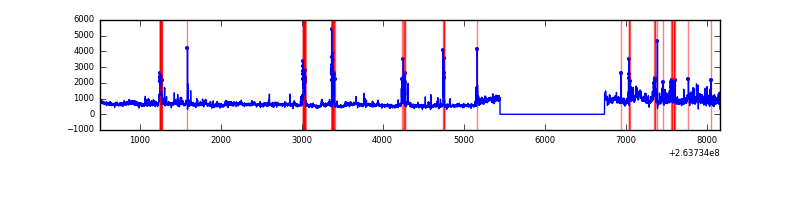 |
Top three noisy pixels from each quadrant. If the there are fewer than three noisy pixels in the level2.evt file, extra rows are filled as -1
| Pixel properties | Quadrant properties | ||||||
|---|---|---|---|---|---|---|---|
| Quadrant | DetID | PixID | Counts | Sigma | Mean | Median | Sigma |
| A | 9 | 143 | 48340 | 269.55 | 875 | 858 | 176.2 |
| A | 12 | 189 | 20629 | 112.24 | 875 | 858 | 176.2 |
| A | 0 | 226 | 7676 | 38.71 | 875 | 858 | 176.2 |
| B | 0 | 85 | 2653431 | 17424.81 | 817 | 801 | 152.2 |
| B | 0 | 189 | 115823 | 755.57 | 817 | 801 | 152.2 |
| B | 3 | 209 | 40724 | 262.25 | 817 | 801 | 152.2 |
| C | 3 | 233 | 378222 | 1976.26 | 832 | 838 | 191.0 |
| C | 13 | 61 | 6007 | 27.07 | 832 | 838 | 191.0 |
| C | 14 | 234 | 5341 | 23.58 | 832 | 838 | 191.0 |
| D | 8 | 195 | 586596 | 3003.33 | 829 | 811 | 195.0 |
| D | 1 | 52 | 449219 | 2299.0 | 829 | 811 | 195.0 |
| D | 15 | 0 | 348978 | 1785.06 | 829 | 811 | 195.0 |
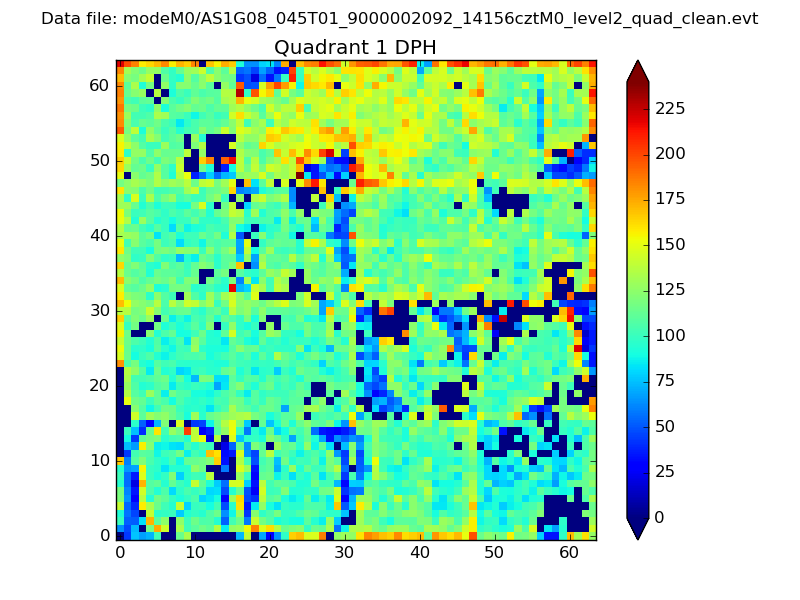
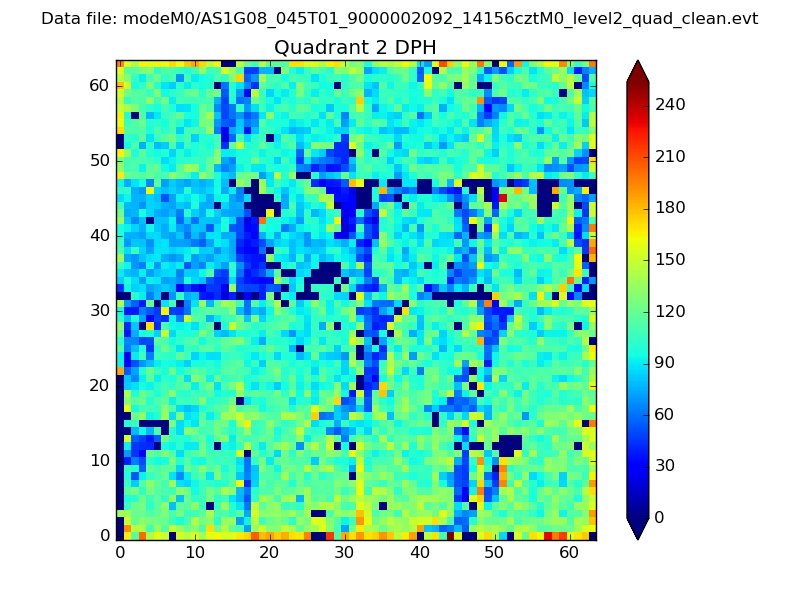
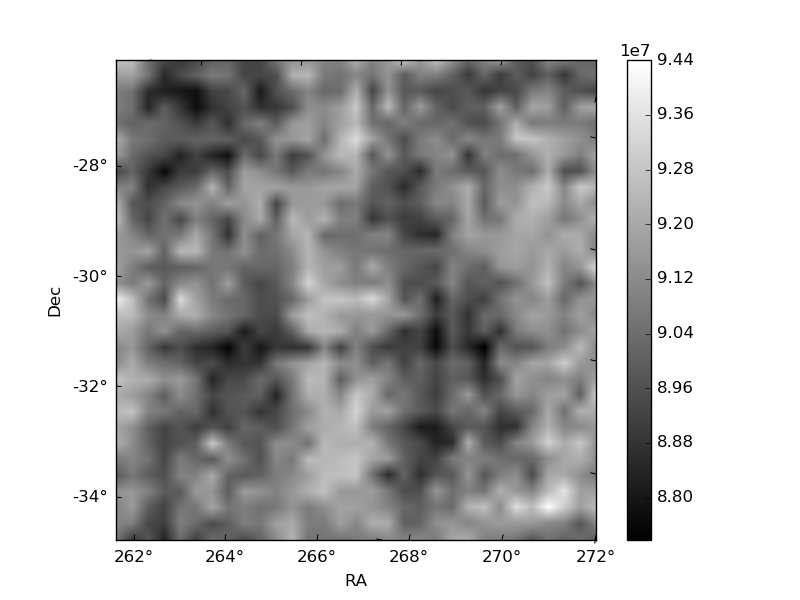
Histogram calculated using DETX and DETY for each event in the final _common_clean file
| Quadrant A | 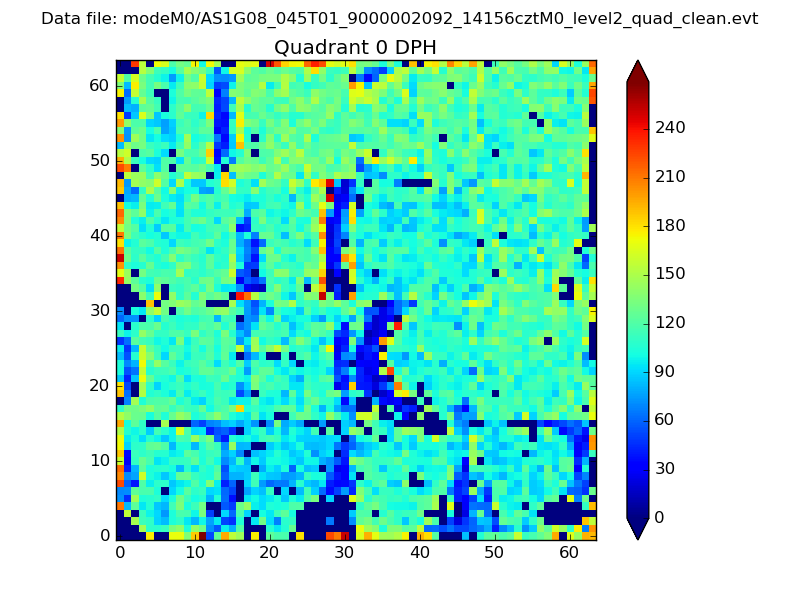 |
 |
Quadrant B |
|---|---|---|---|
| Quadrant D | 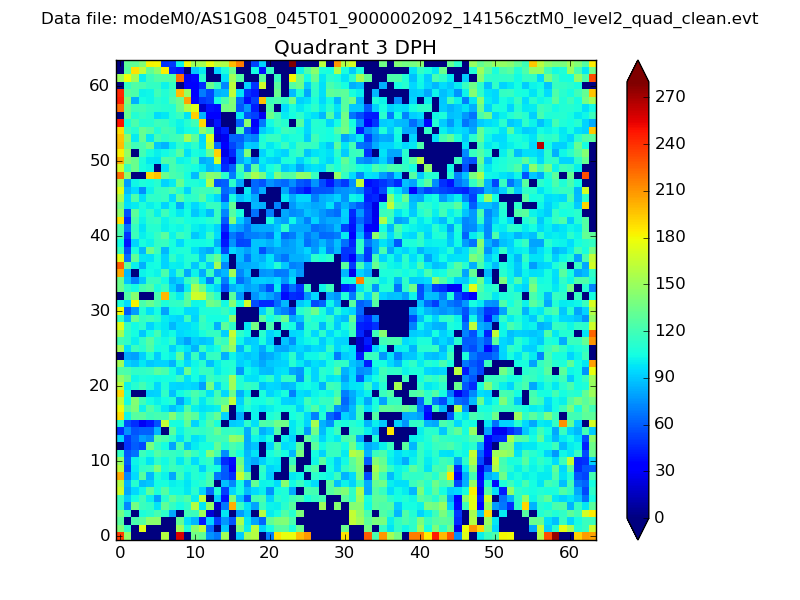 |
 |
Quadrant C |
| Plot type | Count rate plots | Images |
|---|---|---|
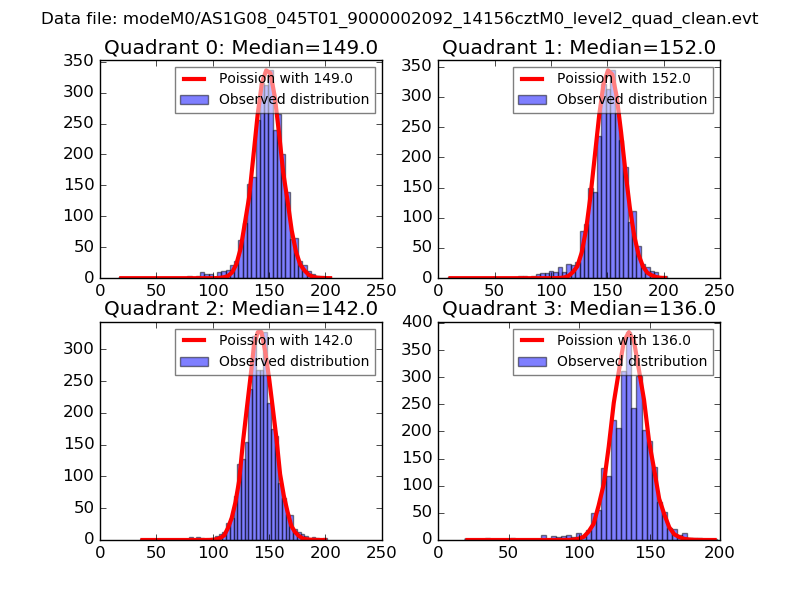
| Comparison with Poisson distribution Blue bars denote a histogram of data divided into 1 sec bins. Red curve is a Poisson curve with rate = median count rate of data. |
 |
 |
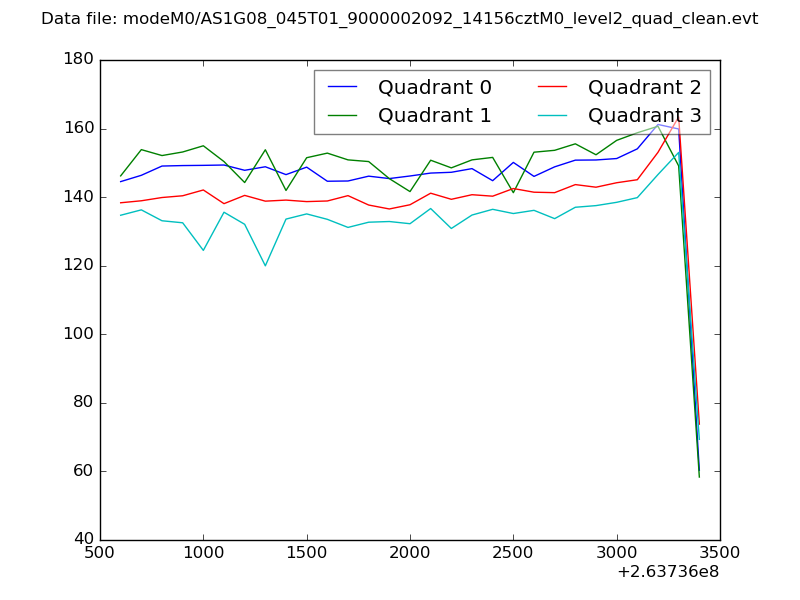
| Quadrant-wise count rates Data is divided into 100 sec bins |
 |
|
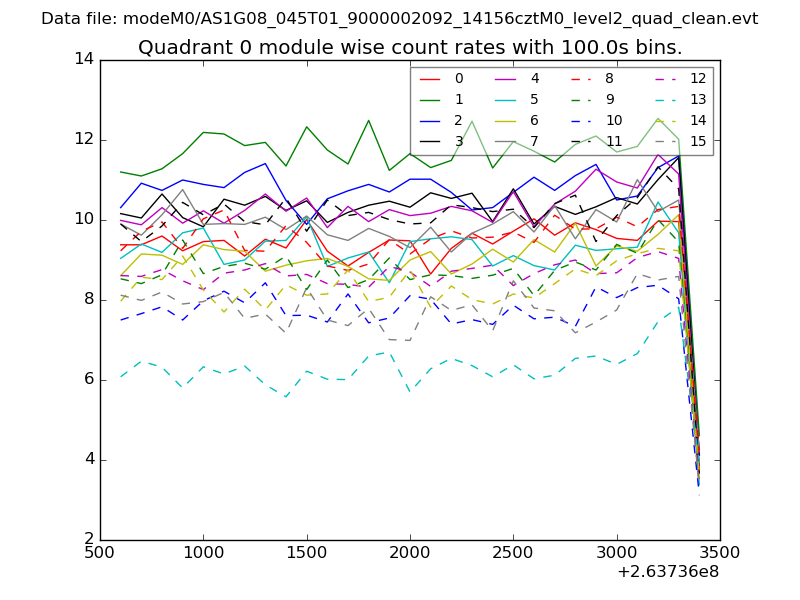
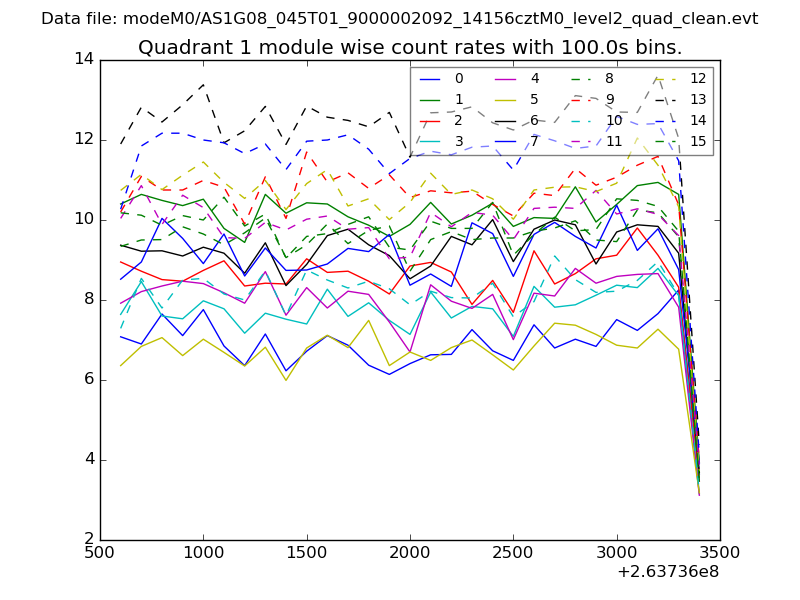
| Module-wise count rates for Quadrant A Data is divided into 100 sec bins |
 |
 |
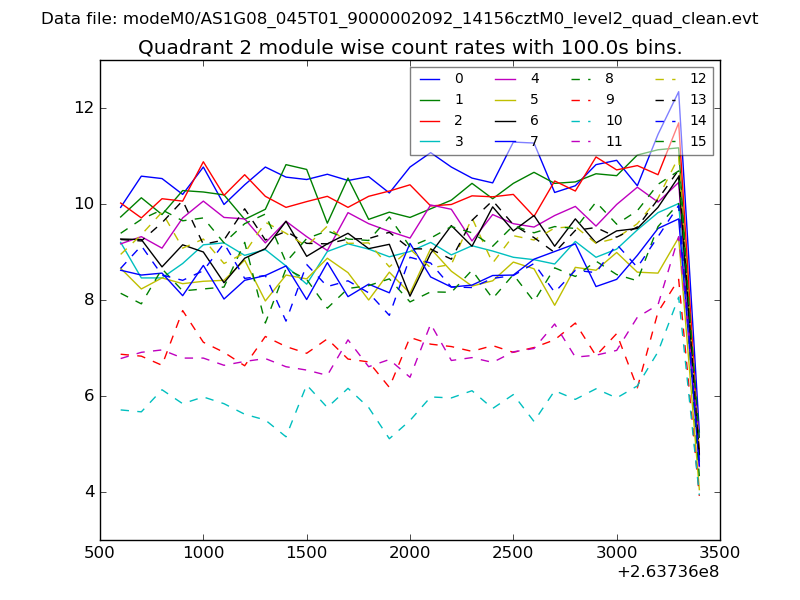
| Module-wise count rates for Quadrant B Data is divided into 100 sec bins |
 |
 |
| Module-wise count rates for Quadrant C Data is divided into 100 sec bins |
 |
 |
| Module-wise count rates for Quadrant D Data is divided into 100 sec bins |
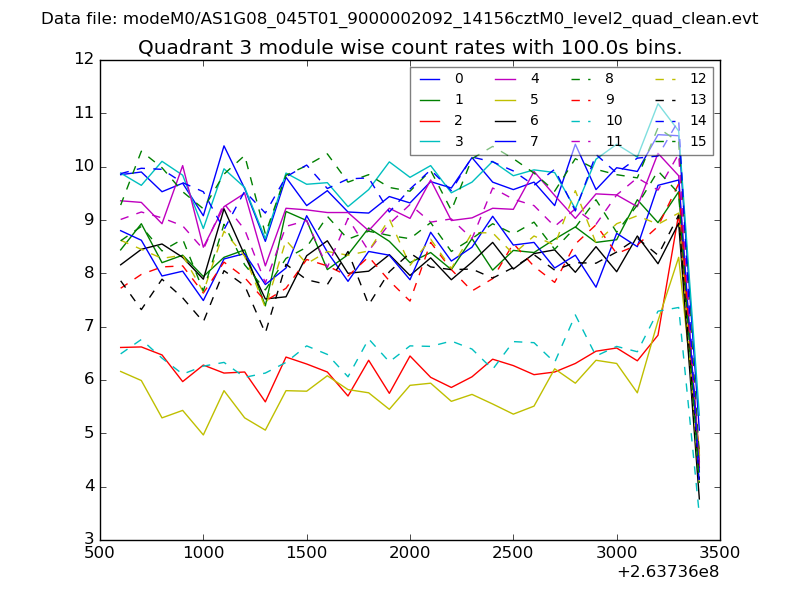 |
 |
| Parameter | Plot |
|---|---|
| CZT HV Monitor | 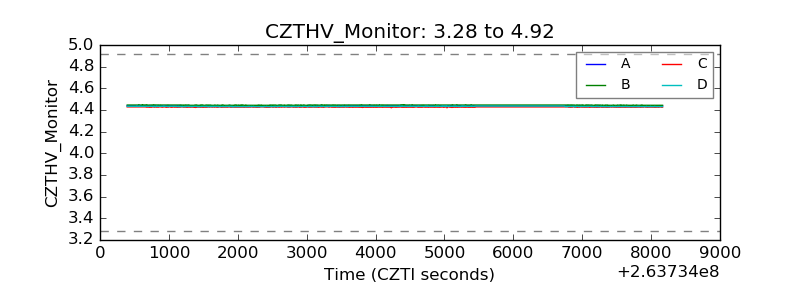 |
| D_VDD | 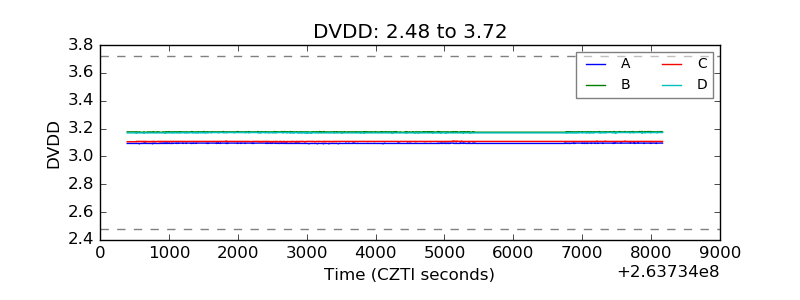 |
| Temperature 1 | 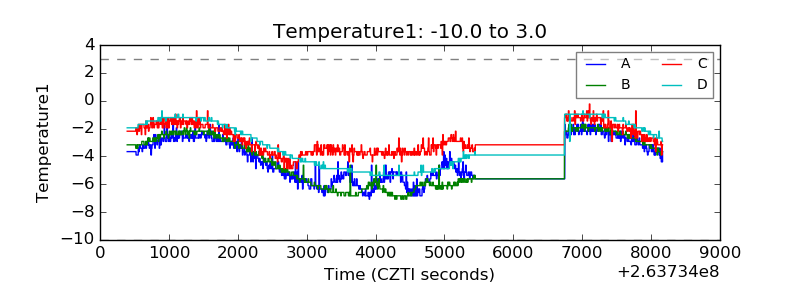 |
| Veto HV Monitor | 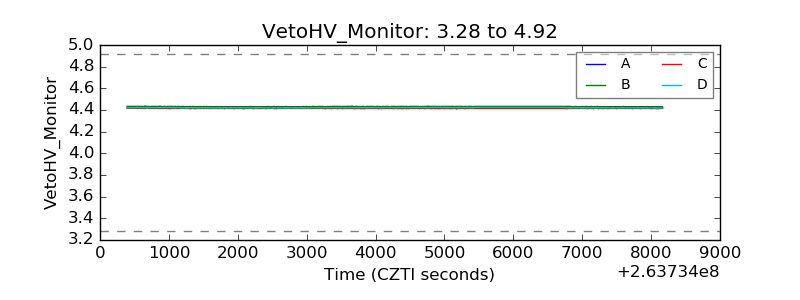 |
| Veto LLD | 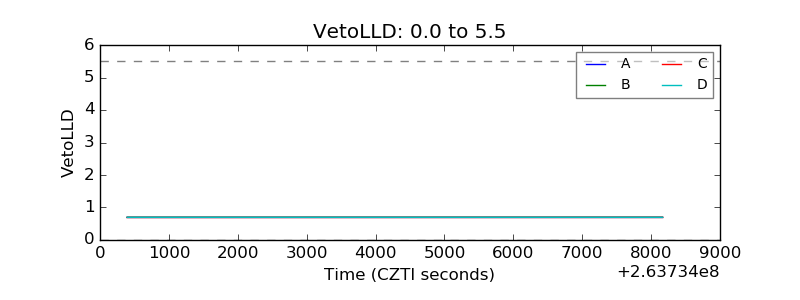 |
| Alpha Counter | 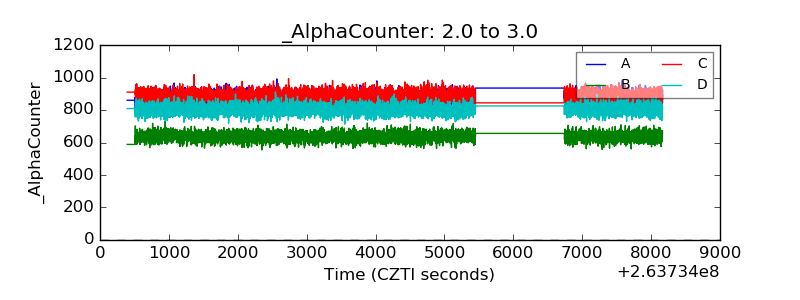 |
| _CPM_Rate | 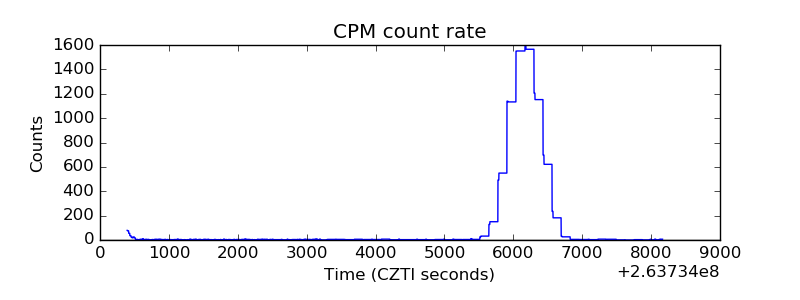 |
| CZT Counter | 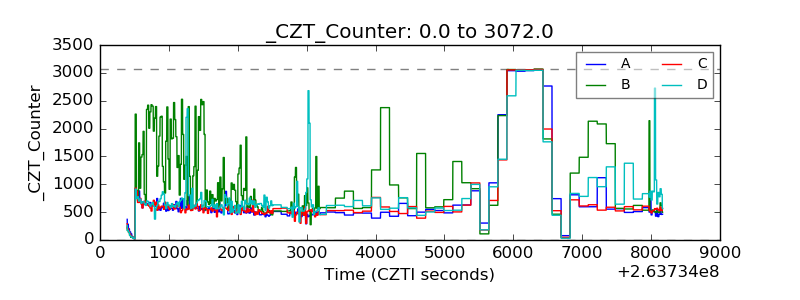 |
| +2.5 Volts monitor |  |
| +5 Volts monitor |  |
| _ROLL_ROT | 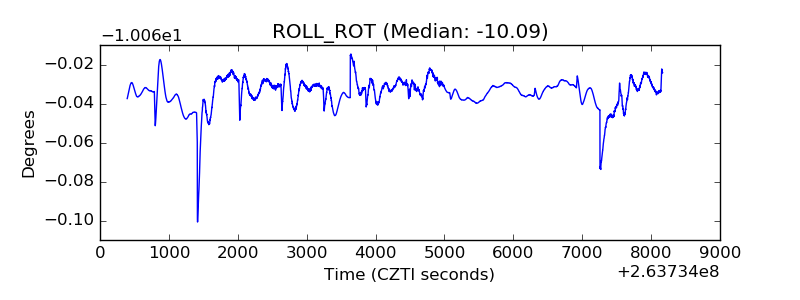 |
| _Roll_DEC | 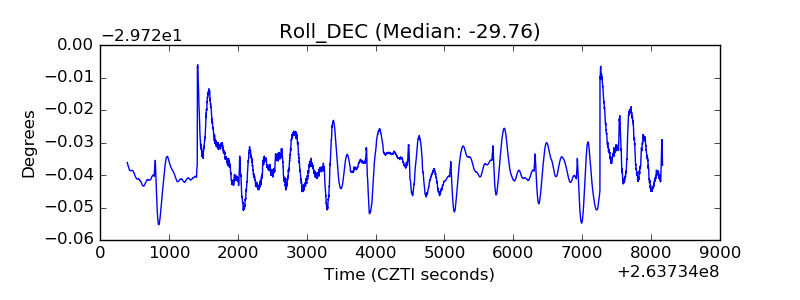 |
| _Roll_RA | 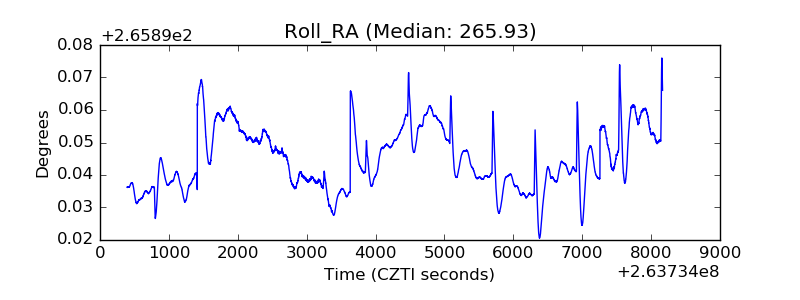 |
| Veto Counter | 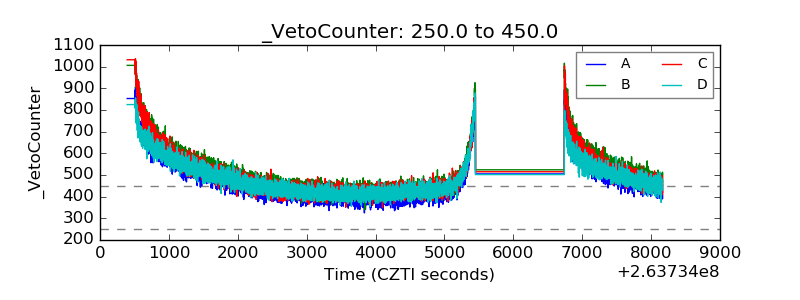 |