| Param | Original file | Final file |
|---|---|---|
| Filename | modeM0/AS1G08_045T01_9000002092_14157cztM0_level2.evt | modeM0/AS1G08_045T01_9000002092_14157cztM0_level2_quad_clean.evt |
| Size (bytes) | 557,804,160 | 76,317,120 |
| Size | 532.0 MB | 72.8 MB |
| Events in quadrant A | 3,238,185 | 484,828 |
| Events in quadrant B | 4,761,370 | 493,741 |
| Events in quadrant C | 3,473,997 | 462,945 |
| Events in quadrant D | 4,994,059 | 430,724 |
| Mode M9 | |||
|---|---|---|---|
| Quadrant | BADHDUFLAG | Total packets | Discarded packets |
| A | 0 | 22 | 0 |
| B | 0 | 22 | 0 |
| C | 0 | 22 | 0 |
| D | 0 | 23 | 0 |
| Mode SS | |||
|---|---|---|---|
| Quadrant | BADHDUFLAG | Total packets | Discarded packets |
| A | 0 | 126 | 0 |
| B | 0 | 126 | 0 |
| C | 0 | 126 | 0 |
| D | 0 | 126 | 0 |
| Mode M0 | |||
|---|---|---|---|
| Quadrant | BADHDUFLAG | Total packets | Discarded packets |
| A | 0 | 13455 | 3 |
| B | 0 | 18041 | 2 |
| C | 0 | 14133 | 2 |
| D | 0 | 19217 | 2 |
| Quadrant | Total seconds | Saturated seconds | Saturation percentage |
|---|---|---|---|
| A | 6289 | 102 | 1.621879% |
| B | 6289 | 497 | 7.902687% |
| C | 6289 | 51 | 0.810940% |
| D | 6289 | 281 | 4.468119% |
Noise dominated data is calculated using 1-second bins in cleaned event files. If a bin has >2000 counts, and if more than 50% of those come from <1% of pixels, then it is considered to be noise-dominated and hence unusable.
| Quadrant | # 1 sec bins | Bins with >0 counts | Bins with >2000 counts | High rate bins dominated by noise | Noise dominated (total time) | Noise dominated (detector-on time) | Marked lightcurve |
|---|---|---|---|---|---|---|---|
| A | 7530 | 6291 | 0 | 0 | 0.00% | 0.00% | 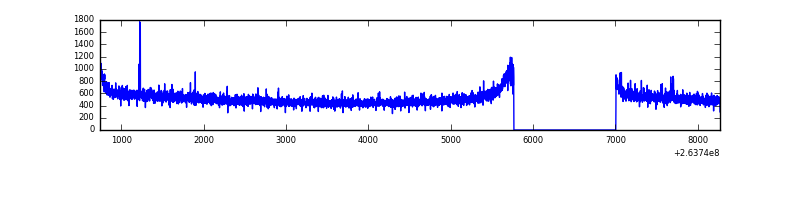 |
| B | 7530 | 6291 | 208 | 208 | 2.76% | 3.31% | 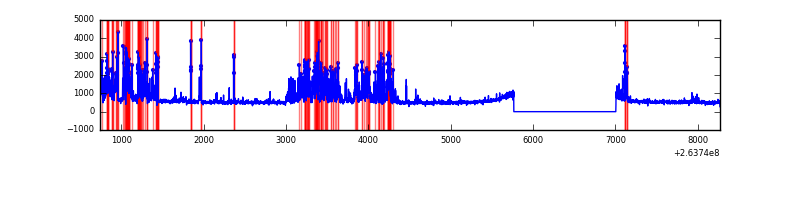 |
| C | 7530 | 6291 | 0 | 0 | 0.00% | 0.00% | 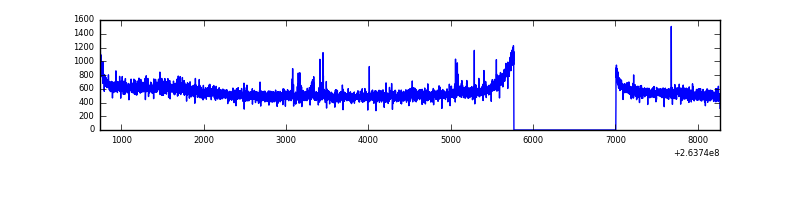 |
| D | 7530 | 6291 | 226 | 226 | 3.00% | 3.59% | 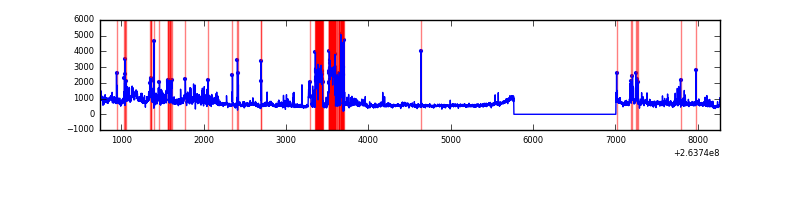 |
Top three noisy pixels from each quadrant. If the there are fewer than three noisy pixels in the level2.evt file, extra rows are filled as -1
| Pixel properties | Quadrant properties | ||||||
|---|---|---|---|---|---|---|---|
| Quadrant | DetID | PixID | Counts | Sigma | Mean | Median | Sigma |
| A | 12 | 189 | 8334 | 44.73 | 836 | 820 | 168.0 |
| A | 0 | 226 | 7569 | 40.18 | 836 | 820 | 168.0 |
| A | 12 | 194 | 6285 | 32.53 | 836 | 820 | 168.0 |
| B | 0 | 85 | 1421625 | 9174.4 | 822 | 806 | 154.9 |
| B | 0 | 228 | 40395 | 255.63 | 822 | 806 | 154.9 |
| B | 3 | 209 | 25430 | 159.0 | 822 | 806 | 154.9 |
| C | 3 | 233 | 327666 | 1786.29 | 799 | 805 | 183.0 |
| C | 0 | 207 | 29378 | 156.15 | 799 | 805 | 183.0 |
| C | 13 | 61 | 5819 | 27.4 | 799 | 805 | 183.0 |
| D | 1 | 52 | 685291 | 3670.23 | 784 | 765 | 186.5 |
| D | 15 | 0 | 539391 | 2887.95 | 784 | 765 | 186.5 |
| D | 8 | 195 | 524784 | 2809.64 | 784 | 765 | 186.5 |
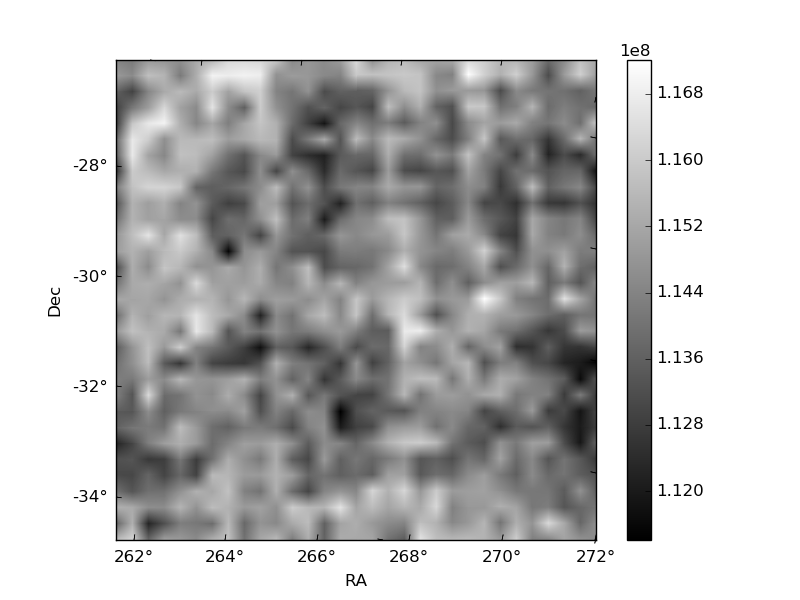
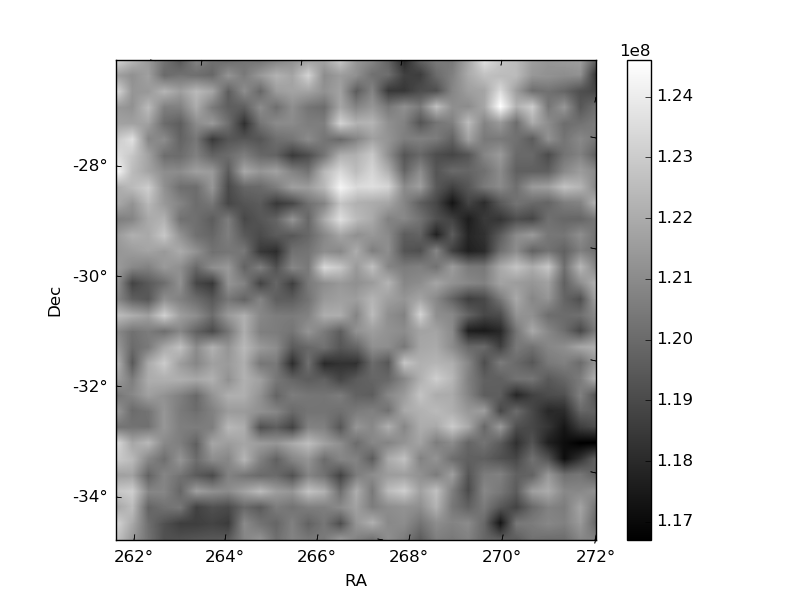
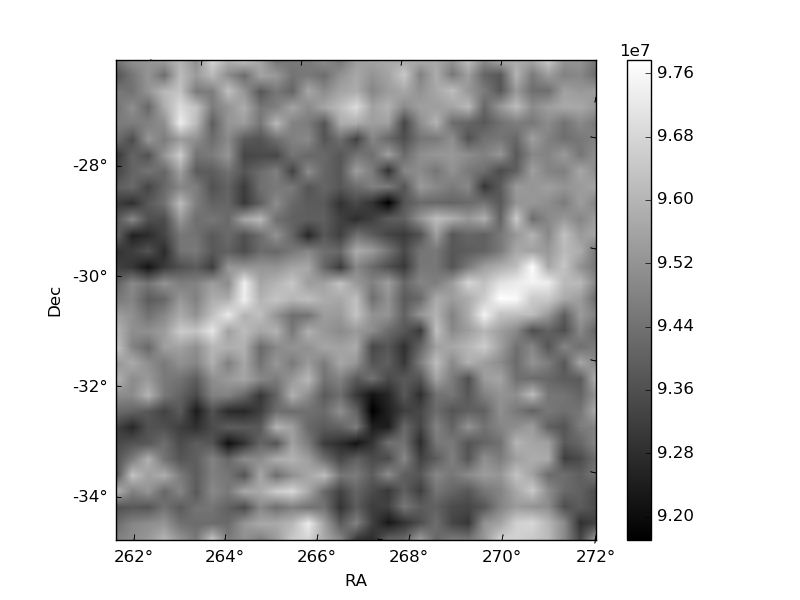
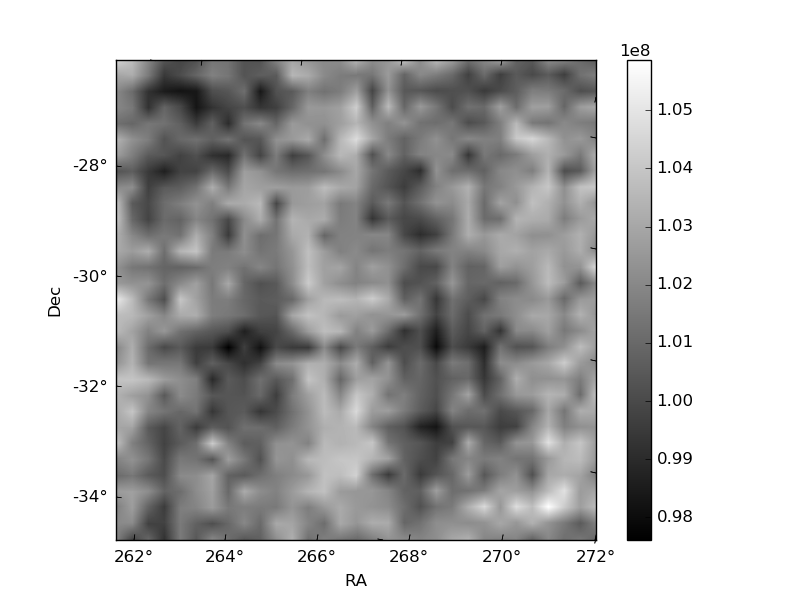
Histogram calculated using DETX and DETY for each event in the final _common_clean file
| Quadrant A |  |
 |
Quadrant B |
|---|---|---|---|
| Quadrant D |  |
 |
Quadrant C |
| Plot type | Count rate plots | Images |
|---|---|---|
| Comparison with Poisson distribution Blue bars denote a histogram of data divided into 1 sec bins. Red curve is a Poisson curve with rate = median count rate of data. |
 |
 |
| Quadrant-wise count rates Data is divided into 100 sec bins |
 |
|
| Module-wise count rates for Quadrant A Data is divided into 100 sec bins |
 |
 |
| Module-wise count rates for Quadrant B Data is divided into 100 sec bins |
 |
 |
| Module-wise count rates for Quadrant C Data is divided into 100 sec bins |
 |
 |
| Module-wise count rates for Quadrant D Data is divided into 100 sec bins |
 |
 |
| Parameter | Plot |
|---|---|
| CZT HV Monitor |  |
| D_VDD |  |
| Temperature 1 | 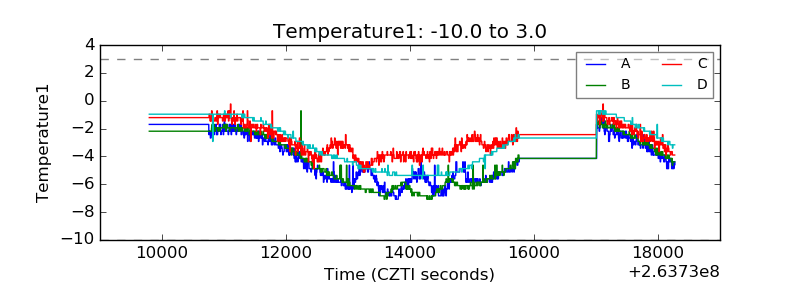 |
| Veto HV Monitor |  |
| Veto LLD |  |
| Alpha Counter |  |
| _CPM_Rate |  |
| CZT Counter |  |
| +2.5 Volts monitor |  |
| +5 Volts monitor |  |
| _ROLL_ROT |  |
| _Roll_DEC |  |
| _Roll_RA |  |
| Veto Counter |  |