| Param | Original file | Final file |
|---|---|---|
| Filename | modeM0/AS1G08_045T01_9000002092_14158cztM0_level2.evt | modeM0/AS1G08_045T01_9000002092_14158cztM0_level2_quad_clean.evt |
| Size (bytes) | 530,665,920 | 86,906,880 |
| Size | 506.1 MB | 82.9 MB |
| Events in quadrant A | 3,376,586 | 556,520 |
| Events in quadrant B | 4,645,787 | 576,531 |
| Events in quadrant C | 3,310,994 | 534,304 |
| Events in quadrant D | 4,295,169 | 508,817 |
| Mode M9 | |||
|---|---|---|---|
| Quadrant | BADHDUFLAG | Total packets | Discarded packets |
| A | 0 | 15 | 0 |
| B | 0 | 15 | 0 |
| C | 0 | 15 | 0 |
| D | 0 | 16 | 0 |
| Mode SS | |||
|---|---|---|---|
| Quadrant | BADHDUFLAG | Total packets | Discarded packets |
| A | 0 | 132 | 0 |
| B | 0 | 132 | 0 |
| C | 0 | 132 | 0 |
| D | 0 | 132 | 0 |
| Mode M0 | |||
|---|---|---|---|
| Quadrant | BADHDUFLAG | Total packets | Discarded packets |
| A | 0 | 14048 | 3 |
| B | 0 | 17893 | 2 |
| C | 0 | 13700 | 2 |
| D | 0 | 17366 | 2 |
| Quadrant | Total seconds | Saturated seconds | Saturation percentage |
|---|---|---|---|
| A | 6534 | 63 | 0.964187% |
| B | 6534 | 363 | 5.555556% |
| C | 6534 | 22 | 0.336700% |
| D | 6534 | 56 | 0.857055% |
Noise dominated data is calculated using 1-second bins in cleaned event files. If a bin has >2000 counts, and if more than 50% of those come from <1% of pixels, then it is considered to be noise-dominated and hence unusable.
| Quadrant | # 1 sec bins | Bins with >0 counts | Bins with >2000 counts | High rate bins dominated by noise | Noise dominated (total time) | Noise dominated (detector-on time) | Marked lightcurve |
|---|---|---|---|---|---|---|---|
| A | 7520 | 6536 | 5 | 5 | 0.07% | 0.08% | 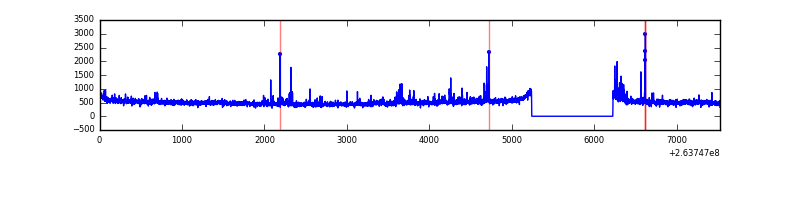 |
| B | 7520 | 6536 | 115 | 115 | 1.53% | 1.76% | 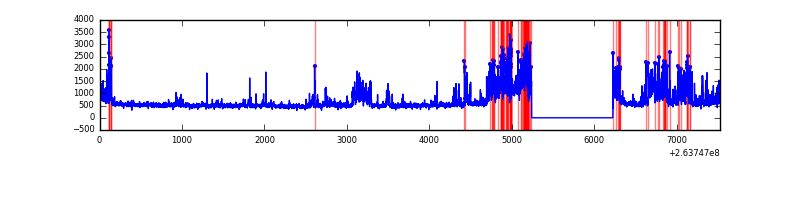 |
| C | 7520 | 6536 | 1 | 1 | 0.01% | 0.02% |  |
| D | 7520 | 6536 | 17 | 17 | 0.23% | 0.26% | 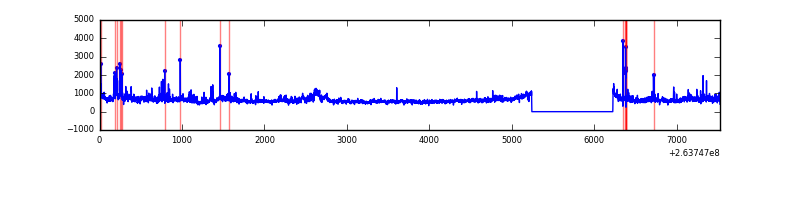 |
Top three noisy pixels from each quadrant. If the there are fewer than three noisy pixels in the level2.evt file, extra rows are filled as -1
| Pixel properties | Quadrant properties | ||||||
|---|---|---|---|---|---|---|---|
| Quadrant | DetID | PixID | Counts | Sigma | Mean | Median | Sigma |
| A | 9 | 143 | 110353 | 658.56 | 827 | 812 | 166.3 |
| A | 12 | 189 | 36297 | 213.34 | 827 | 812 | 166.3 |
| A | 12 | 96 | 21493 | 124.33 | 827 | 812 | 166.3 |
| B | 0 | 85 | 1234786 | 7947.32 | 817 | 799 | 155.3 |
| B | 0 | 189 | 120506 | 770.96 | 817 | 799 | 155.3 |
| B | 0 | 219 | 32320 | 203.01 | 817 | 799 | 155.3 |
| C | 3 | 233 | 198364 | 1087.44 | 792 | 799 | 181.7 |
| C | 0 | 207 | 17603 | 92.49 | 792 | 799 | 181.7 |
| C | 10 | 22 | 7437 | 36.54 | 792 | 799 | 181.7 |
| D | 8 | 195 | 749126 | 3990.67 | 783 | 764 | 187.5 |
| D | 1 | 52 | 242109 | 1286.98 | 783 | 764 | 187.5 |
| D | 15 | 0 | 101665 | 538.06 | 783 | 764 | 187.5 |
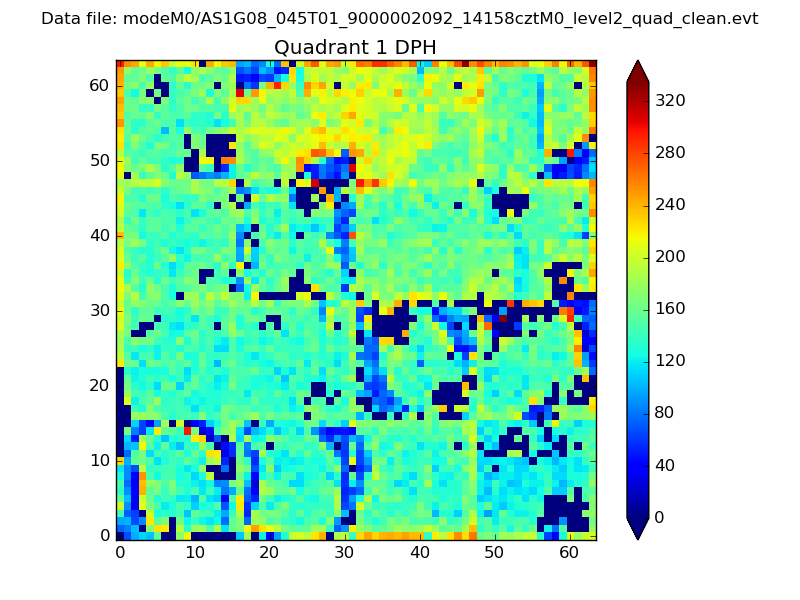
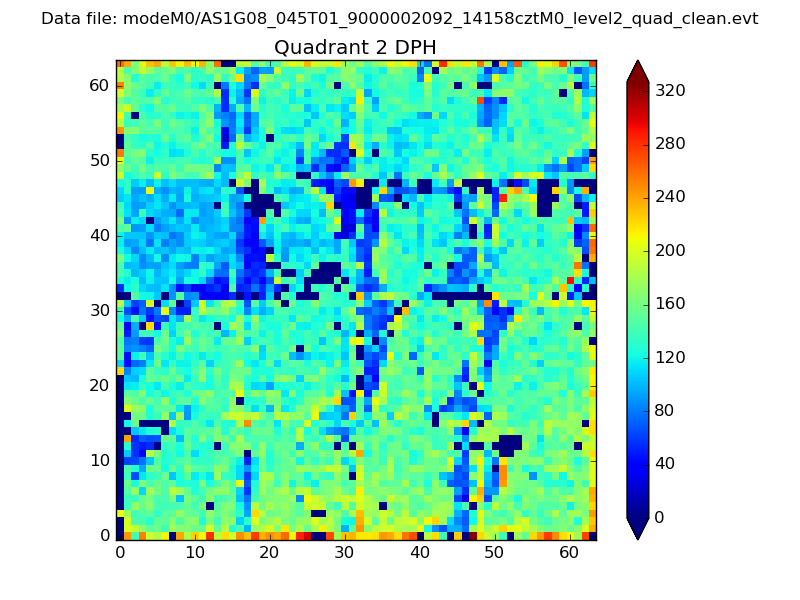
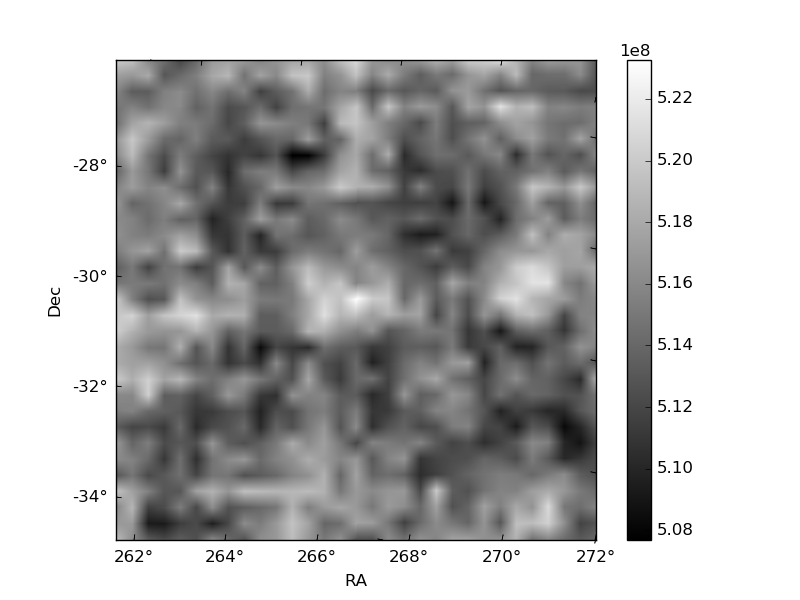
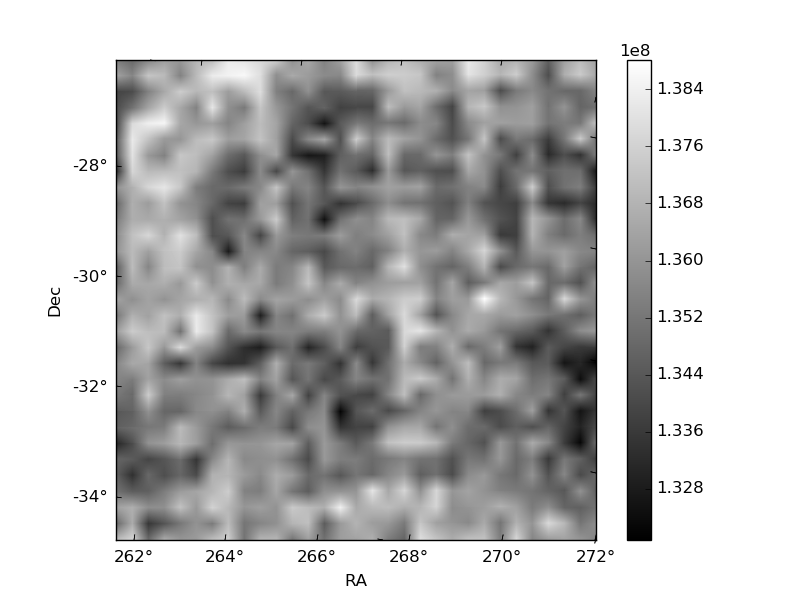
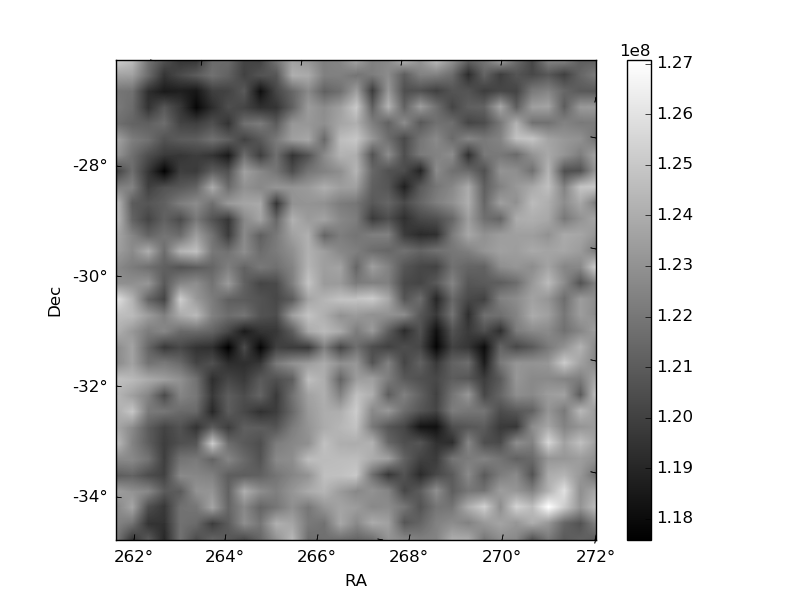
Histogram calculated using DETX and DETY for each event in the final _common_clean file
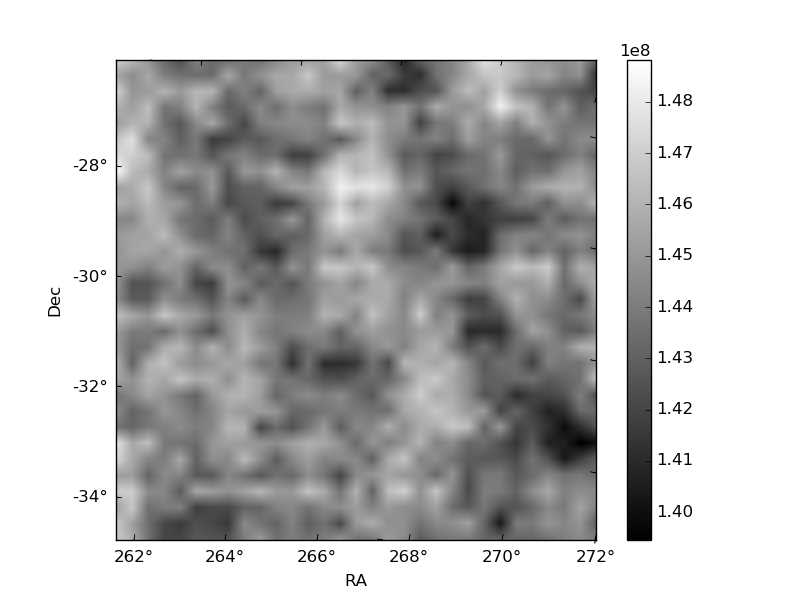
| Quadrant A | 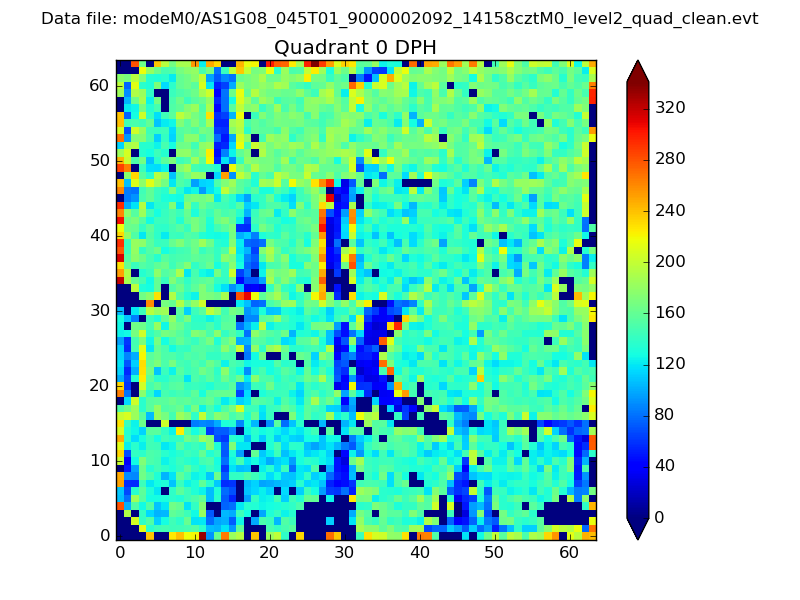 |
 |
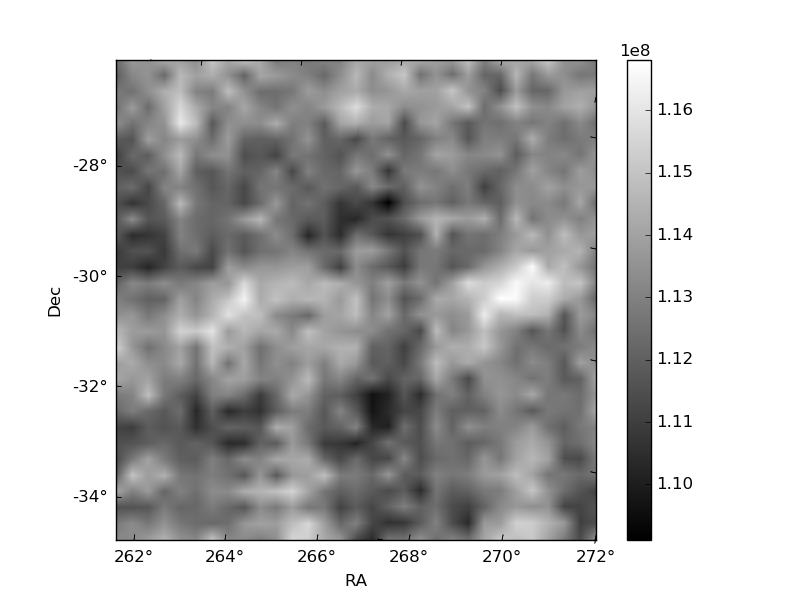
Quadrant B |
|---|---|---|---|
| Quadrant D | 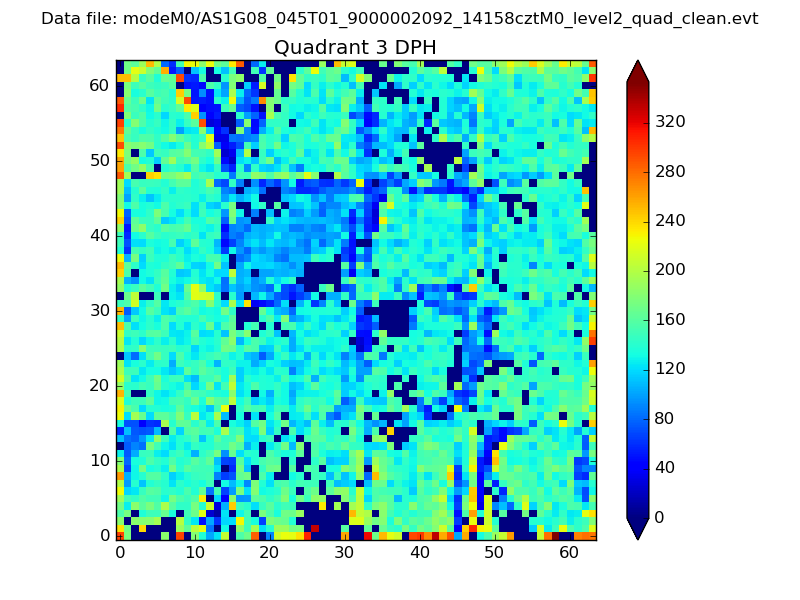 |
 |
Quadrant C |
| Plot type | Count rate plots | Images |
|---|---|---|
| Comparison with Poisson distribution Blue bars denote a histogram of data divided into 1 sec bins. Red curve is a Poisson curve with rate = median count rate of data. |
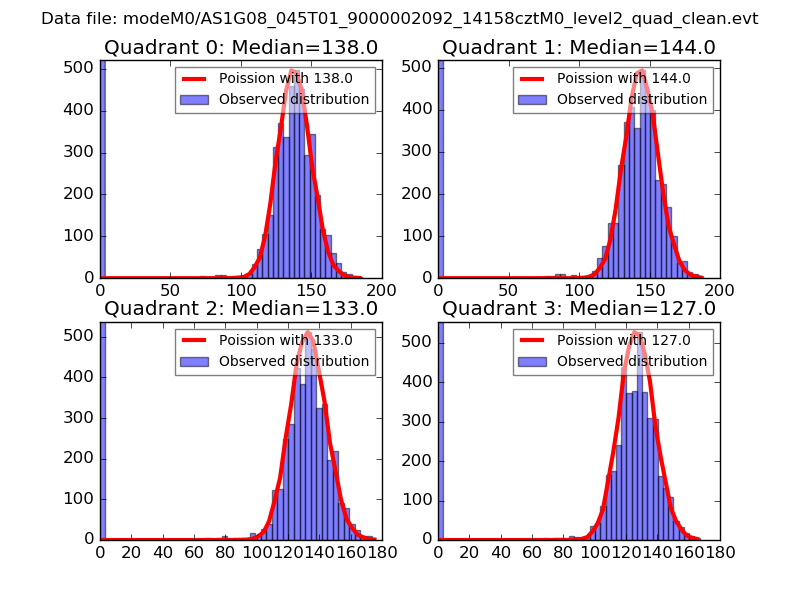 |
 |
| Quadrant-wise count rates Data is divided into 100 sec bins |
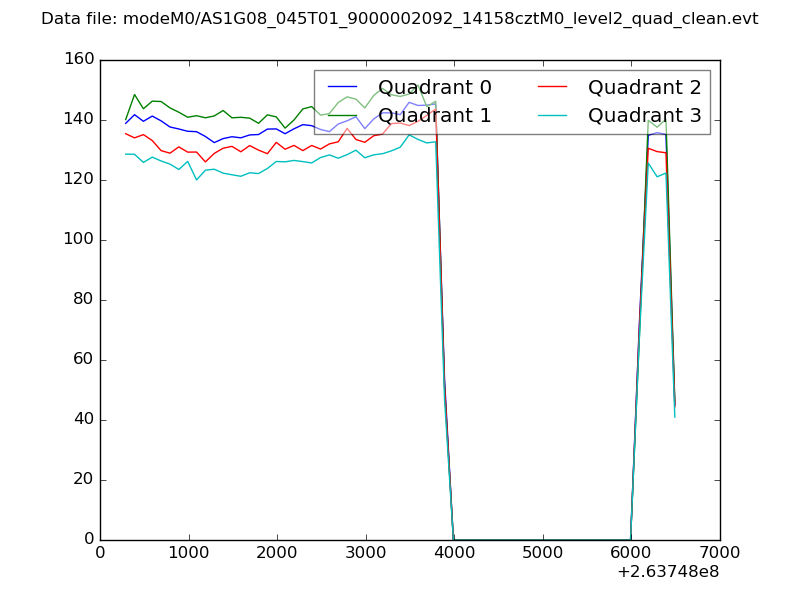 |
|
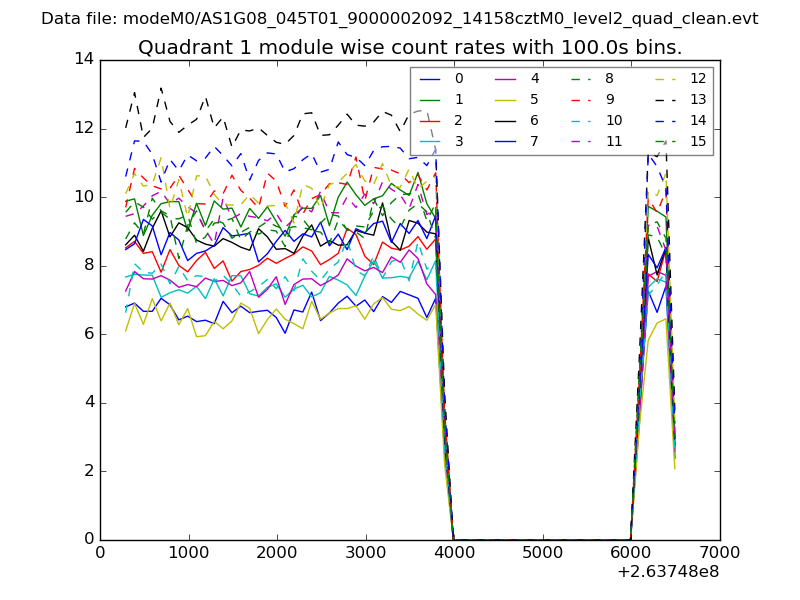
| Module-wise count rates for Quadrant A Data is divided into 100 sec bins |
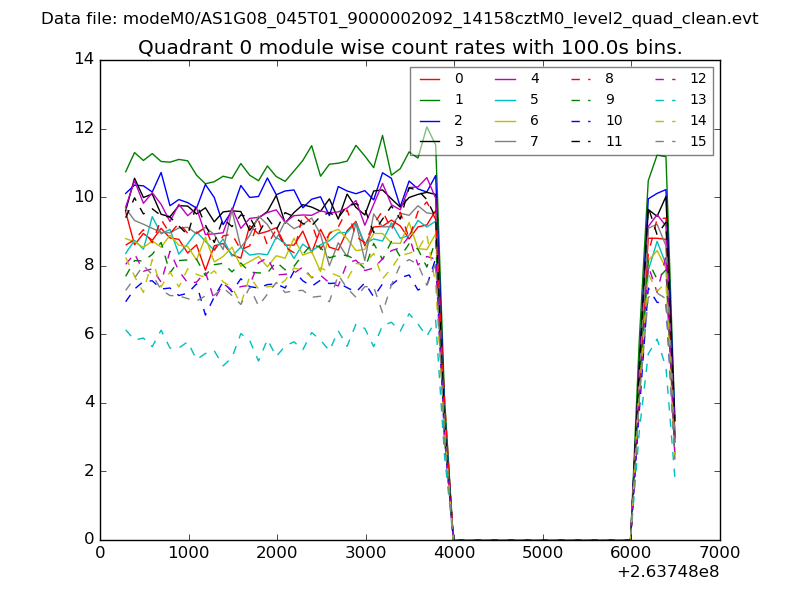 |
 |
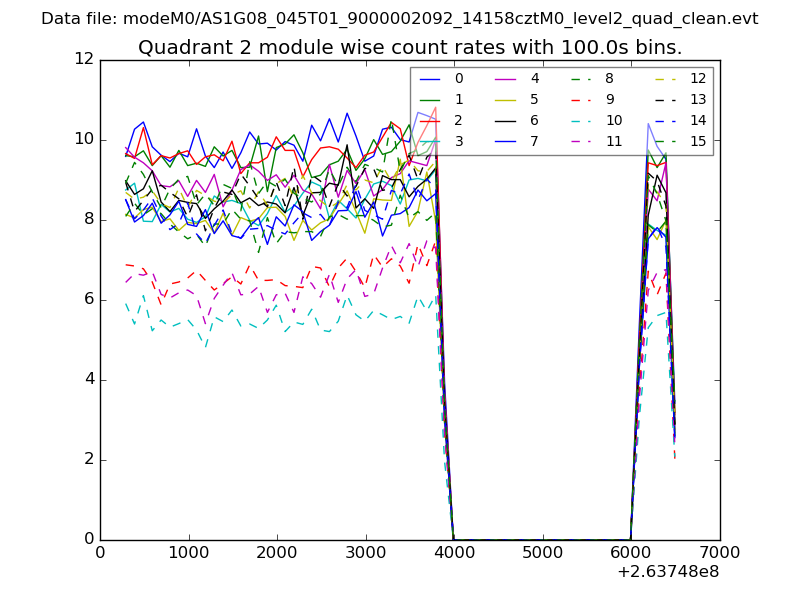
| Module-wise count rates for Quadrant B Data is divided into 100 sec bins |
 |
 |
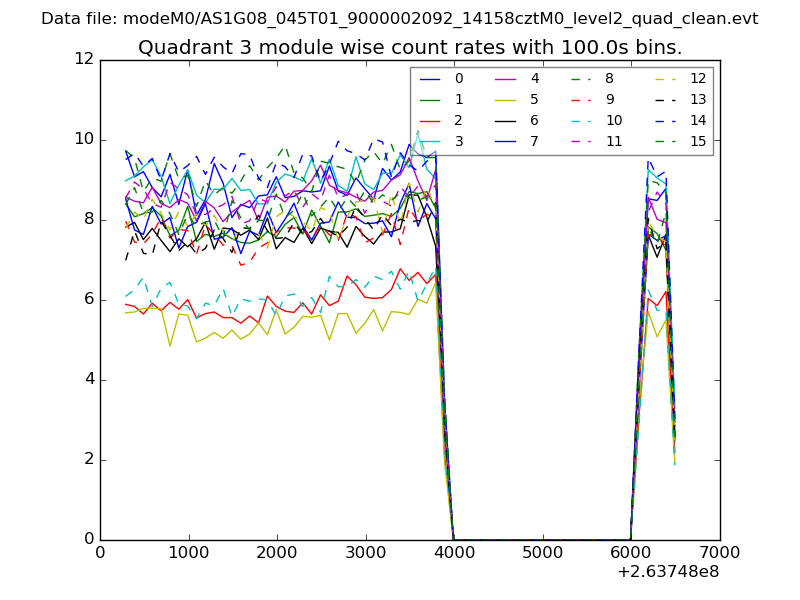
| Module-wise count rates for Quadrant C Data is divided into 100 sec bins |
 |
 |
| Module-wise count rates for Quadrant D Data is divided into 100 sec bins |
 |
 |
| Parameter | Plot |
|---|---|
| CZT HV Monitor | 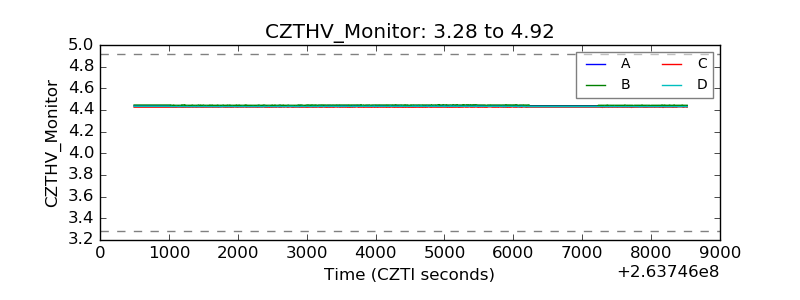 |
| D_VDD | 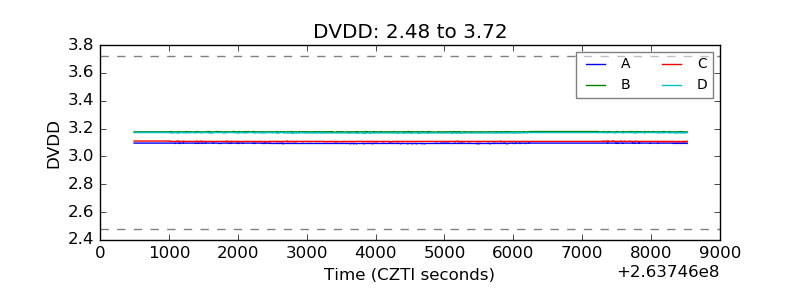 |
| Temperature 1 | 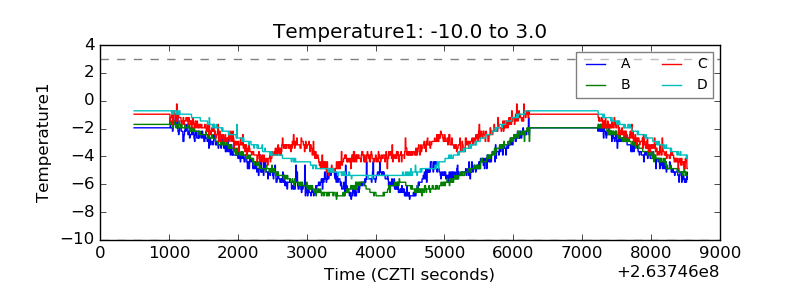 |
| Veto HV Monitor | 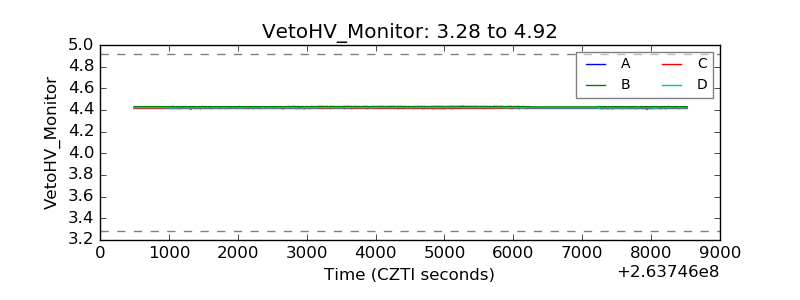 |
| Veto LLD | 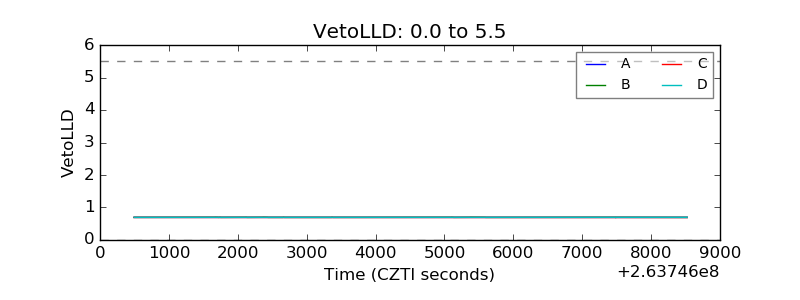 |
| Alpha Counter | 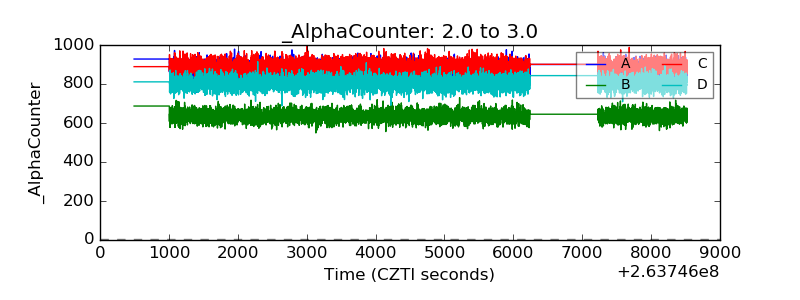 |
| _CPM_Rate | 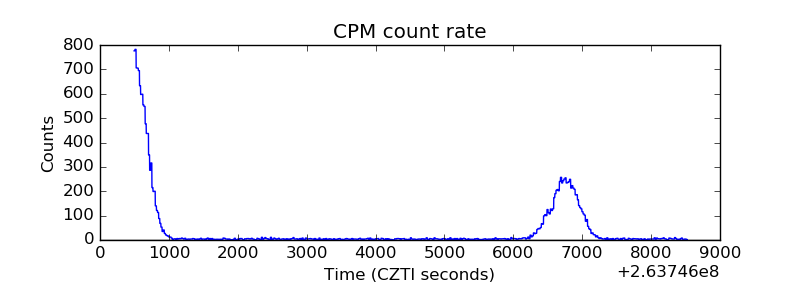 |
| CZT Counter | 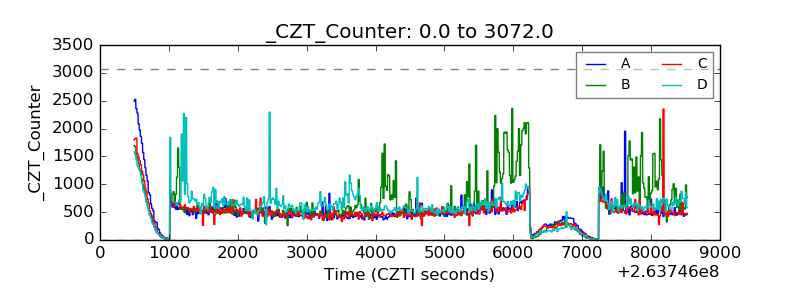 |
| +2.5 Volts monitor |  |
| +5 Volts monitor |  |
| _ROLL_ROT | 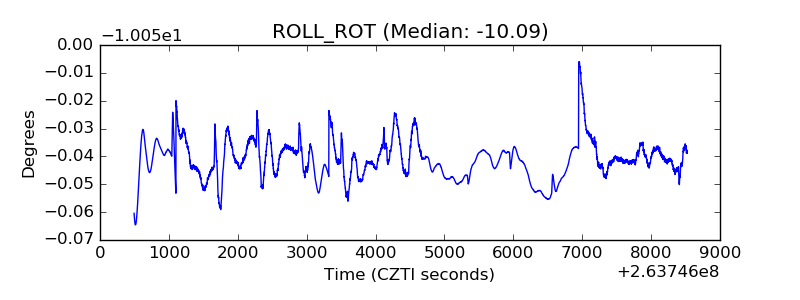 |
| _Roll_DEC | 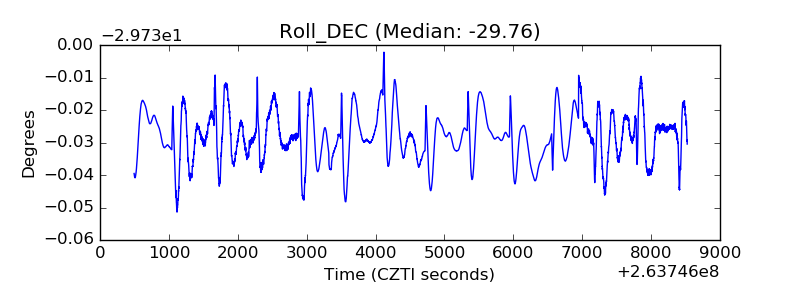 |
| _Roll_RA | 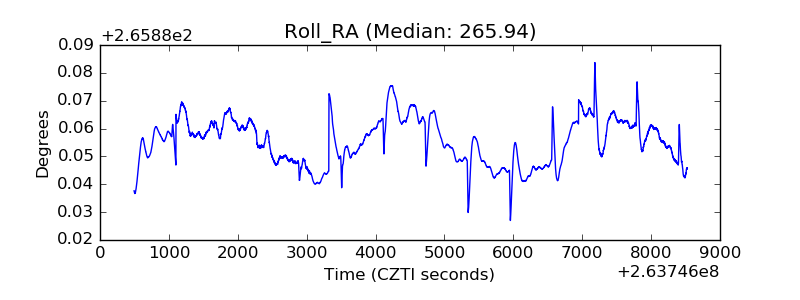 |
| Veto Counter | 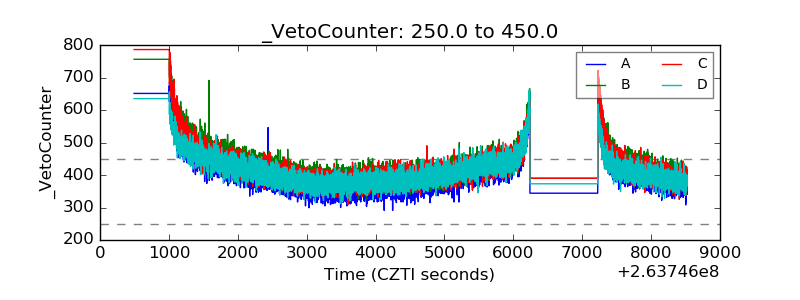 |