| Param | Original file | Final file |
|---|---|---|
| Filename | modeM0/AS1G08_045T01_9000002092_14160cztM0_level2.evt | modeM0/AS1G08_045T01_9000002092_14160cztM0_level2_quad_clean.evt |
| Size (bytes) | 730,391,040 | 101,692,800 |
| Size | 696.6 MB | 97.0 MB |
| Events in quadrant A | 3,939,902 | 645,703 |
| Events in quadrant B | 7,010,399 | 662,755 |
| Events in quadrant C | 4,153,475 | 624,243 |
| Events in quadrant D | 6,473,320 | 588,655 |
| Mode M9 | |||
|---|---|---|---|
| Quadrant | BADHDUFLAG | Total packets | Discarded packets |
| A | 0 | 9 | 0 |
| B | 0 | 9 | 0 |
| C | 0 | 9 | 0 |
| D | 0 | 9 | 0 |
| Mode SS | |||
|---|---|---|---|
| Quadrant | BADHDUFLAG | Total packets | Discarded packets |
| A | 0 | 164 | 0 |
| B | 0 | 164 | 0 |
| C | 0 | 164 | 0 |
| D | 0 | 164 | 0 |
| Mode M0 | |||
|---|---|---|---|
| Quadrant | BADHDUFLAG | Total packets | Discarded packets |
| A | 0 | 16957 | 3 |
| B | 0 | 26289 | 2 |
| C | 0 | 17330 | 2 |
| D | 0 | 24827 | 2 |
| Quadrant | Total seconds | Saturated seconds | Saturation percentage |
|---|---|---|---|
| A | 8034 | 55 | 0.684590% |
| B | 8034 | 1206 | 15.011202% |
| C | 8034 | 53 | 0.659696% |
| D | 8034 | 159 | 1.979089% |
Noise dominated data is calculated using 1-second bins in cleaned event files. If a bin has >2000 counts, and if more than 50% of those come from <1% of pixels, then it is considered to be noise-dominated and hence unusable.
| Quadrant | # 1 sec bins | Bins with >0 counts | Bins with >2000 counts | High rate bins dominated by noise | Noise dominated (total time) | Noise dominated (detector-on time) | Marked lightcurve |
|---|---|---|---|---|---|---|---|
| A | 8900 | 8037 | 0 | 0 | 0.00% | 0.00% | 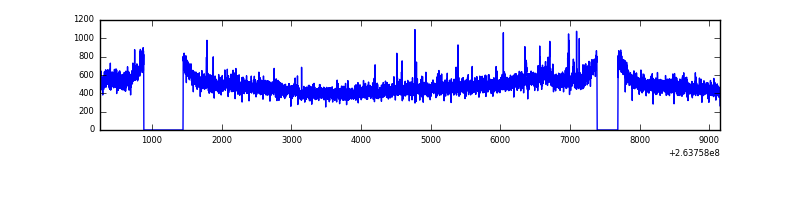 |
| B | 8900 | 8037 | 558 | 558 | 6.27% | 6.94% | 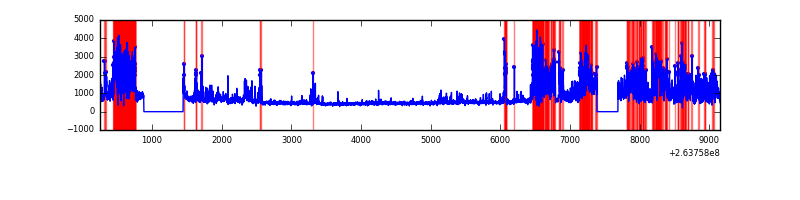 |
| C | 8900 | 8037 | 20 | 20 | 0.22% | 0.25% | 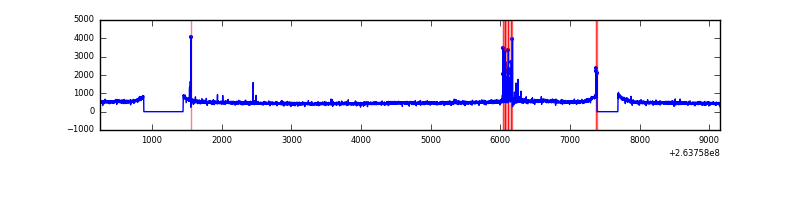 |
| D | 8900 | 8037 | 60 | 60 | 0.67% | 0.75% | 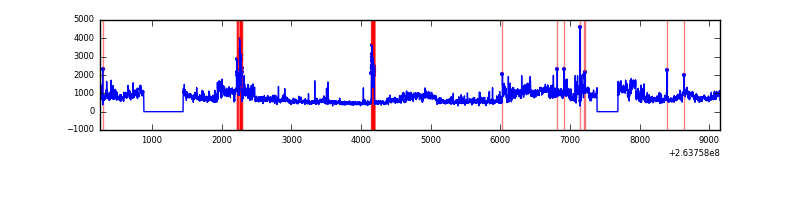 |
Top three noisy pixels from each quadrant. If the there are fewer than three noisy pixels in the level2.evt file, extra rows are filled as -1
| Pixel properties | Quadrant properties | ||||||
|---|---|---|---|---|---|---|---|
| Quadrant | DetID | PixID | Counts | Sigma | Mean | Median | Sigma |
| A | 12 | 189 | 53149 | 253.22 | 1002 | 981 | 206.0 |
| A | 8 | 15 | 15252 | 69.27 | 1002 | 981 | 206.0 |
| A | 9 | 143 | 11423 | 50.69 | 1002 | 981 | 206.0 |
| B | 0 | 85 | 2998714 | 16538.86 | 957 | 935 | 181.3 |
| B | 0 | 189 | 92687 | 506.2 | 957 | 935 | 181.3 |
| B | 4 | 142 | 49293 | 266.79 | 957 | 935 | 181.3 |
| C | 3 | 233 | 262709 | 1155.28 | 966 | 969 | 226.6 |
| C | 0 | 207 | 105785 | 462.64 | 966 | 969 | 226.6 |
| C | 14 | 234 | 15174 | 62.7 | 966 | 969 | 226.6 |
| D | 1 | 52 | 1627919 | 6864.04 | 953 | 929 | 237.0 |
| D | 8 | 195 | 725889 | 3058.5 | 953 | 929 | 237.0 |
| D | 2 | 152 | 150056 | 629.15 | 953 | 929 | 237.0 |
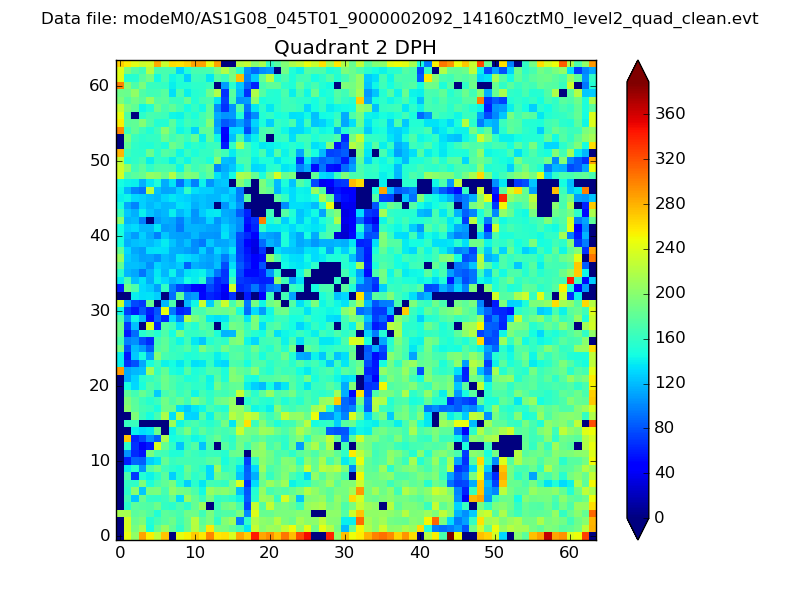
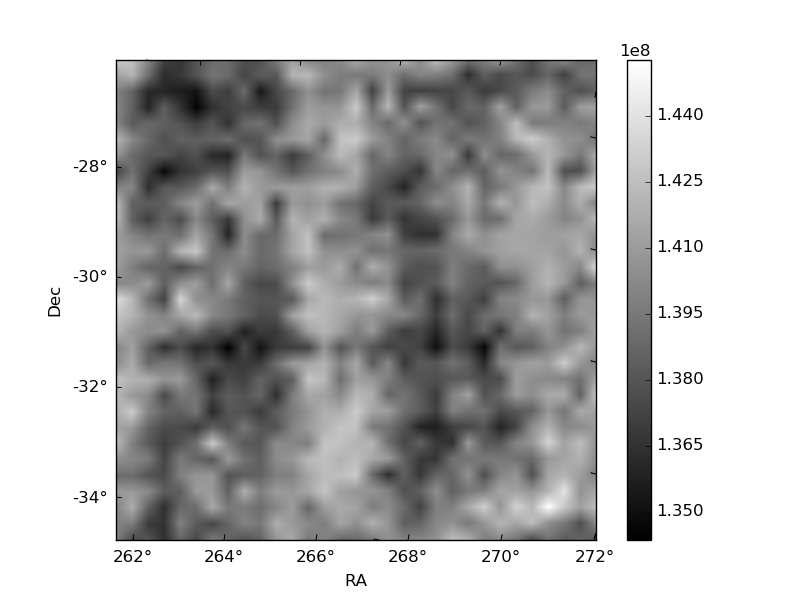
Histogram calculated using DETX and DETY for each event in the final _common_clean file
| Quadrant A | 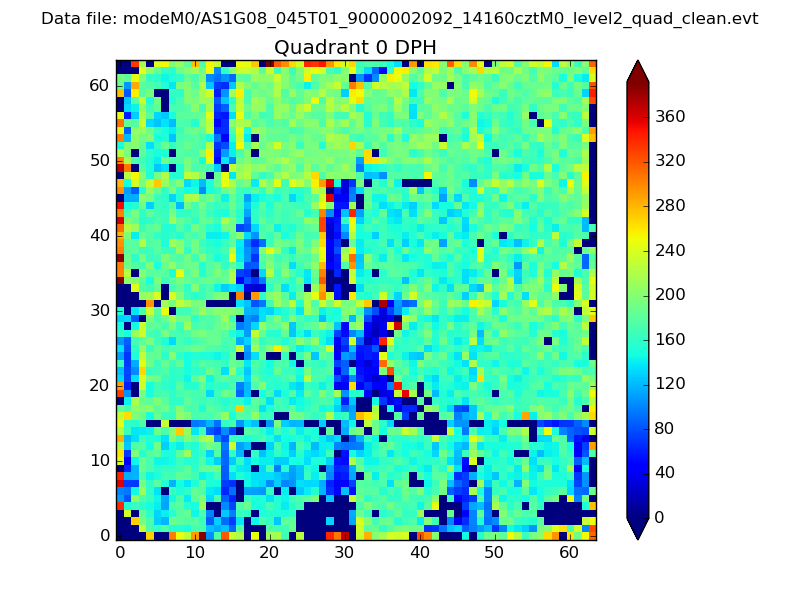 |
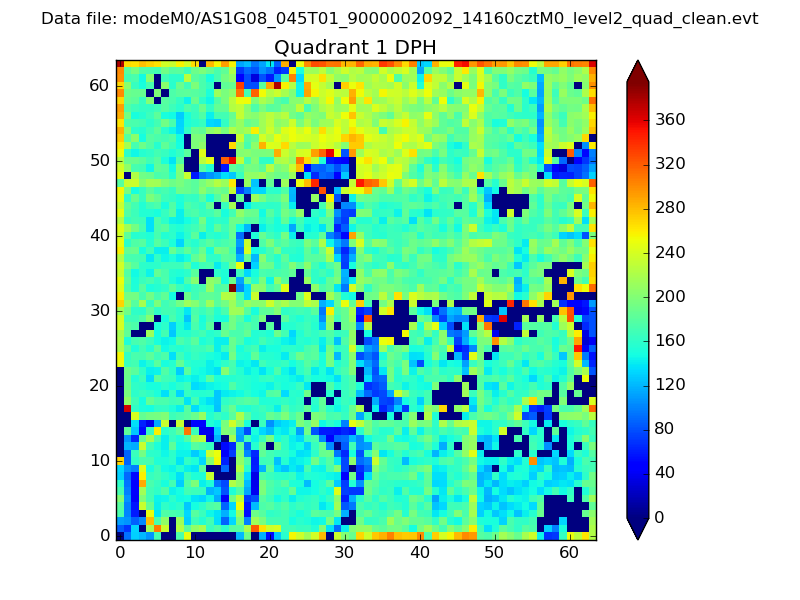 |
Quadrant B |
|---|---|---|---|
| Quadrant D | 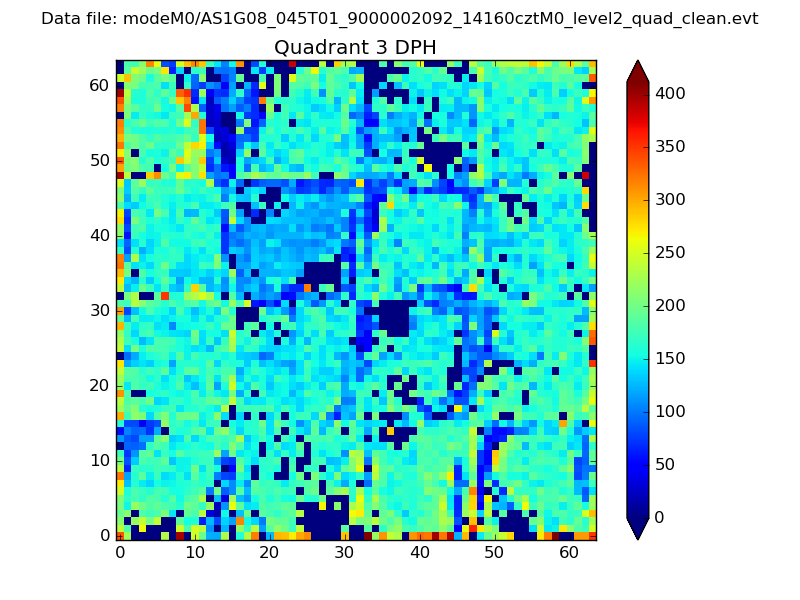 |
 |
Quadrant C |
| Plot type | Count rate plots | Images |
|---|---|---|
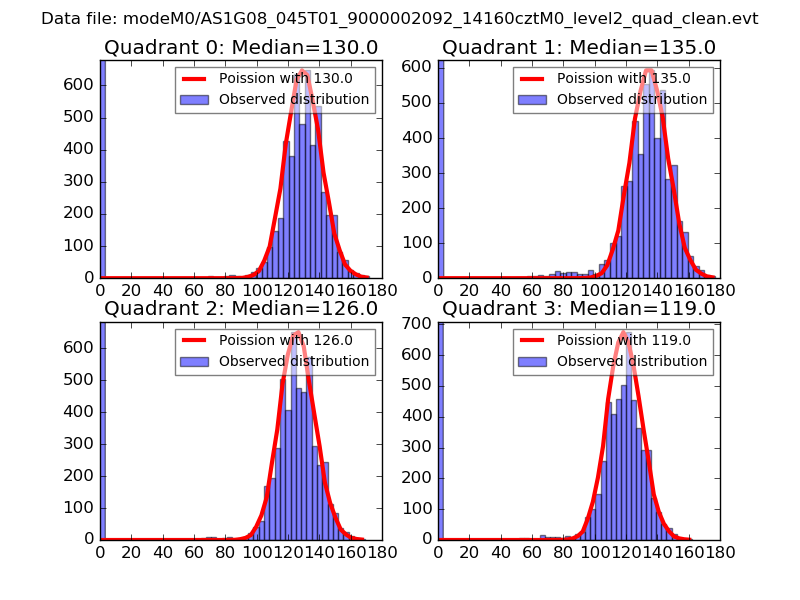
| Comparison with Poisson distribution Blue bars denote a histogram of data divided into 1 sec bins. Red curve is a Poisson curve with rate = median count rate of data. |
 |
 |
| Quadrant-wise count rates Data is divided into 100 sec bins |
 |
|
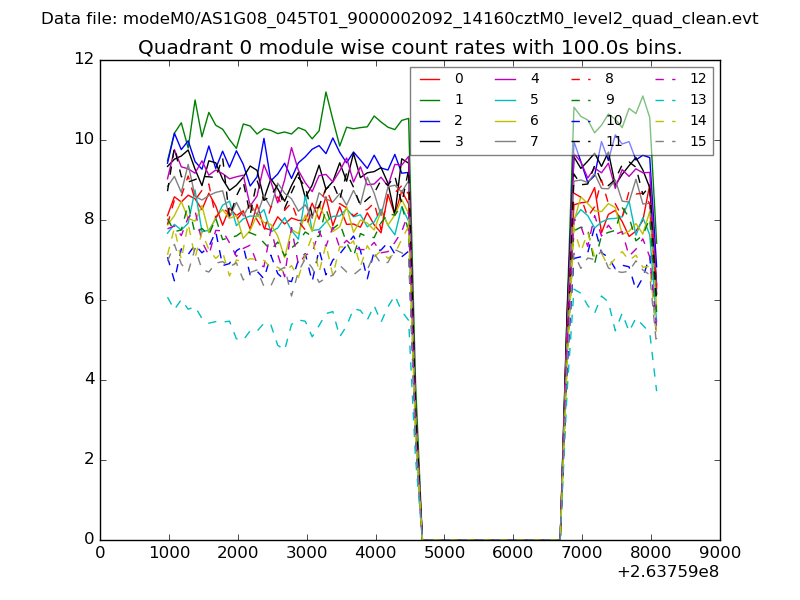
| Module-wise count rates for Quadrant A Data is divided into 100 sec bins |
 |
 |
| Module-wise count rates for Quadrant B Data is divided into 100 sec bins |
 |
 |
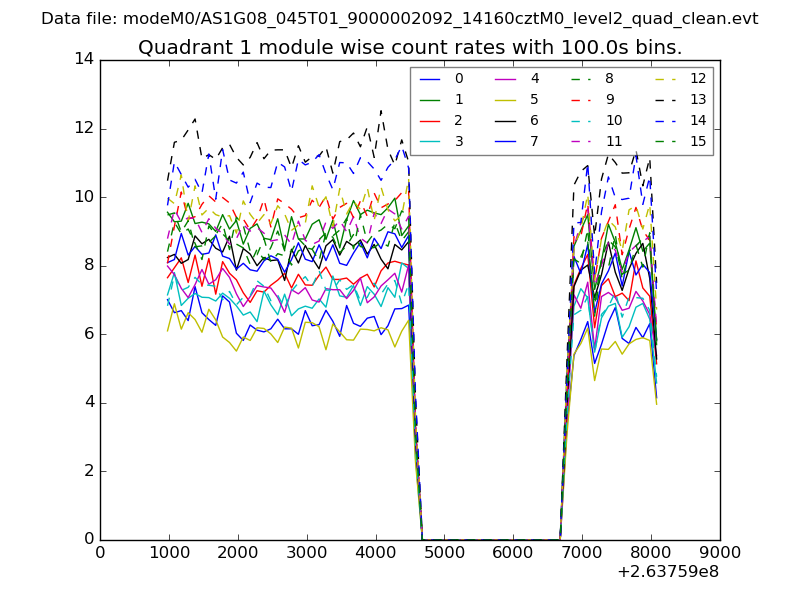
| Module-wise count rates for Quadrant C Data is divided into 100 sec bins |
 |
 |
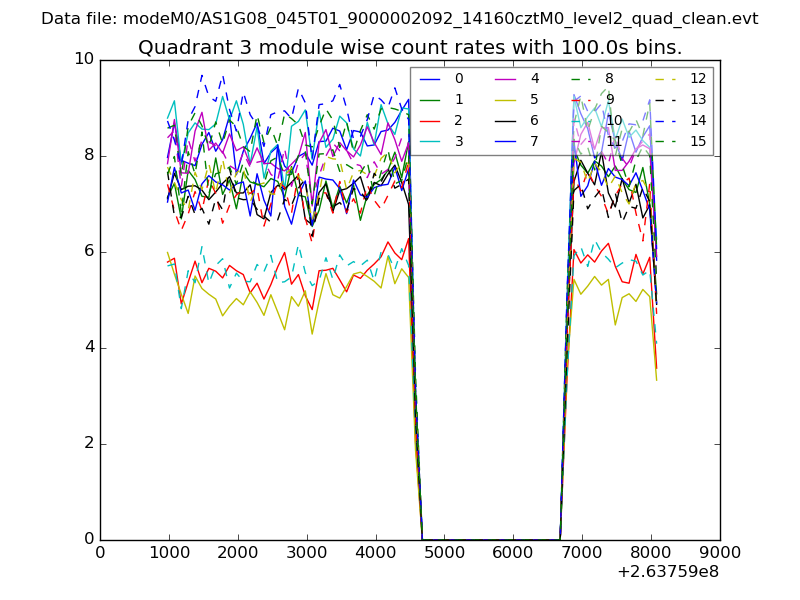
| Module-wise count rates for Quadrant D Data is divided into 100 sec bins |
 |
 |
| Parameter | Plot |
|---|---|
| CZT HV Monitor | 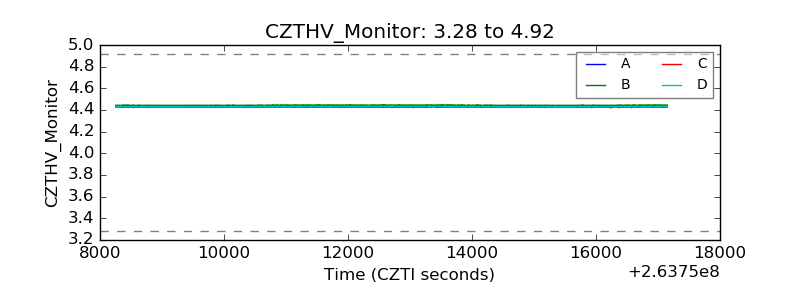 |
| D_VDD | 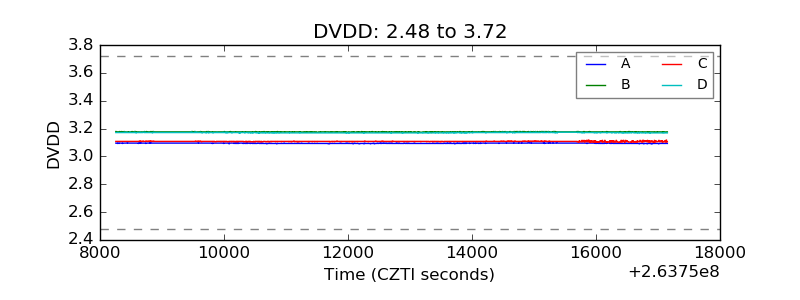 |
| Temperature 1 | 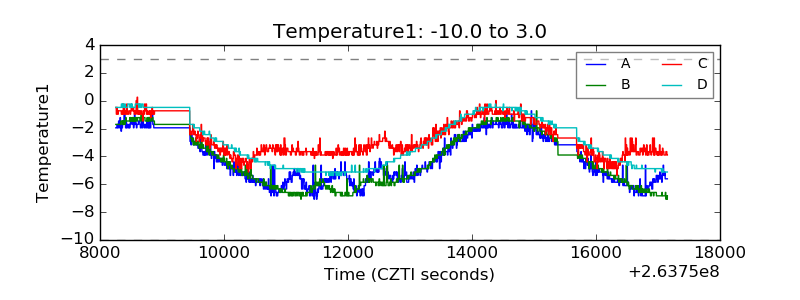 |
| Veto HV Monitor | 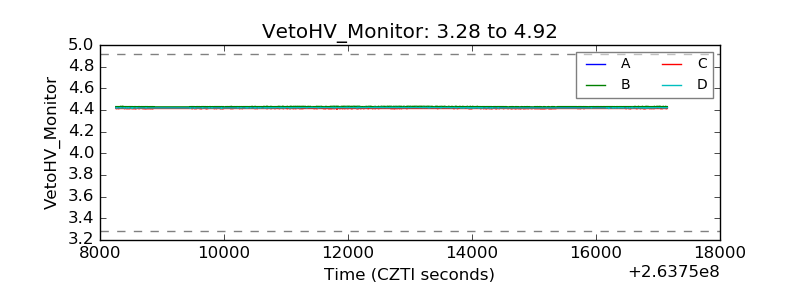 |
| Veto LLD | 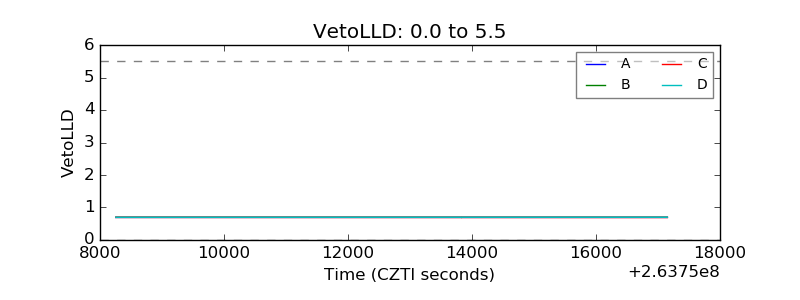 |
| Alpha Counter | 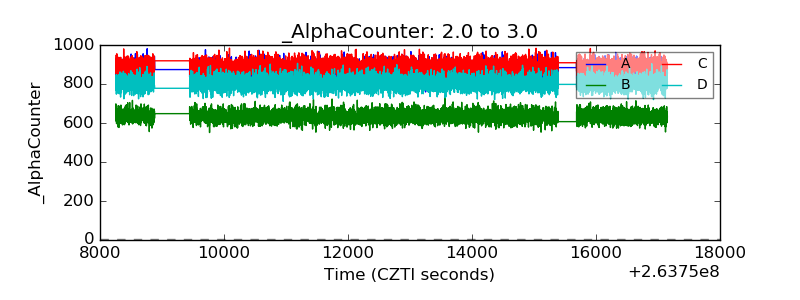 |
| _CPM_Rate | 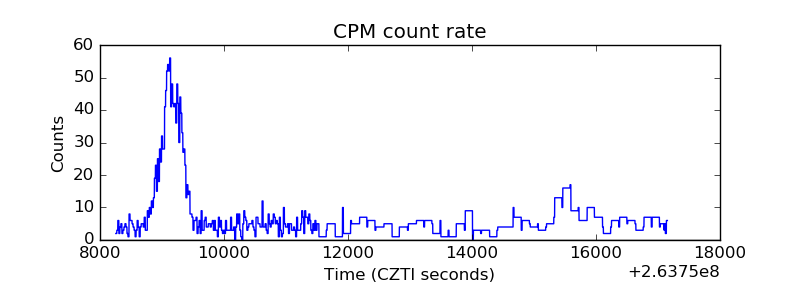 |
| CZT Counter | 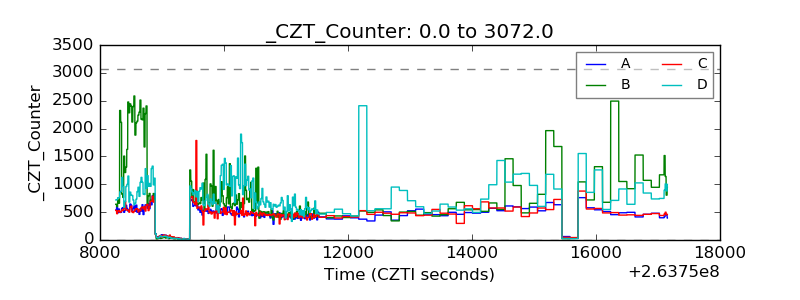 |
| +2.5 Volts monitor |  |
| +5 Volts monitor |  |
| _ROLL_ROT |  |
| _Roll_DEC |  |
| _Roll_RA | 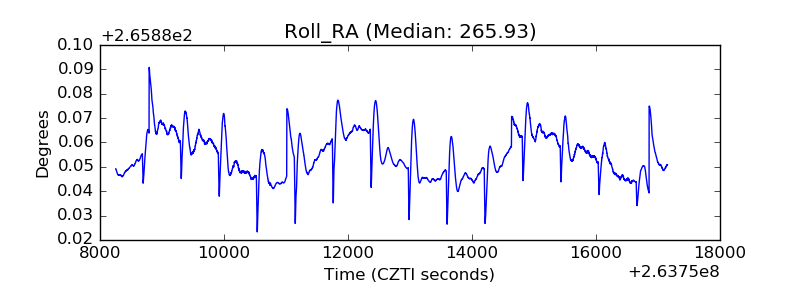 |
| Veto Counter | 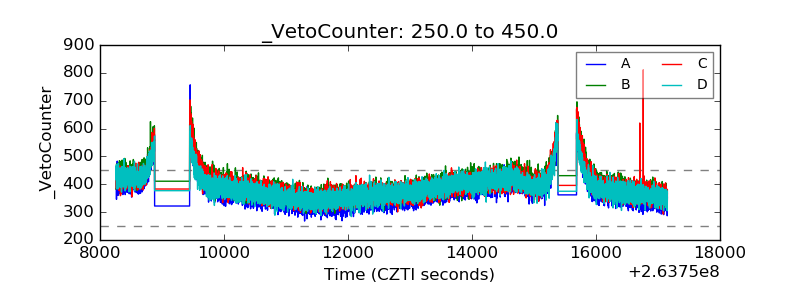 |