| Param | Original file | Final file |
|---|---|---|
| Filename | modeM0/AS1G08_045T01_9000002092_14161cztM0_level2.evt | modeM0/AS1G08_045T01_9000002092_14161cztM0_level2_quad_clean.evt |
| Size (bytes) | 771,073,920 | 104,345,280 |
| Size | 735.4 MB | 99.5 MB |
| Events in quadrant A | 3,917,162 | 670,312 |
| Events in quadrant B | 9,096,611 | 670,510 |
| Events in quadrant C | 3,959,528 | 647,007 |
| Events in quadrant D | 5,836,699 | 614,577 |
| Mode M9 | |||
|---|---|---|---|
| Quadrant | BADHDUFLAG | Total packets | Discarded packets |
| A | 0 | 6 | 0 |
| B | 0 | 6 | 0 |
| C | 0 | 6 | 0 |
| D | 0 | 6 | 0 |
| Mode SS | |||
|---|---|---|---|
| Quadrant | BADHDUFLAG | Total packets | Discarded packets |
| A | 0 | 164 | 0 |
| B | 0 | 164 | 0 |
| C | 0 | 164 | 0 |
| D | 0 | 164 | 0 |
| Mode M0 | |||
|---|---|---|---|
| Quadrant | BADHDUFLAG | Total packets | Discarded packets |
| A | 0 | 16912 | 3 |
| B | 0 | 32589 | 2 |
| C | 0 | 16794 | 2 |
| D | 0 | 22901 | 2 |
| Quadrant | Total seconds | Saturated seconds | Saturation percentage |
|---|---|---|---|
| A | 8022 | 53 | 0.660683% |
| B | 8022 | 1853 | 23.098978% |
| C | 8022 | 45 | 0.560957% |
| D | 8022 | 161 | 2.006981% |
Noise dominated data is calculated using 1-second bins in cleaned event files. If a bin has >2000 counts, and if more than 50% of those come from <1% of pixels, then it is considered to be noise-dominated and hence unusable.
| Quadrant | # 1 sec bins | Bins with >0 counts | Bins with >2000 counts | High rate bins dominated by noise | Noise dominated (total time) | Noise dominated (detector-on time) | Marked lightcurve |
|---|---|---|---|---|---|---|---|
| A | 8603 | 8025 | 4 | 4 | 0.05% | 0.05% | 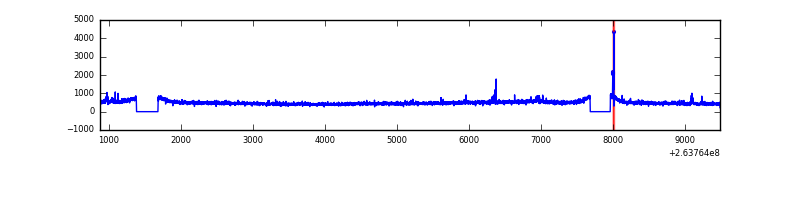 |
| B | 8603 | 8025 | 1004 | 1004 | 11.67% | 12.51% | 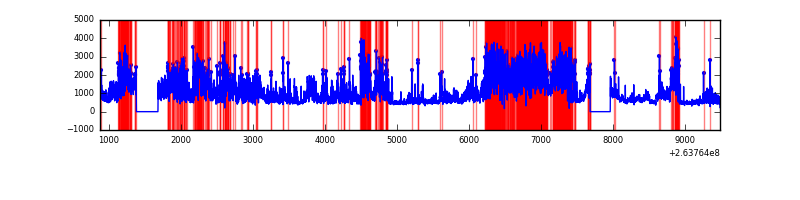 |
| C | 8603 | 8025 | 3 | 3 | 0.03% | 0.04% | 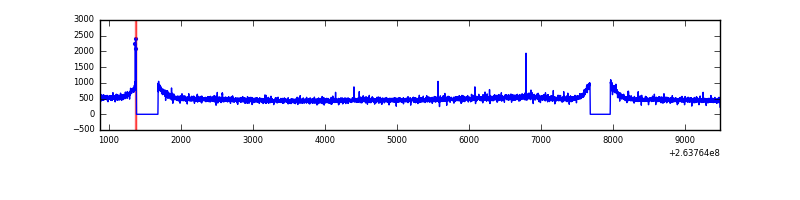 |
| D | 8603 | 8025 | 40 | 40 | 0.46% | 0.50% | 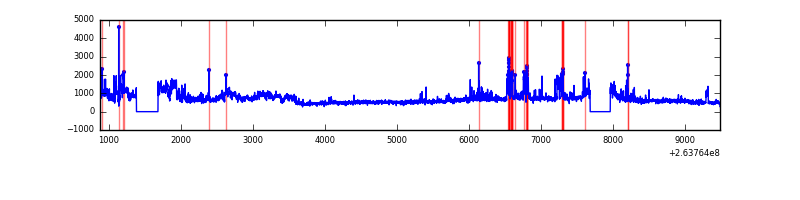 |
Top three noisy pixels from each quadrant. If the there are fewer than three noisy pixels in the level2.evt file, extra rows are filled as -1
| Pixel properties | Quadrant properties | ||||||
|---|---|---|---|---|---|---|---|
| Quadrant | DetID | PixID | Counts | Sigma | Mean | Median | Sigma |
| A | 12 | 189 | 75169 | 362.98 | 991 | 970 | 204.4 |
| A | 15 | 69 | 24571 | 115.46 | 991 | 970 | 204.4 |
| A | 0 | 226 | 8875 | 38.67 | 991 | 970 | 204.4 |
| B | 0 | 85 | 5241012 | 29912.12 | 910 | 888 | 175.2 |
| B | 4 | 142 | 90915 | 513.9 | 910 | 888 | 175.2 |
| B | 0 | 189 | 86575 | 489.13 | 910 | 888 | 175.2 |
| C | 3 | 233 | 176571 | 781.22 | 960 | 965 | 224.8 |
| C | 0 | 207 | 14154 | 58.67 | 960 | 965 | 224.8 |
| C | 8 | 128 | 12065 | 49.38 | 960 | 965 | 224.8 |
| D | 8 | 195 | 964357 | 3886.18 | 945 | 924 | 247.9 |
| D | 1 | 52 | 708626 | 2854.64 | 945 | 924 | 247.9 |
| D | 12 | 110 | 274417 | 1103.18 | 945 | 924 | 247.9 |
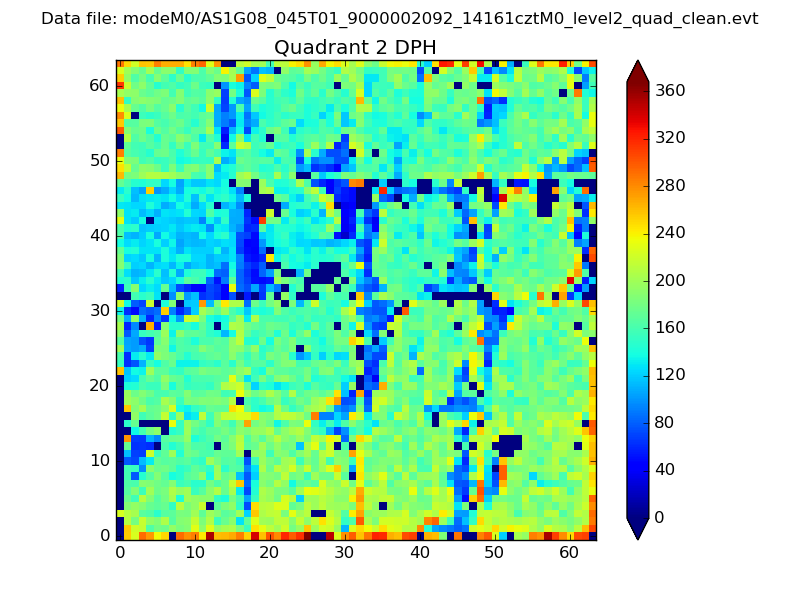
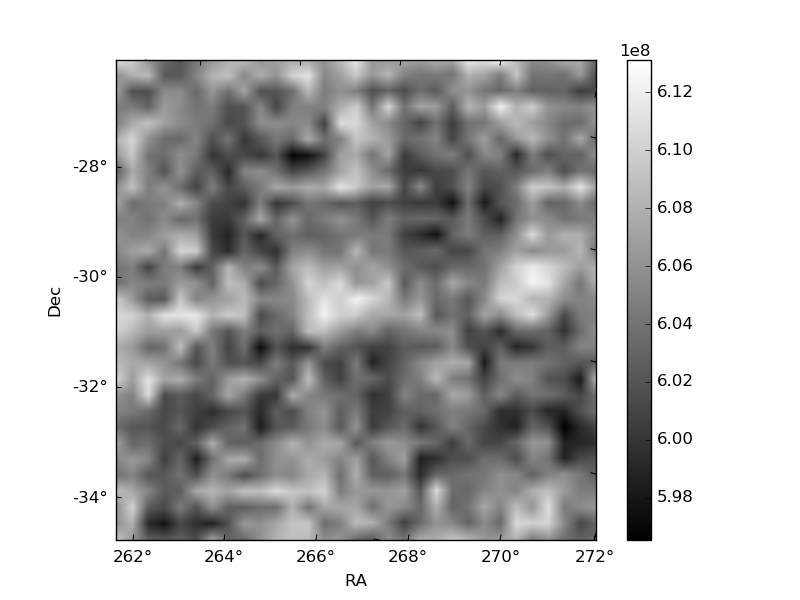
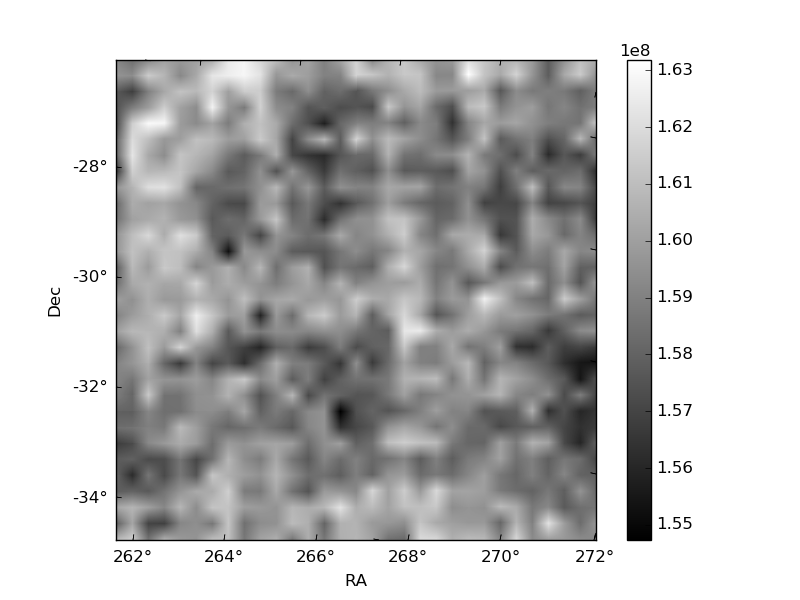
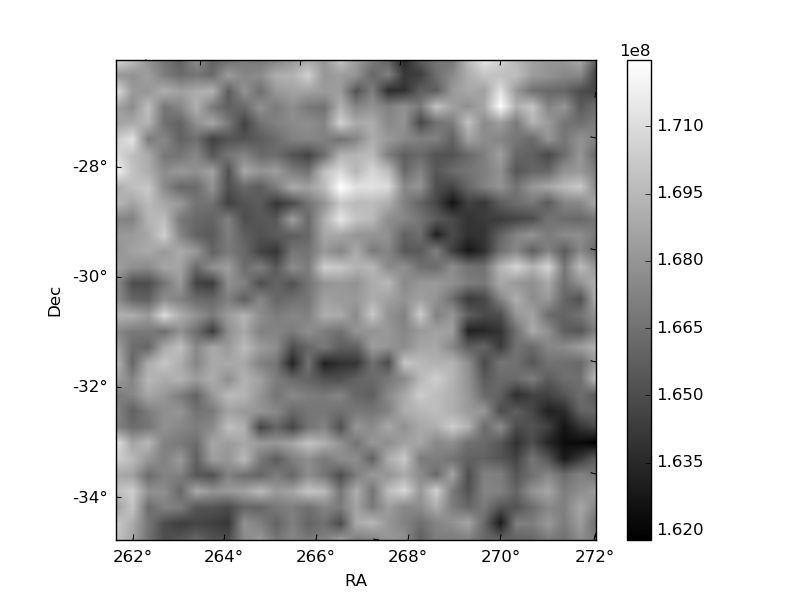
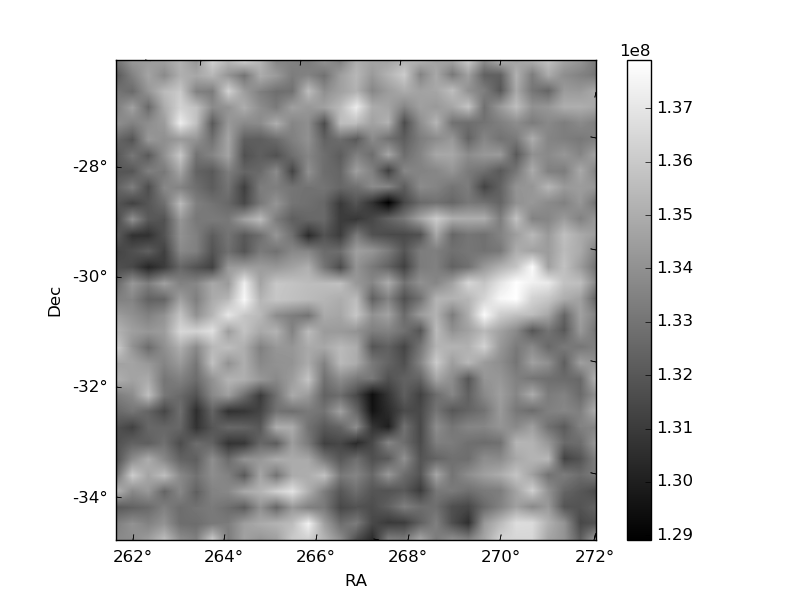
Histogram calculated using DETX and DETY for each event in the final _common_clean file
| Quadrant A | 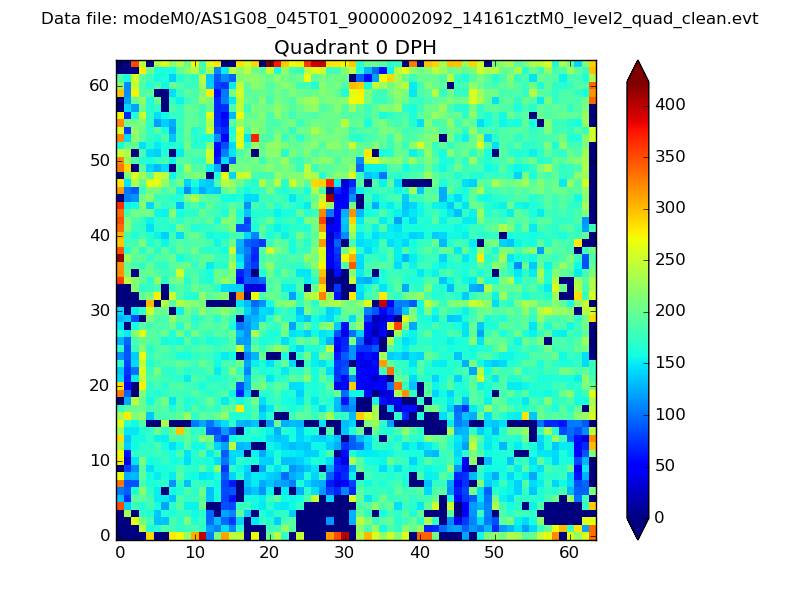 |
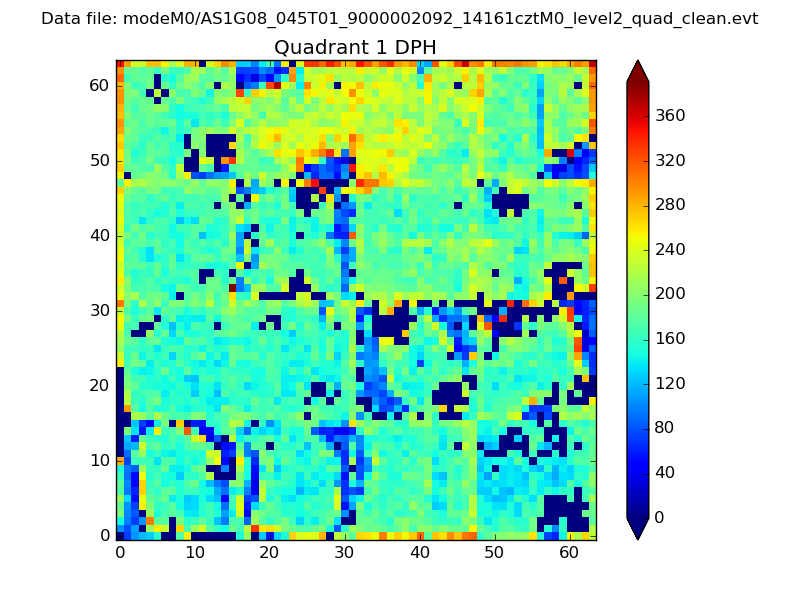 |
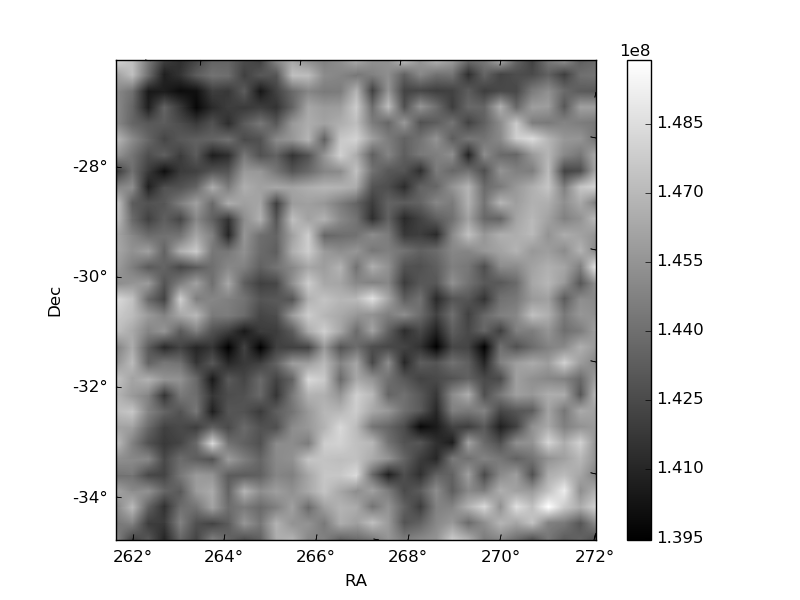
Quadrant B |
|---|---|---|---|
| Quadrant D | 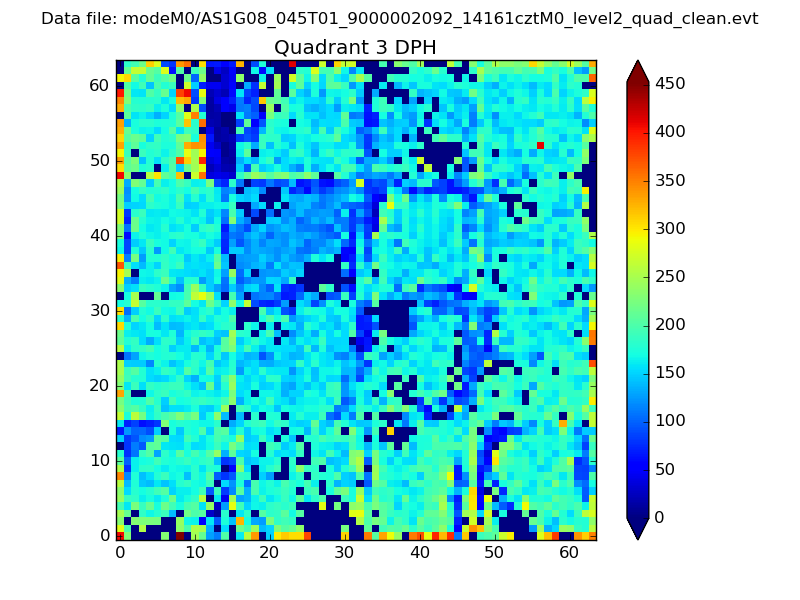 |
 |
Quadrant C |
| Plot type | Count rate plots | Images |
|---|---|---|
| Comparison with Poisson distribution Blue bars denote a histogram of data divided into 1 sec bins. Red curve is a Poisson curve with rate = median count rate of data. |
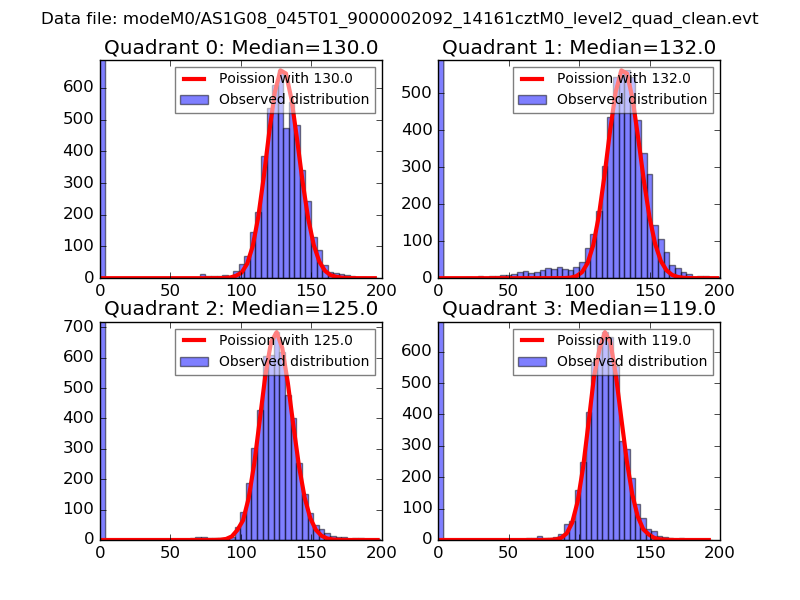 |
 |
| Quadrant-wise count rates Data is divided into 100 sec bins |
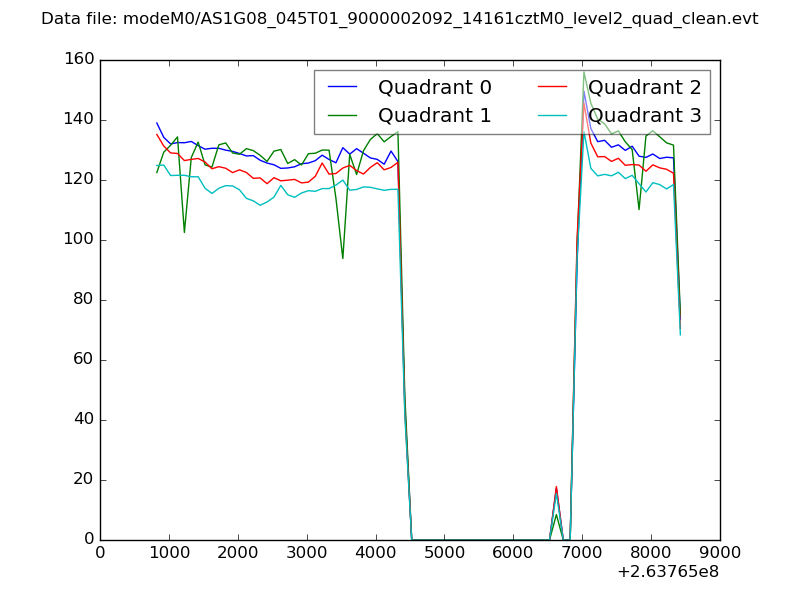 |
|
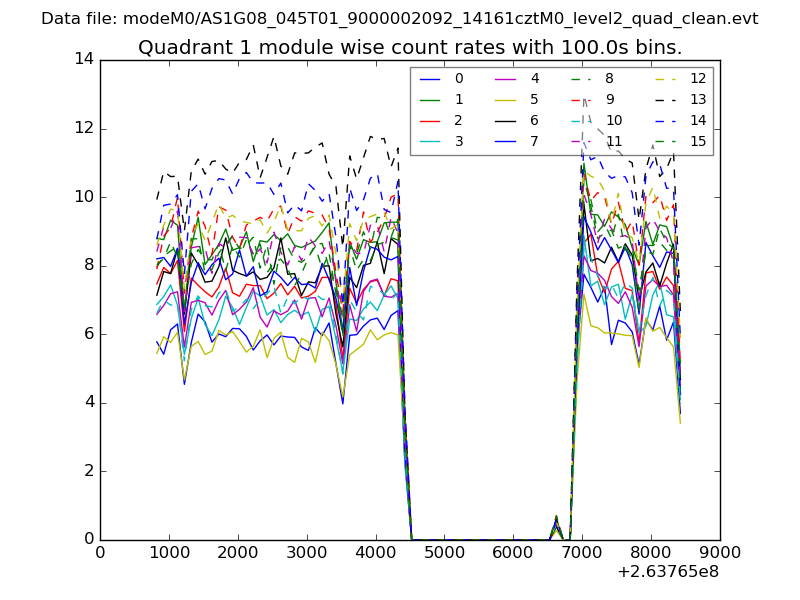
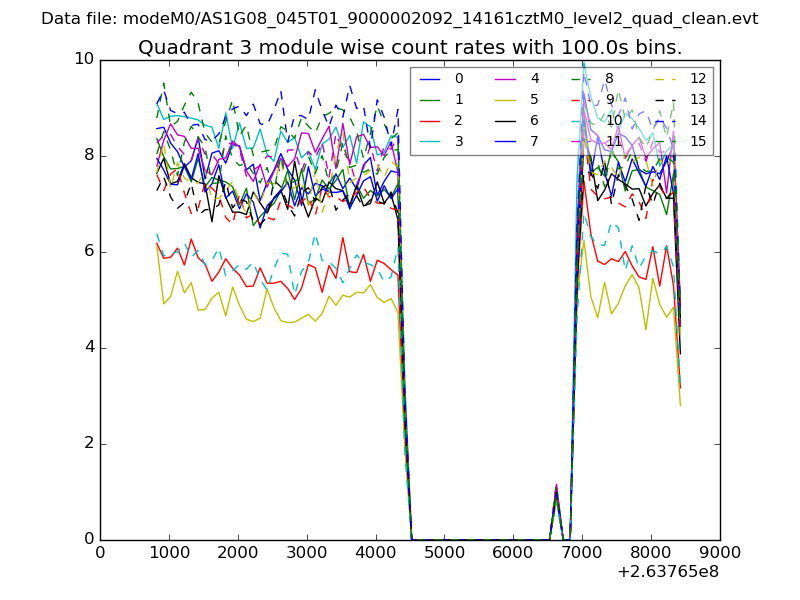
| Module-wise count rates for Quadrant A Data is divided into 100 sec bins |
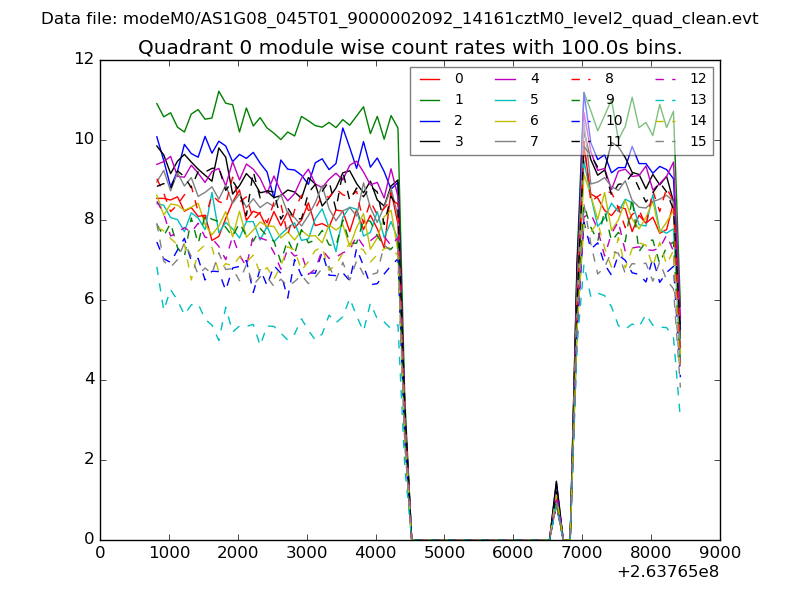 |
 |
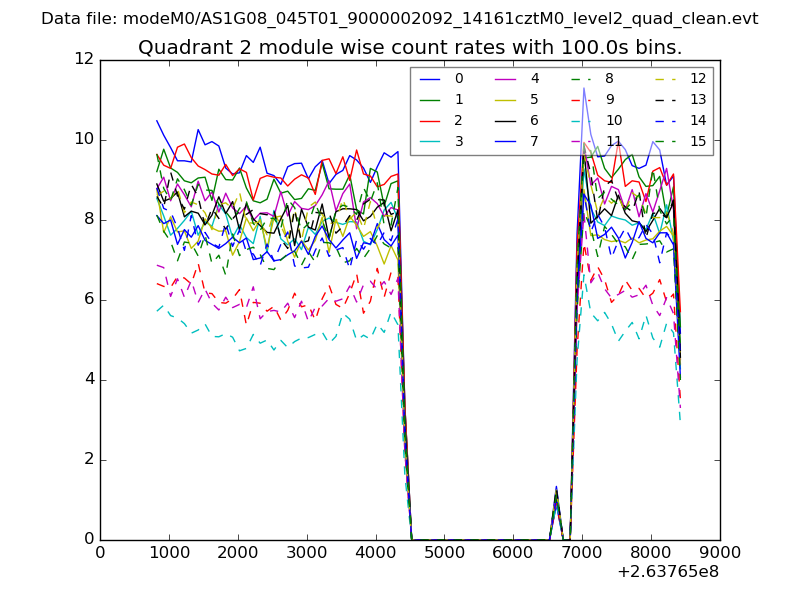
| Module-wise count rates for Quadrant B Data is divided into 100 sec bins |
 |
 |
| Module-wise count rates for Quadrant C Data is divided into 100 sec bins |
 |
 |
| Module-wise count rates for Quadrant D Data is divided into 100 sec bins |
 |
 |
| Parameter | Plot |
|---|---|
| CZT HV Monitor | 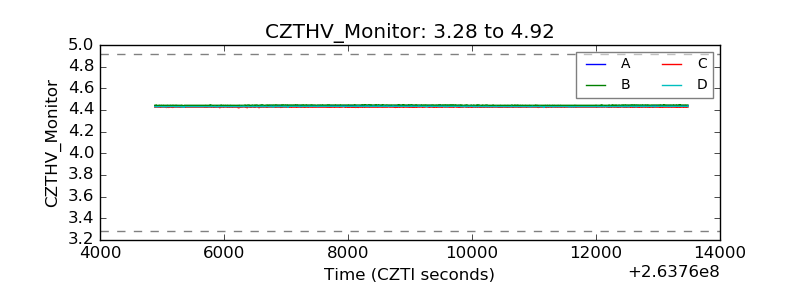 |
| D_VDD | 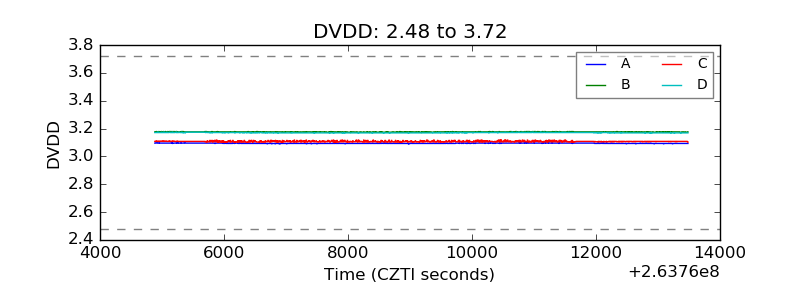 |
| Temperature 1 | 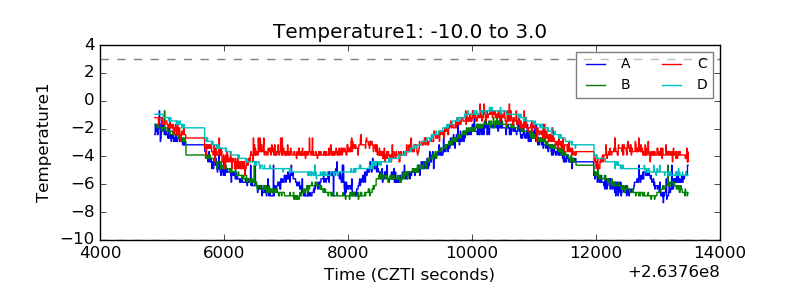 |
| Veto HV Monitor | 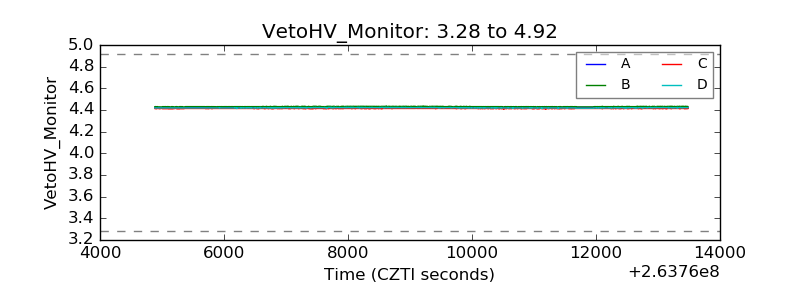 |
| Veto LLD | 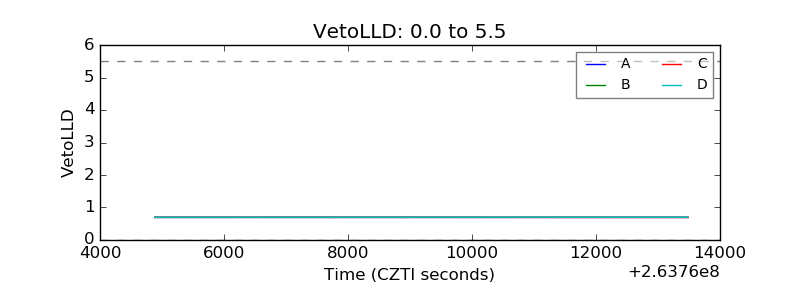 |
| Alpha Counter | 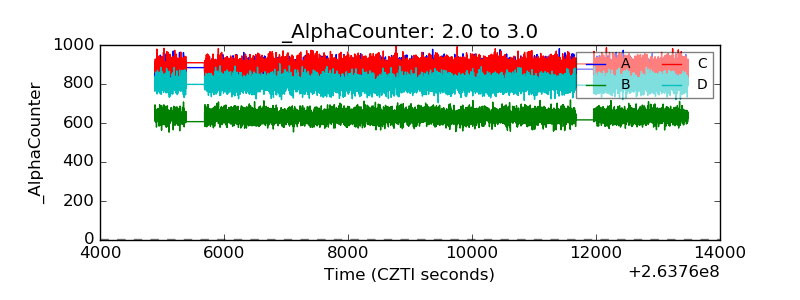 |
| _CPM_Rate | 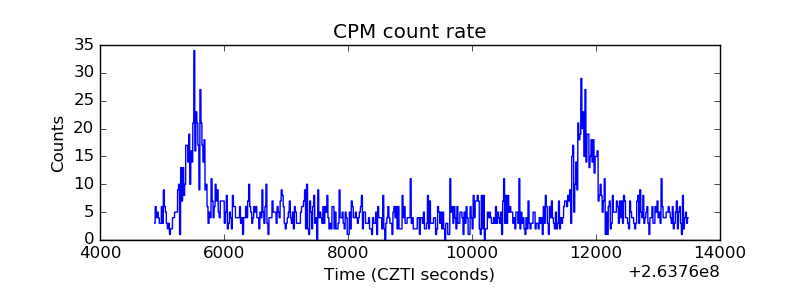 |
| CZT Counter | 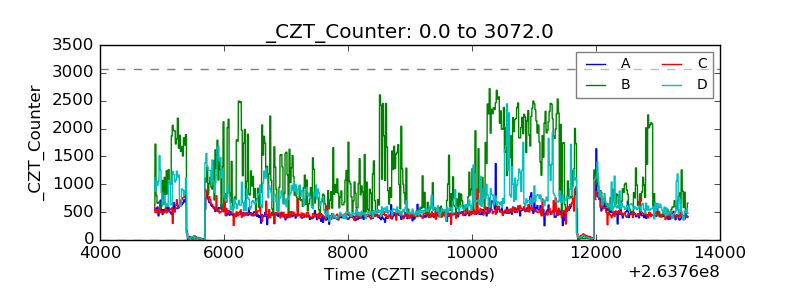 |
| +2.5 Volts monitor |  |
| +5 Volts monitor |  |
| _ROLL_ROT | 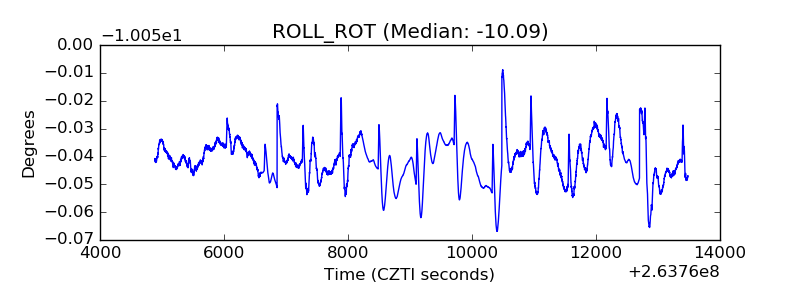 |
| _Roll_DEC | 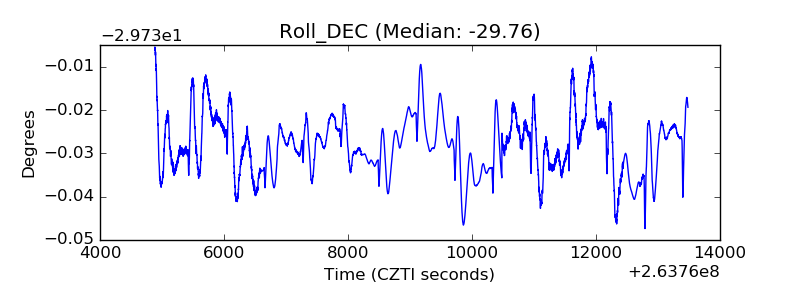 |
| _Roll_RA | 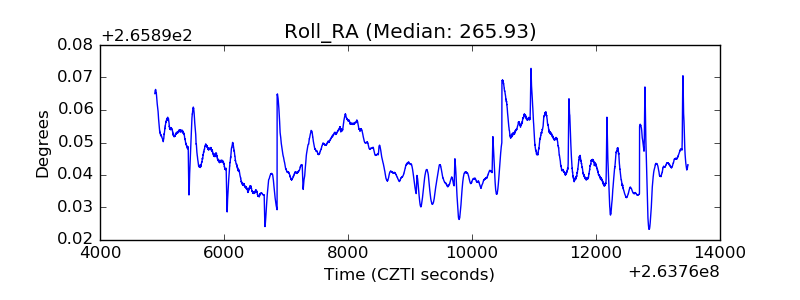 |
| Veto Counter | 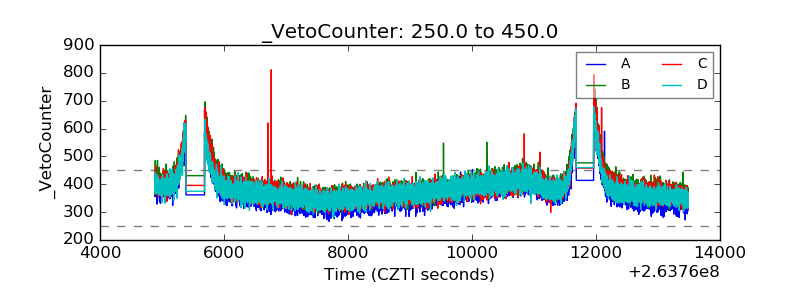 |