| Param | Original file | Final file |
|---|---|---|
| Filename | modeM0/AS1G08_045T01_9000002092_14164cztM0_level2.evt | modeM0/AS1G08_045T01_9000002092_14164cztM0_level2_quad_clean.evt |
| Size (bytes) | 1,517,958,720 | 199,264,320 |
| Size | 1.4 GB | 190.0 MB |
| Events in quadrant A | 8,276,153 | 1,260,172 |
| Events in quadrant B | 17,450,272 | 1,205,571 |
| Events in quadrant C | 8,288,102 | 1,226,691 |
| Events in quadrant D | 10,804,172 | 1,163,525 |
| Mode M9 | |||
|---|---|---|---|
| Quadrant | BADHDUFLAG | Total packets | Discarded packets |
| A | 0 | 14 | 0 |
| B | 0 | 14 | 0 |
| C | 0 | 14 | 0 |
| D | 0 | 14 | 0 |
| Mode SS | |||
|---|---|---|---|
| Quadrant | BADHDUFLAG | Total packets | Discarded packets |
| A | 0 | 346 | 0 |
| B | 0 | 346 | 0 |
| C | 0 | 346 | 0 |
| D | 0 | 346 | 0 |
| Mode M0 | |||
|---|---|---|---|
| Quadrant | BADHDUFLAG | Total packets | Discarded packets |
| A | 0 | 35804 | 3 |
| B | 0 | 63073 | 3 |
| C | 0 | 35394 | 3 |
| D | 0 | 43461 | 3 |
| Quadrant | Total seconds | Saturated seconds | Saturation percentage |
|---|---|---|---|
| A | 17094 | 118 | 0.690301% |
| B | 17094 | 3777 | 22.095472% |
| C | 17094 | 100 | 0.585001% |
| D | 17094 | 327 | 1.912952% |
Noise dominated data is calculated using 1-second bins in cleaned event files. If a bin has >2000 counts, and if more than 50% of those come from <1% of pixels, then it is considered to be noise-dominated and hence unusable.
| Quadrant | # 1 sec bins | Bins with >0 counts | Bins with >2000 counts | High rate bins dominated by noise | Noise dominated (total time) | Noise dominated (detector-on time) | Marked lightcurve |
|---|---|---|---|---|---|---|---|
| A | 18430 | 17098 | 14 | 14 | 0.08% | 0.08% | 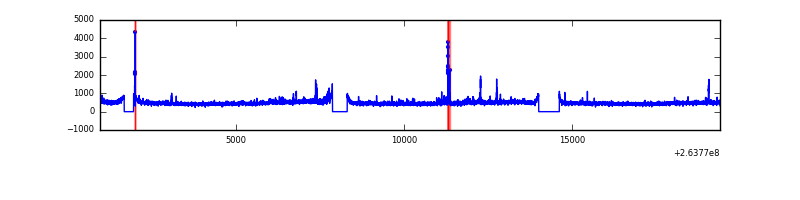 |
| B | 18430 | 17098 | 2506 | 2506 | 13.60% | 14.66% | 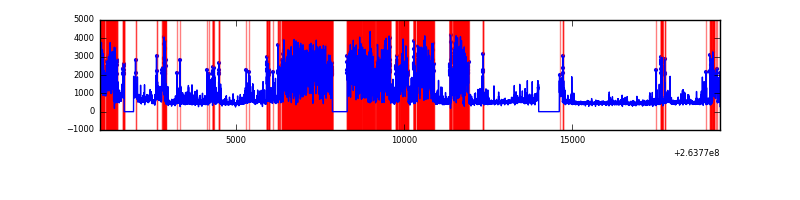 |
| C | 18430 | 17098 | 11 | 11 | 0.06% | 0.06% | 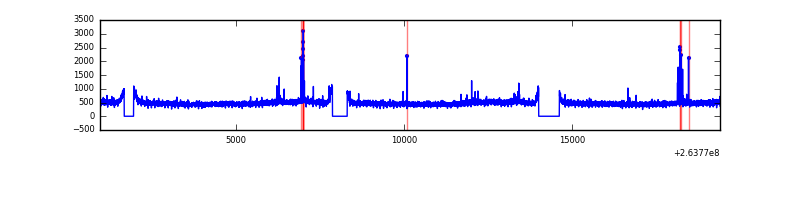 |
| D | 18430 | 17098 | 193 | 193 | 1.05% | 1.13% | 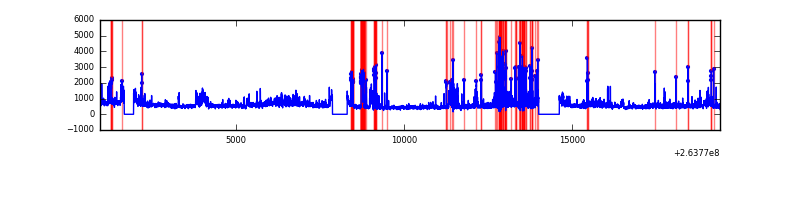 |
Top three noisy pixels from each quadrant. If the there are fewer than three noisy pixels in the level2.evt file, extra rows are filled as -1
| Pixel properties | Quadrant properties | ||||||
|---|---|---|---|---|---|---|---|
| Quadrant | DetID | PixID | Counts | Sigma | Mean | Median | Sigma |
| A | 12 | 189 | 271721 | 642.02 | 2064 | 2018 | 420.1 |
| A | 15 | 69 | 26288 | 57.77 | 2064 | 2018 | 420.1 |
| A | 4 | 2 | 22979 | 49.9 | 2064 | 2018 | 420.1 |
| B | 0 | 85 | 9538956 | 26677.4 | 1887 | 1844 | 357.5 |
| B | 3 | 209 | 139356 | 384.65 | 1887 | 1844 | 357.5 |
| B | 4 | 48 | 138323 | 381.76 | 1887 | 1844 | 357.5 |
| C | 3 | 233 | 368368 | 787.16 | 2000 | 2011 | 465.4 |
| C | 0 | 207 | 98663 | 207.67 | 2000 | 2011 | 465.4 |
| C | 5 | 96 | 20619 | 39.98 | 2000 | 2011 | 465.4 |
| D | 8 | 195 | 1415602 | 3012.14 | 1980 | 1937 | 469.3 |
| D | 12 | 110 | 962086 | 2045.82 | 1980 | 1937 | 469.3 |
| D | 10 | 157 | 372270 | 789.08 | 1980 | 1937 | 469.3 |
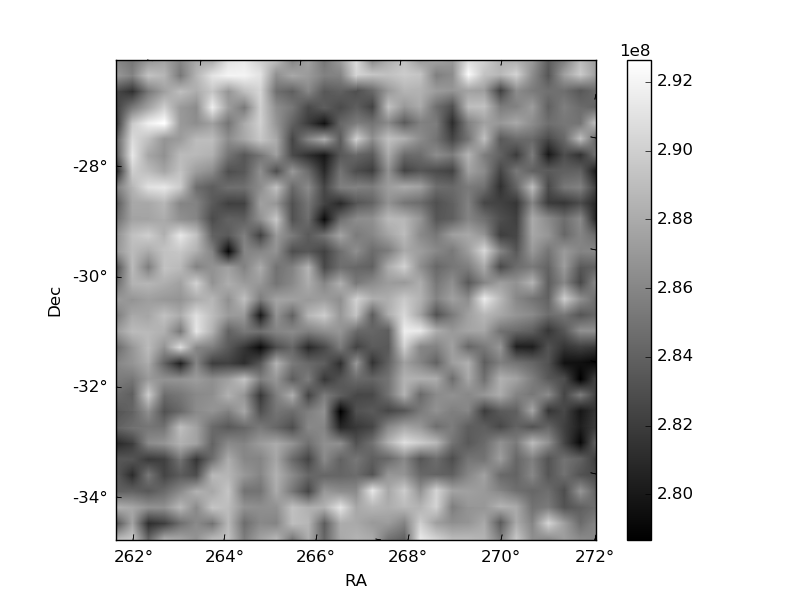
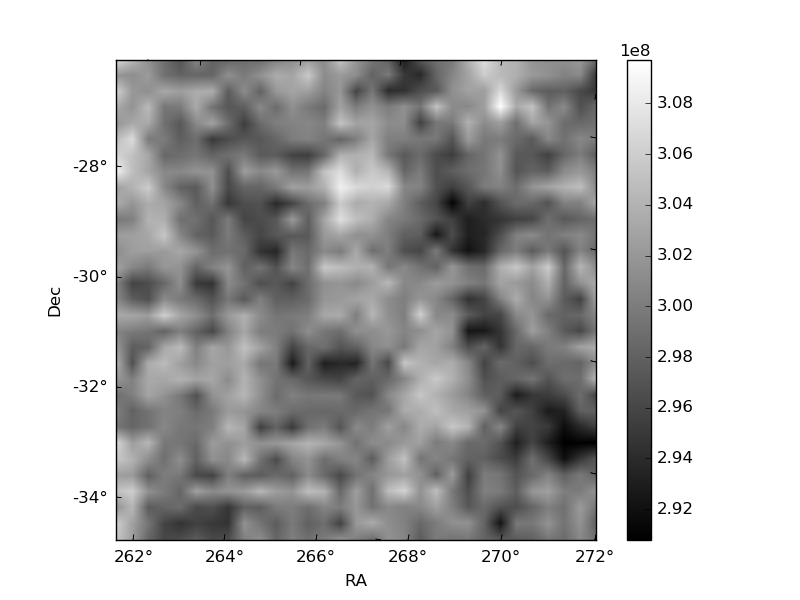
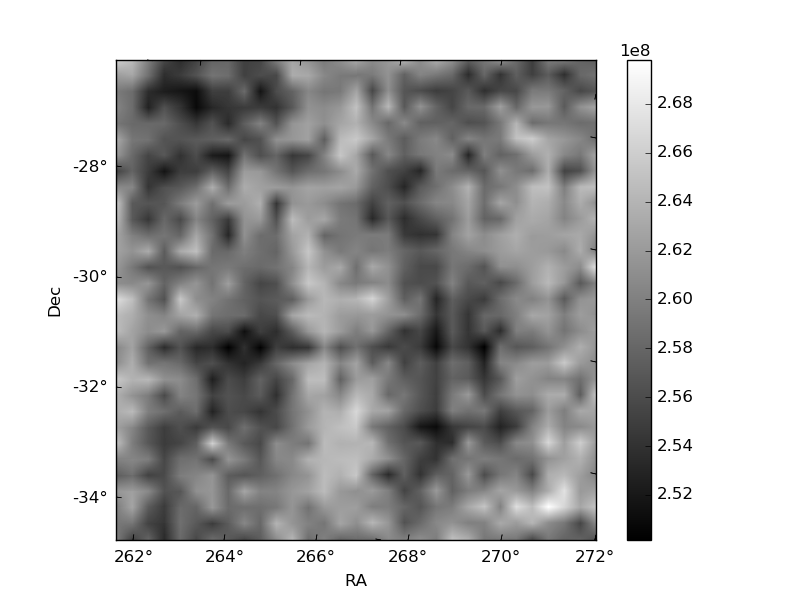
Histogram calculated using DETX and DETY for each event in the final _common_clean file
| Quadrant A | 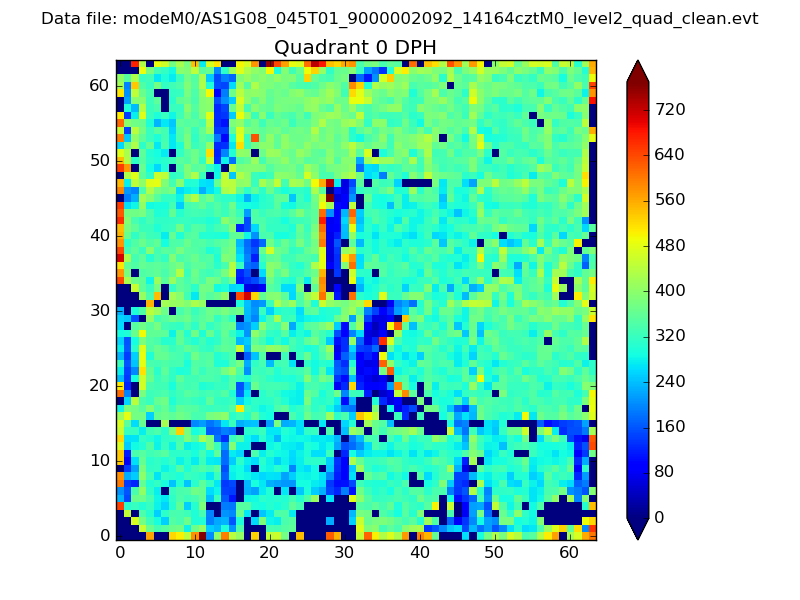 |
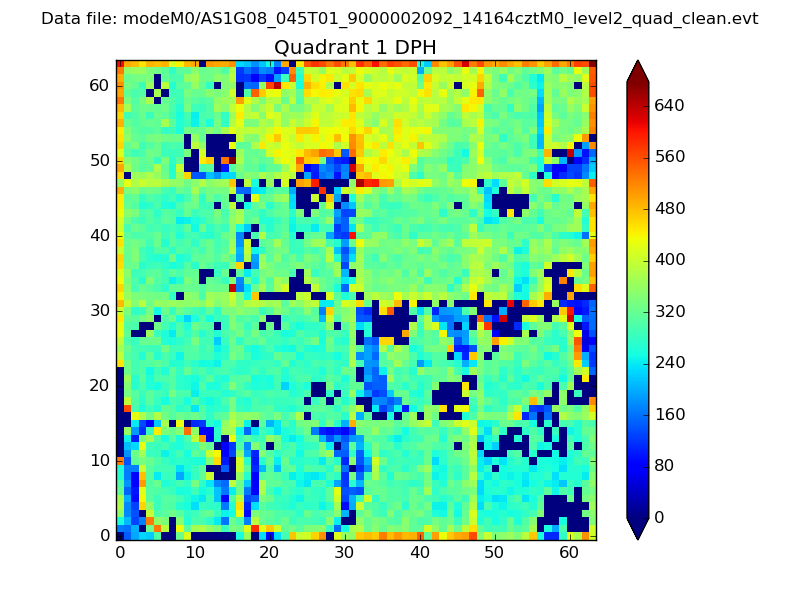 |
Quadrant B |
|---|---|---|---|
| Quadrant D | 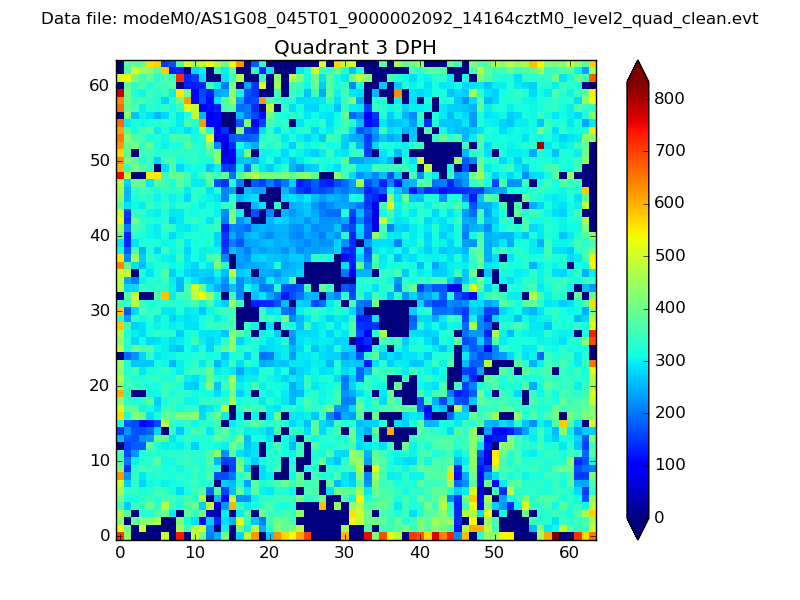 |
 |
Quadrant C |
| Plot type | Count rate plots | Images |
|---|---|---|
| Comparison with Poisson distribution Blue bars denote a histogram of data divided into 1 sec bins. Red curve is a Poisson curve with rate = median count rate of data. |
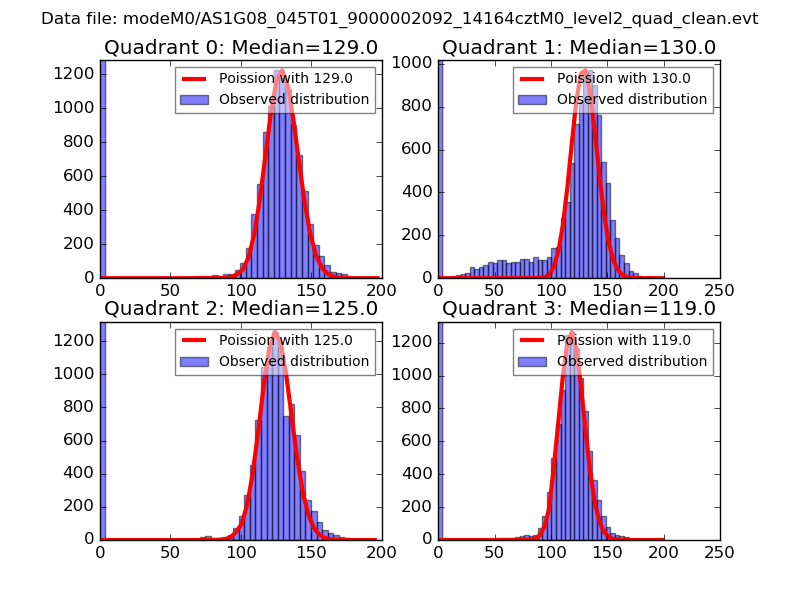 |
 |
| Quadrant-wise count rates Data is divided into 100 sec bins |
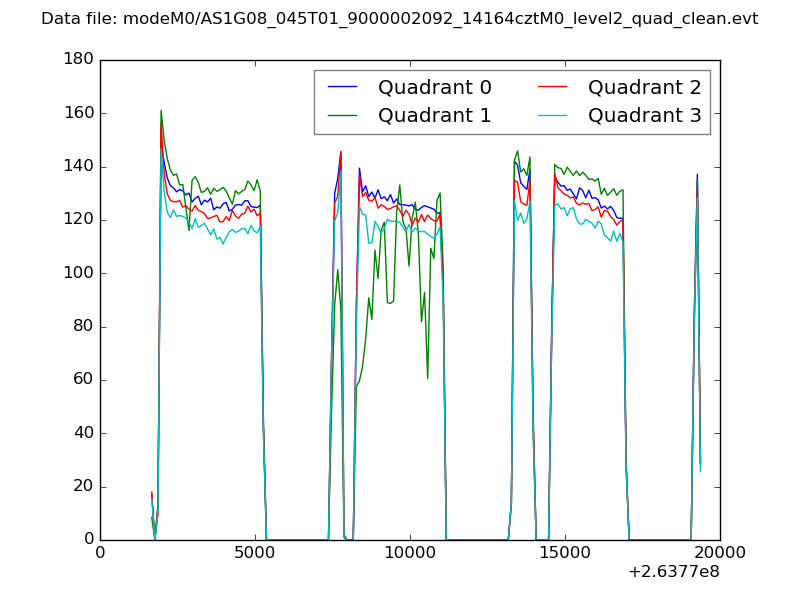 |
|
| Module-wise count rates for Quadrant A Data is divided into 100 sec bins |
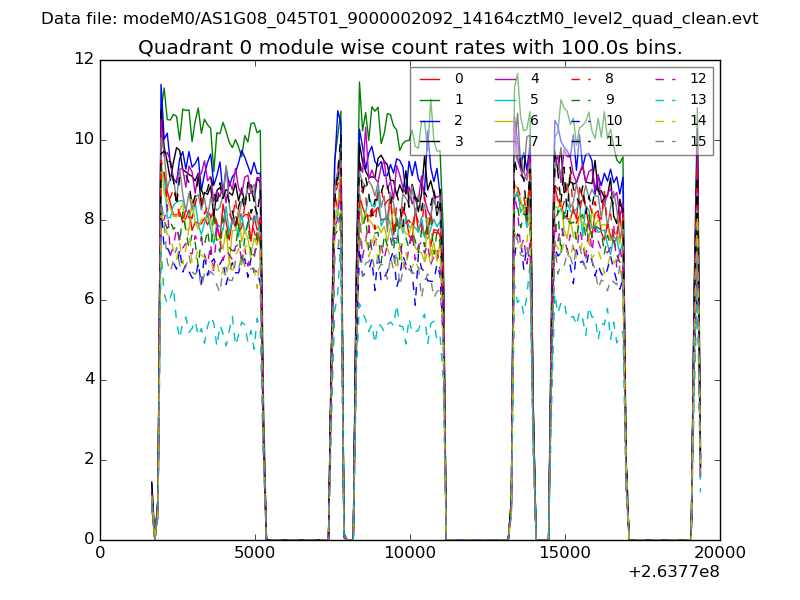 |
 |
| Module-wise count rates for Quadrant B Data is divided into 100 sec bins |
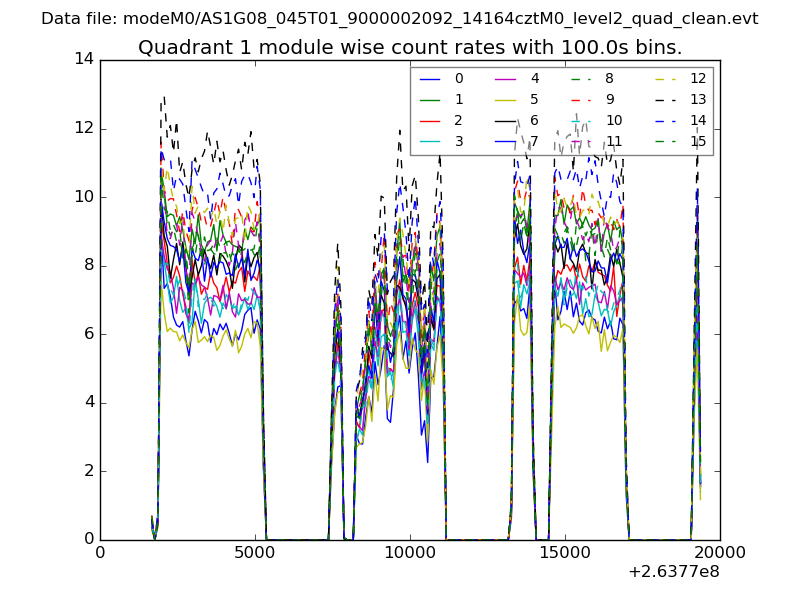 |
 |
| Module-wise count rates for Quadrant C Data is divided into 100 sec bins |
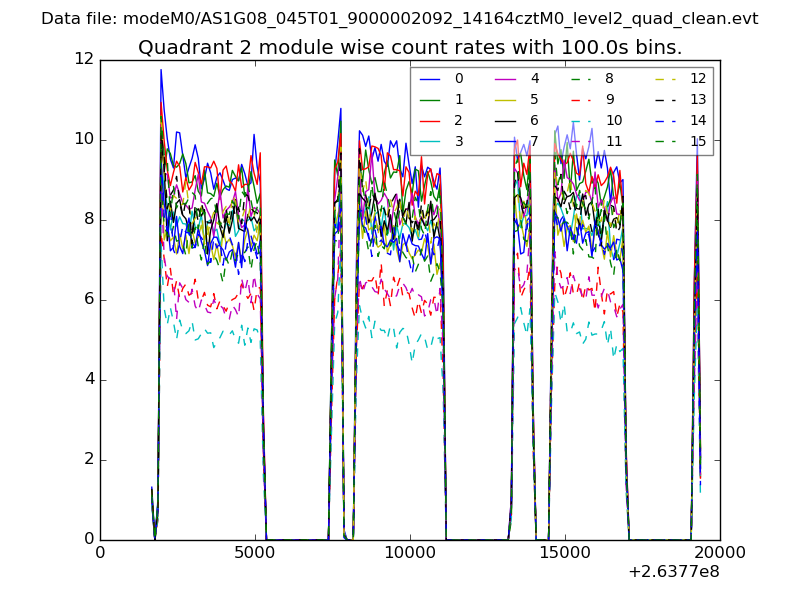 |
 |
| Module-wise count rates for Quadrant D Data is divided into 100 sec bins |
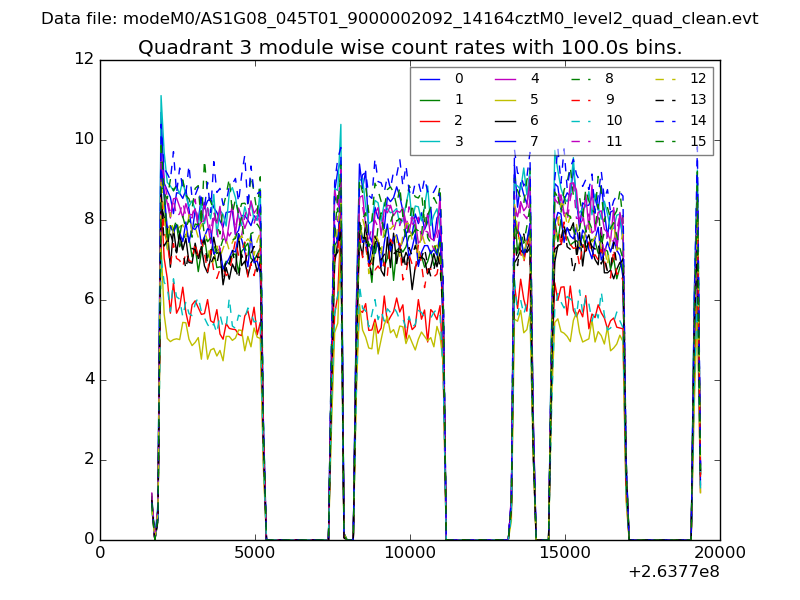 |
 |
| Parameter | Plot |
|---|---|
| CZT HV Monitor | 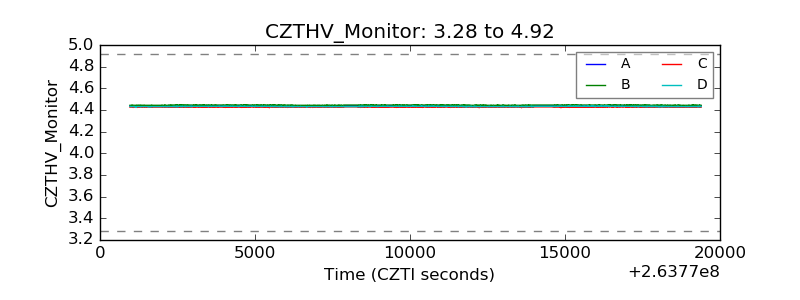 |
| D_VDD | 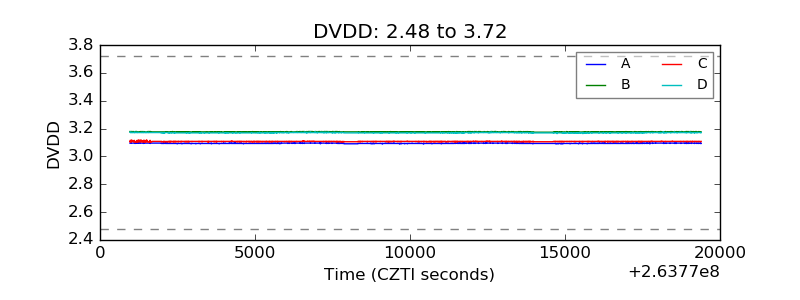 |
| Temperature 1 | 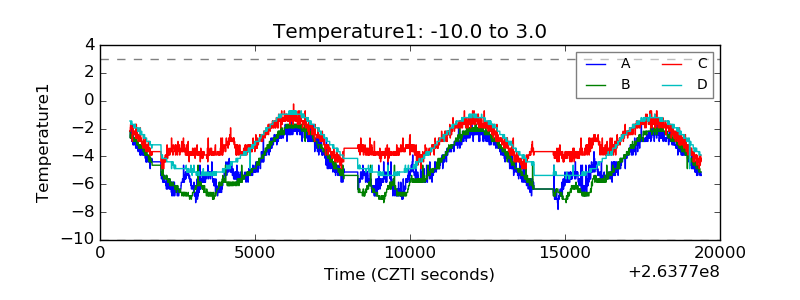 |
| Veto HV Monitor |  |
| Veto LLD | 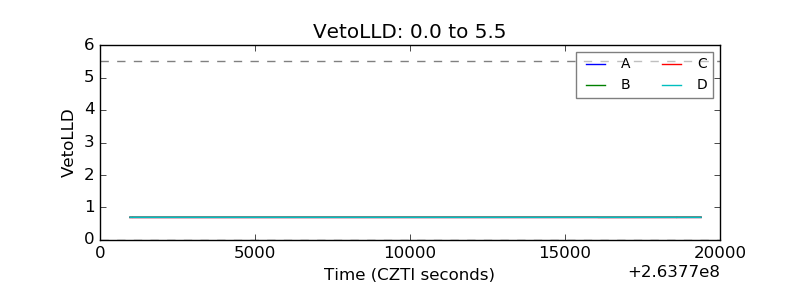 |
| Alpha Counter | 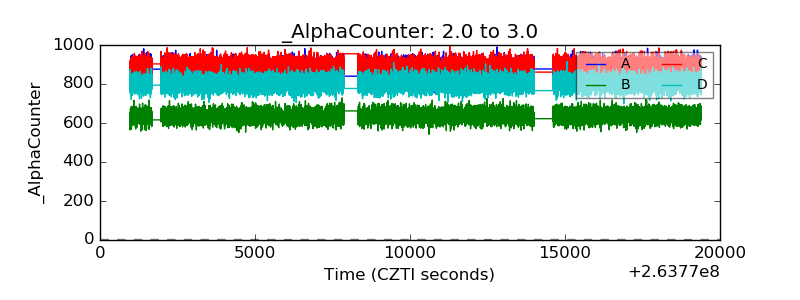 |
| _CPM_Rate | 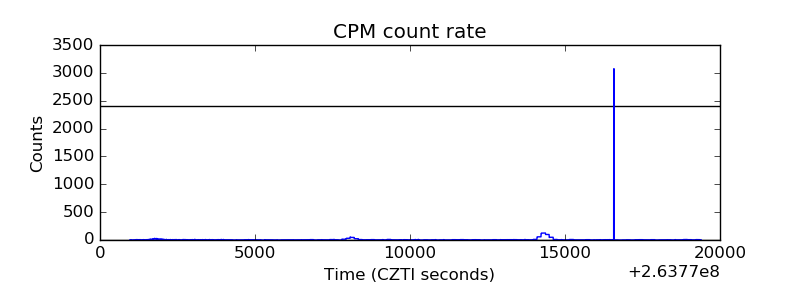 |
| CZT Counter |  |
| +2.5 Volts monitor |  |
| +5 Volts monitor | 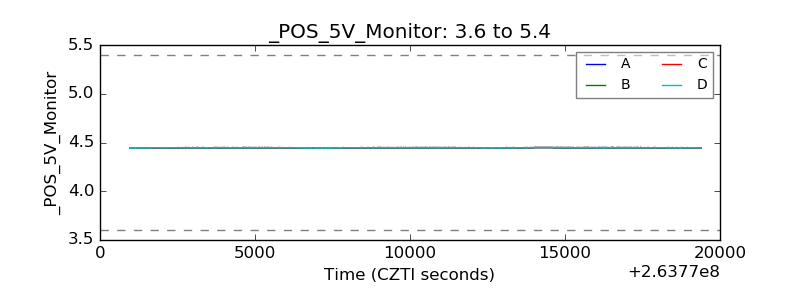 |
| _ROLL_ROT | 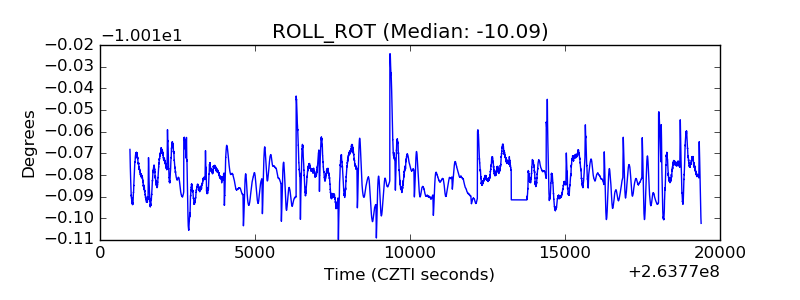 |
| _Roll_DEC | 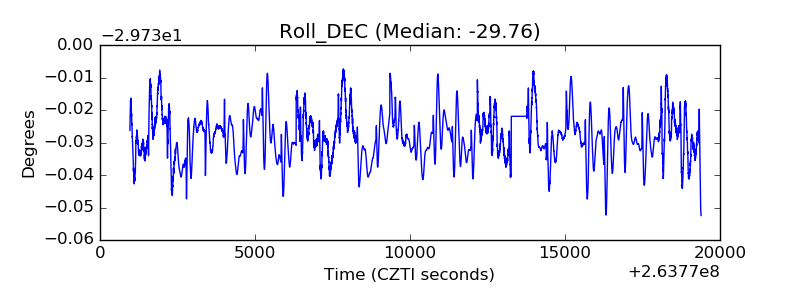 |
| _Roll_RA |  |
| Veto Counter | 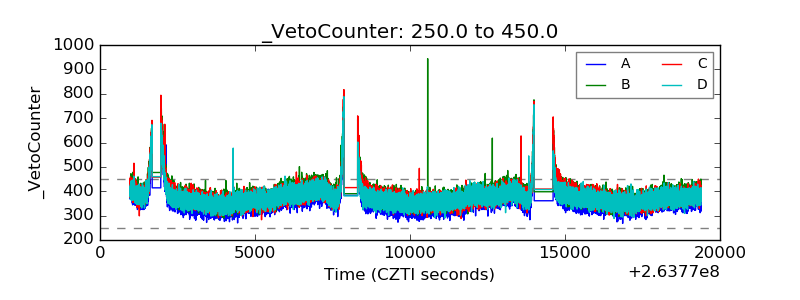 |