| Param | Original file | Final file |
|---|---|---|
| Filename | modeM0/AS1A04_229T01_9000002096cztM0_level2.fits | modeM0/AS1A04_229T01_9000002096cztM0_level2_quad_clean.evt |
| Size (bytes) | 960,549,120 | 965,237,760 |
| Size | 916.1 MB | 920.5 MB |
| Events in quadrant A | 5,916,188 | 5,909,496 |
| Events in quadrant B | 5,669,720 | 6,122,745 |
| Events in quadrant C | 5,726,144 | 5,444,045 |
| Events in quadrant D | 4,974,218 | 4,953,558 |
| Mode M9 | |||
|---|---|---|---|
| Quadrant | BADHDUFLAG | Total packets | Discarded packets |
| A | 0 | 136 | 0 |
| B | 0 | 136 | 0 |
| C | 0 | 136 | 0 |
| D | 0 | 136 | 0 |
| Mode M0 | |||
|---|---|---|---|
| Quadrant | BADHDUFLAG | Total packets | Discarded packets |
| A | 0 | 207290 | 0 |
| B | 0 | 220290 | 0 |
| C | 0 | 208333 | 0 |
| D | 0 | 239552 | 0 |
| Mode SS | |||
|---|---|---|---|
| Quadrant | BADHDUFLAG | Total packets | Discarded packets |
| A | 0 | 2020 | 0 |
| B | 0 | 2020 | 0 |
| C | 0 | 2020 | 0 |
| D | 0 | 2020 | 0 |
| Quadrant | Total seconds | Saturated seconds | Saturation percentage |
|---|---|---|---|
| A | 99282 | 917 | 0.923632% |
| B | 99282 | 1827 | 1.840213% |
| C | 99282 | 801 | 0.806793% |
| D | 99282 | 1519 | 1.529985% |
Noise dominated data is calculated using 1-second bins in cleaned event files. If a bin has >2000 counts, and if more than 50% of those come from <1% of pixels, then it is considered to be noise-dominated and hence unusable.
| Quadrant | # 1 sec bins | Bins with >0 counts | Bins with >2000 counts | High rate bins dominated by noise | Noise dominated (total time) | Noise dominated (detector-on time) | Marked lightcurve |
|---|---|---|---|---|---|---|---|
| A | 112743 | 99280 | 0 | 0 | 0.00% | 0.00% |  |
| B | 112743 | 99273 | 0 | 0 | 0.00% | 0.00% |  |
| C | 112743 | 99282 | 0 | 0 | 0.00% | 0.00% | 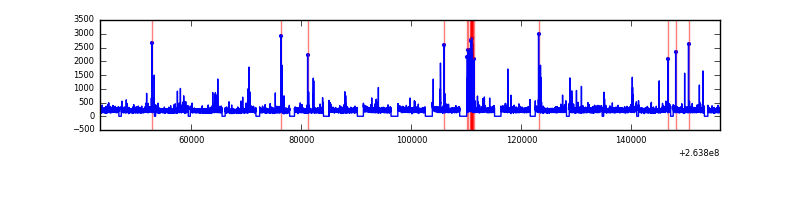 |
| D | 112743 | 99279 | 0 | 0 | 0.00% | 0.00% | 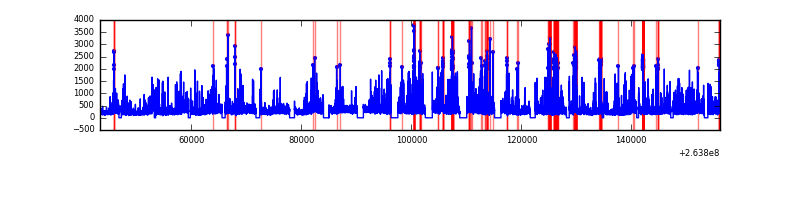 |
Top three noisy pixels from each quadrant. If the there are fewer than three noisy pixels in the level2.evt file, extra rows are filled as -1
| Pixel properties | Quadrant properties | ||||||
|---|---|---|---|---|---|---|---|
| Quadrant | DetID | PixID | Counts | Sigma | Mean | Median | Sigma |
| A | 0 | 29 | 5657 | 10.93 | 1541 | 1443 | 385.5 |
| A | 7 | 110 | 4774 | 8.64 | 1541 | 1443 | 385.5 |
| A | 9 | 19 | 4497 | 7.92 | 1541 | 1443 | 385.5 |
| B | 2 | 9 | 4894 | 11.83 | 1495 | 1424 | 293.3 |
| B | 3 | 17 | 3818 | 8.16 | 1495 | 1424 | 293.3 |
| B | 14 | 254 | 3715 | 7.81 | 1495 | 1424 | 293.3 |
| C | 12 | 241 | 4123 | 6.88 | 1514 | 1406 | 394.8 |
| C | 3 | 126 | 3829 | 6.14 | 1514 | 1406 | 394.8 |
| C | 3 | 158 | 3821 | 6.12 | 1514 | 1406 | 394.8 |
| D | 3 | 14 | 3610 | 6.1 | 1418 | 1283 | 381.7 |
| D | 6 | 231 | 3594 | 6.05 | 1418 | 1283 | 381.7 |
| D | 7 | 3 | 3537 | 5.9 | 1418 | 1283 | 381.7 |
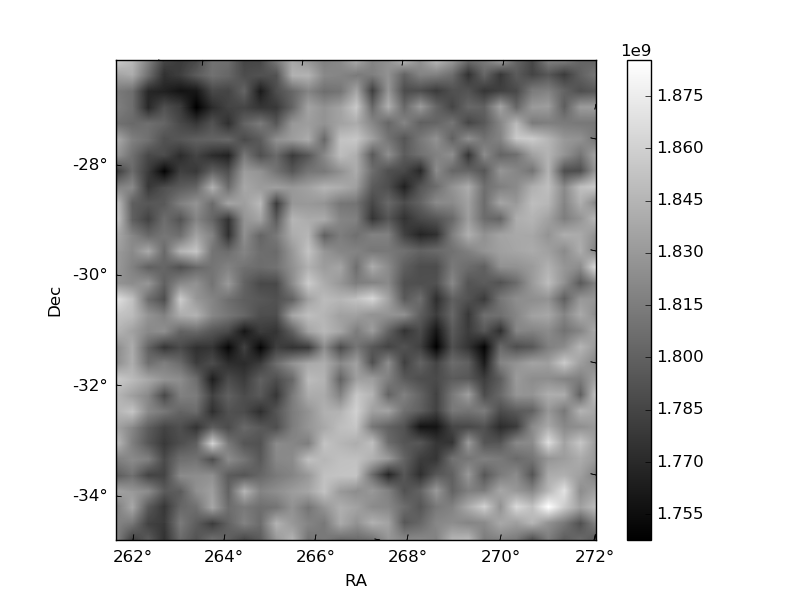
Histogram calculated using DETX and DETY for each event in the final _common_clean file
| Quadrant A |  |
 |
Quadrant B |
|---|---|---|---|
| Quadrant D |  |
 |
Quadrant C |
| Plot type | Count rate plots | Images |
|---|---|---|
| Comparison with Poisson distribution Blue bars denote a histogram of data divided into 1 sec bins. Red curve is a Poisson curve with rate = median count rate of data. |
 |
 |
| Quadrant-wise count rates Data is divided into 100 sec bins |
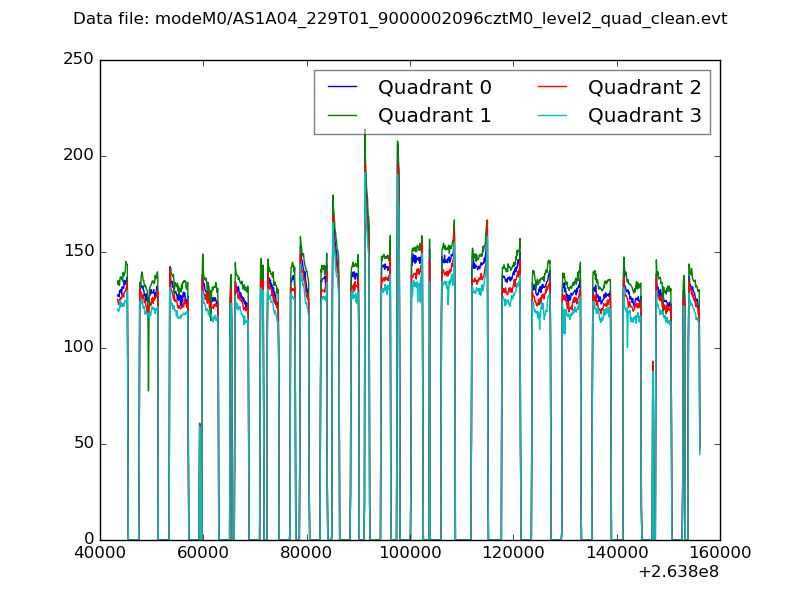 |
|
| Module-wise count rates for Quadrant A Data is divided into 100 sec bins |
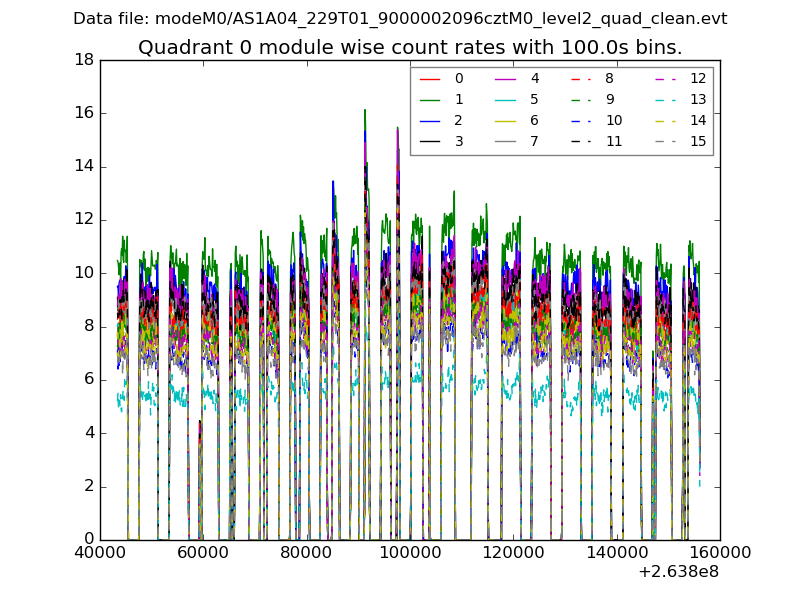 |
 |
| Module-wise count rates for Quadrant B Data is divided into 100 sec bins |
 |
 |
| Module-wise count rates for Quadrant C Data is divided into 100 sec bins |
 |
 |
| Module-wise count rates for Quadrant D Data is divided into 100 sec bins |
 |
 |
| Parameter | Plot |
|---|---|
| CZT HV Monitor |  |
| D_VDD |  |
| Temperature 1 | 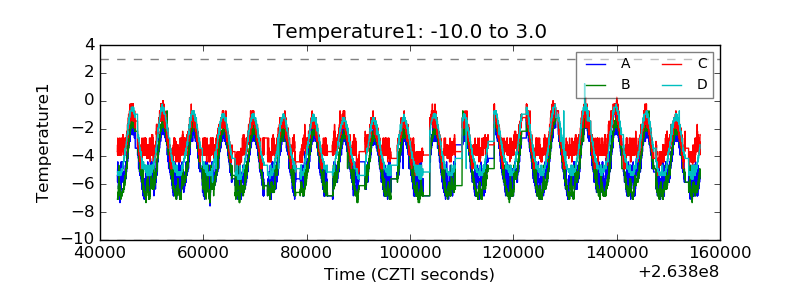 |
| Veto HV Monitor |  |
| Veto LLD |  |
| Alpha Counter | 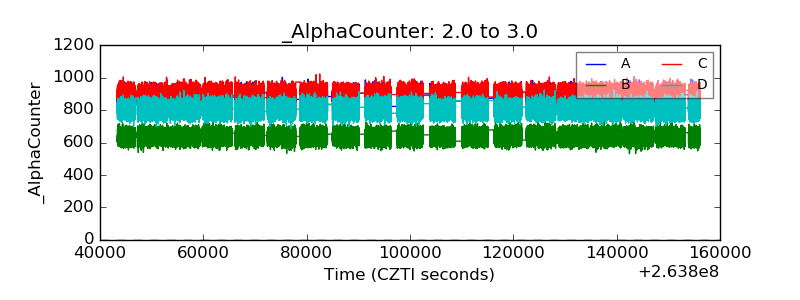 |
| _CPM_Rate |  |
| CZT Counter |  |
| +2.5 Volts monitor |  |
| +5 Volts monitor |  |
| _ROLL_ROT |  |
| _Roll_DEC |  |
| _Roll_RA |  |
| Veto Counter |  |