| Param | Original file | Final file |
|---|---|---|
| Filename | modeM0/AS1A04_229T01_9000002096_14175cztM0_level2.evt | modeM0/AS1A04_229T01_9000002096_14175cztM0_level2_quad_clean.evt |
| Size (bytes) | 549,959,040 | 105,482,880 |
| Size | 524.5 MB | 100.6 MB |
| Events in quadrant A | 3,612,316 | 679,879 |
| Events in quadrant B | 4,849,791 | 696,308 |
| Events in quadrant C | 3,750,486 | 660,881 |
| Events in quadrant D | 3,930,052 | 631,570 |
| Mode M9 | |||
|---|---|---|---|
| Quadrant | BADHDUFLAG | Total packets | Discarded packets |
| A | 0 | 2 | 0 |
| B | 0 | 2 | 0 |
| C | 0 | 2 | 0 |
| D | 0 | 2 | 0 |
| Mode M0 | |||
|---|---|---|---|
| Quadrant | BADHDUFLAG | Total packets | Discarded packets |
| A | 0 | 15743 | 2 |
| B | 0 | 19358 | 1 |
| C | 0 | 15823 | 1 |
| D | 0 | 16877 | 1 |
| Mode SS | |||
|---|---|---|---|
| Quadrant | BADHDUFLAG | Total packets | Discarded packets |
| A | 0 | 152 | 0 |
| B | 0 | 152 | 0 |
| C | 0 | 152 | 0 |
| D | 0 | 152 | 0 |
| Quadrant | Total seconds | Saturated seconds | Saturation percentage |
|---|---|---|---|
| A | 7563 | 49 | 0.647891% |
| B | 7563 | 383 | 5.064128% |
| C | 7563 | 63 | 0.833003% |
| D | 7563 | 108 | 1.428005% |
Noise dominated data is calculated using 1-second bins in cleaned event files. If a bin has >2000 counts, and if more than 50% of those come from <1% of pixels, then it is considered to be noise-dominated and hence unusable.
| Quadrant | # 1 sec bins | Bins with >0 counts | Bins with >2000 counts | High rate bins dominated by noise | Noise dominated (total time) | Noise dominated (detector-on time) | Marked lightcurve |
|---|---|---|---|---|---|---|---|
| A | 7794 | 7565 | 0 | 0 | 0.00% | 0.00% |  |
| B | 7794 | 7565 | 184 | 184 | 2.36% | 2.43% |  |
| C | 7794 | 7565 | 7 | 7 | 0.09% | 0.09% |  |
| D | 7794 | 7565 | 8 | 8 | 0.10% | 0.11% |  |
Top three noisy pixels from each quadrant. If the there are fewer than three noisy pixels in the level2.evt file, extra rows are filled as -1
| Pixel properties | Quadrant properties | ||||||
|---|---|---|---|---|---|---|---|
| Quadrant | DetID | PixID | Counts | Sigma | Mean | Median | Sigma |
| A | 12 | 189 | 36920 | 191.88 | 924 | 903 | 187.7 |
| A | 12 | 96 | 11904 | 58.61 | 924 | 903 | 187.7 |
| A | 8 | 15 | 8927 | 42.75 | 924 | 903 | 187.7 |
| B | 0 | 85 | 595470 | 3398.81 | 920 | 899 | 174.9 |
| B | 10 | 252 | 413605 | 2359.2 | 920 | 899 | 174.9 |
| B | 0 | 219 | 51734 | 290.59 | 920 | 899 | 174.9 |
| C | 3 | 233 | 211488 | 1013.07 | 896 | 901 | 207.9 |
| C | 0 | 207 | 37145 | 174.36 | 896 | 901 | 207.9 |
| C | 13 | 61 | 6524 | 27.05 | 896 | 901 | 207.9 |
| D | 8 | 195 | 153465 | 707.64 | 883 | 862 | 215.6 |
| D | 7 | 55 | 138355 | 637.58 | 883 | 862 | 215.6 |
| D | 2 | 152 | 95679 | 439.68 | 883 | 862 | 215.6 |
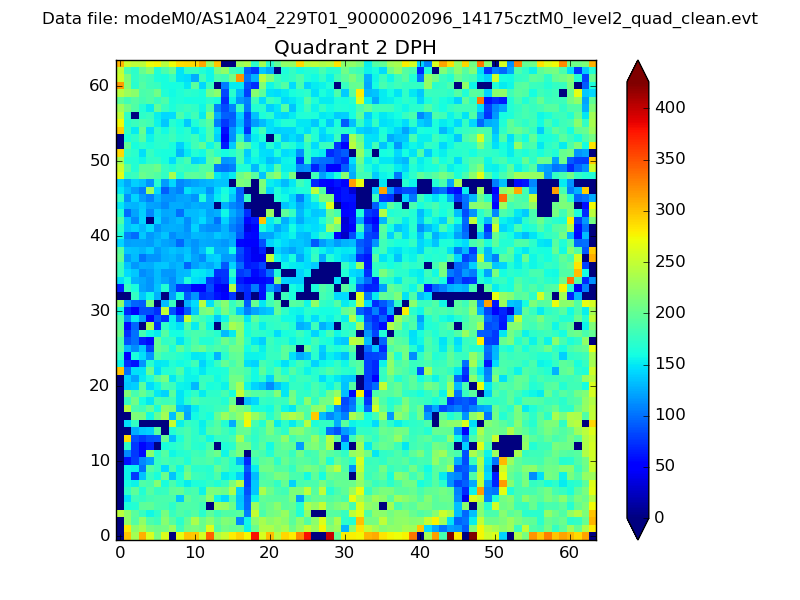
Histogram calculated using DETX and DETY for each event in the final _common_clean file
| Quadrant A | 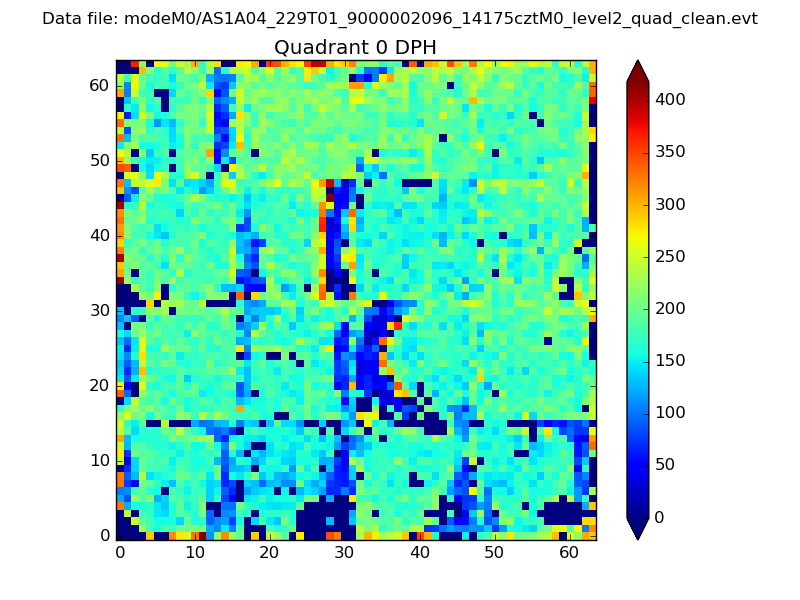 |
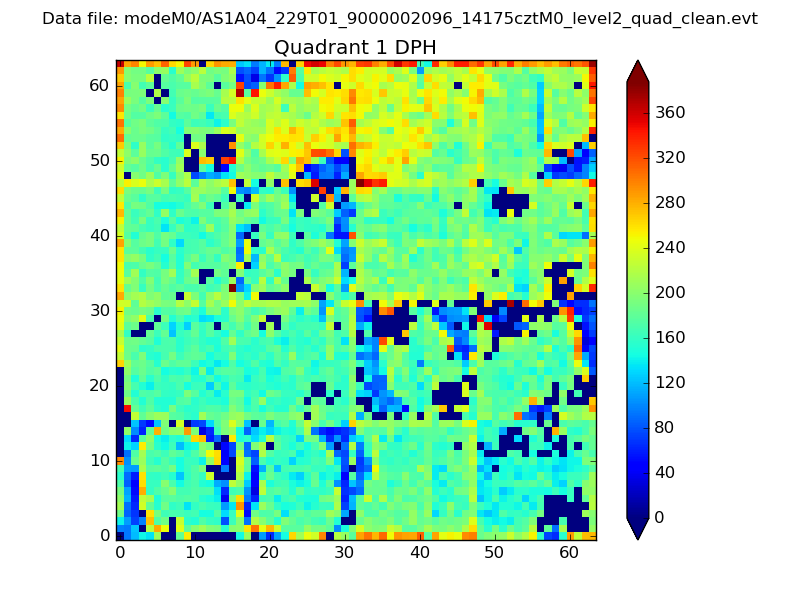 |
Quadrant B |
|---|---|---|---|
| Quadrant D | 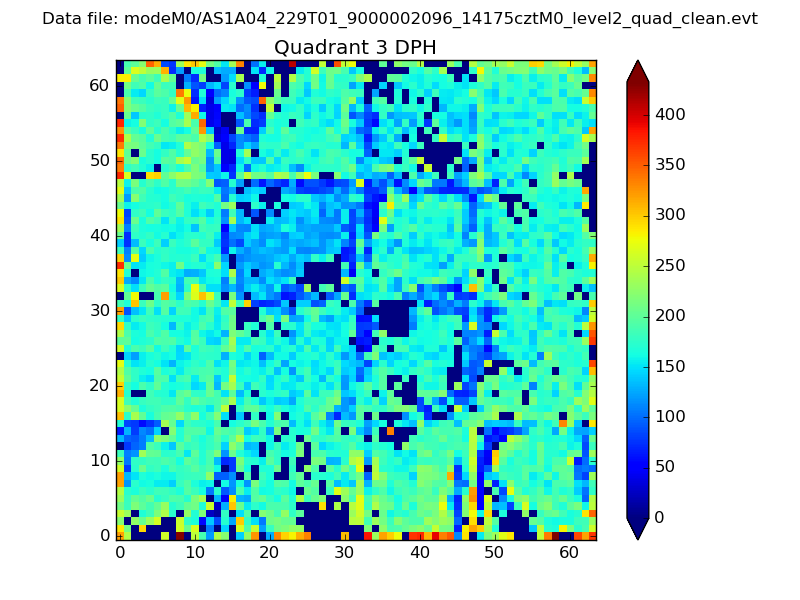 |
 |
Quadrant C |
| Plot type | Count rate plots | Images |
|---|---|---|
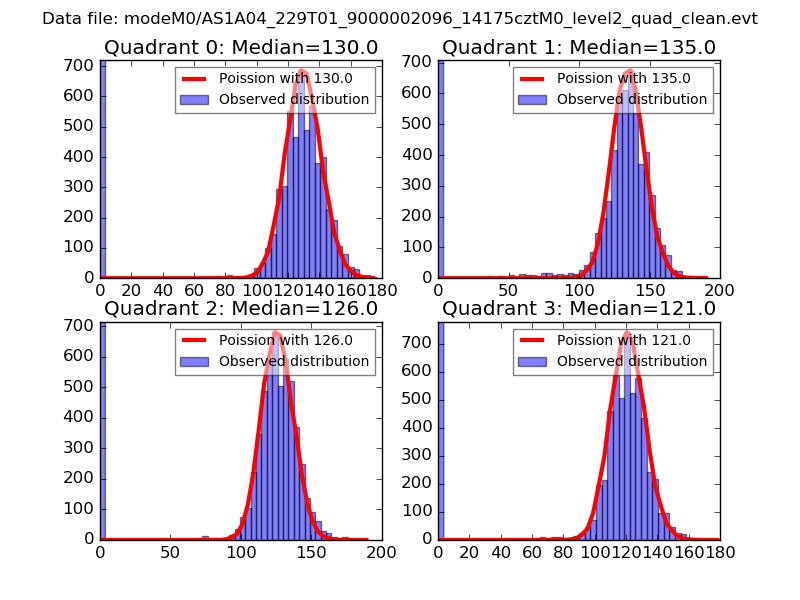
| Comparison with Poisson distribution Blue bars denote a histogram of data divided into 1 sec bins. Red curve is a Poisson curve with rate = median count rate of data. |
 |
 |
| Quadrant-wise count rates Data is divided into 100 sec bins |
 |
|
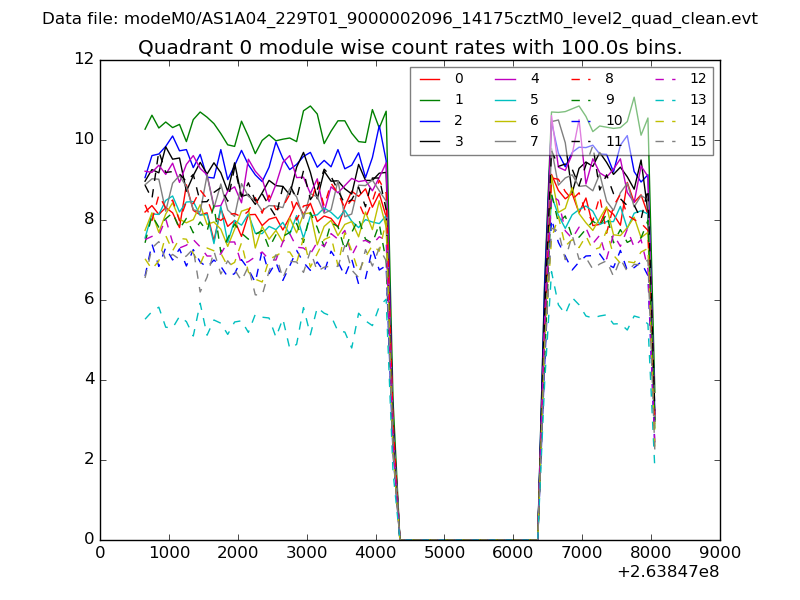
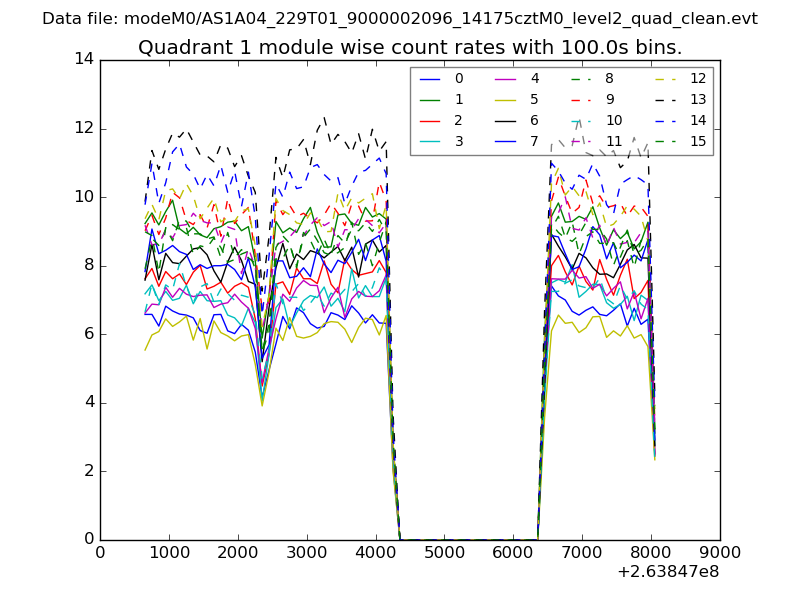
| Module-wise count rates for Quadrant A Data is divided into 100 sec bins |
 |
 |
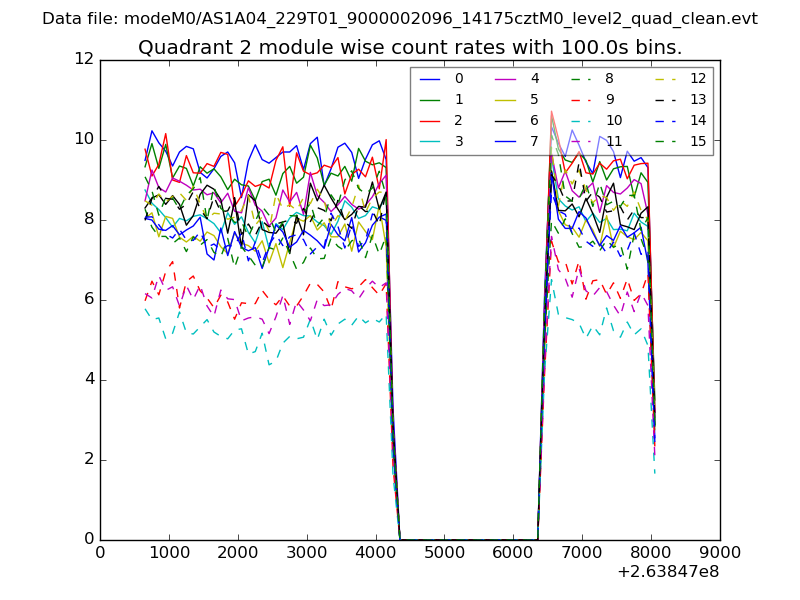
| Module-wise count rates for Quadrant B Data is divided into 100 sec bins |
 |
 |
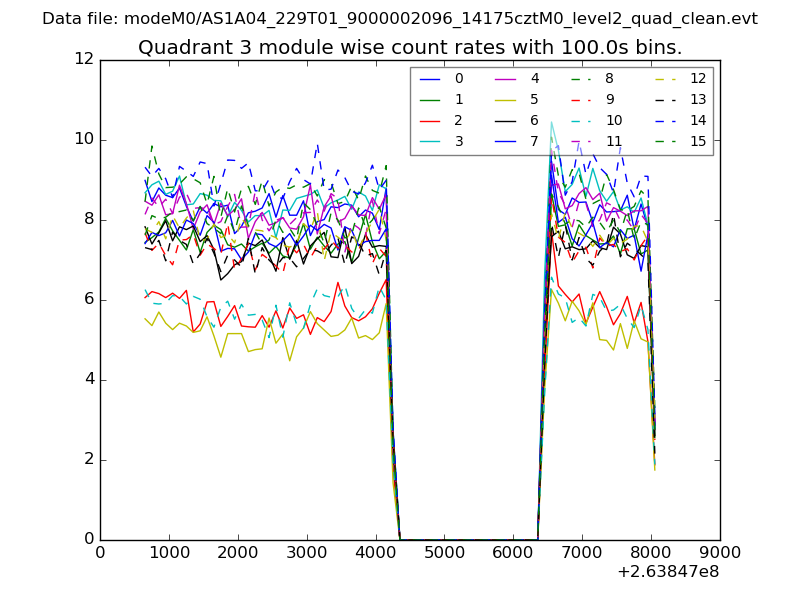
| Module-wise count rates for Quadrant C Data is divided into 100 sec bins |
 |
 |
| Module-wise count rates for Quadrant D Data is divided into 100 sec bins |
 |
 |
| Parameter | Plot |
|---|---|
| CZT HV Monitor | 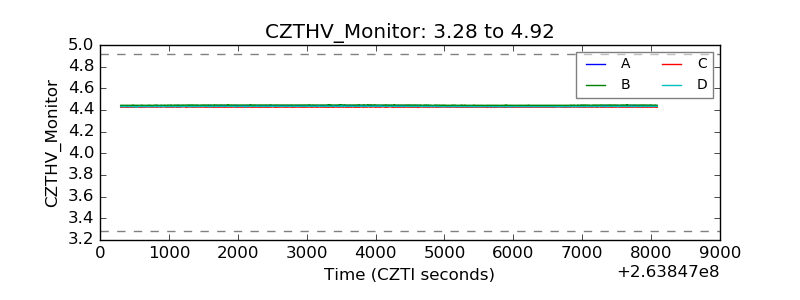 |
| D_VDD | 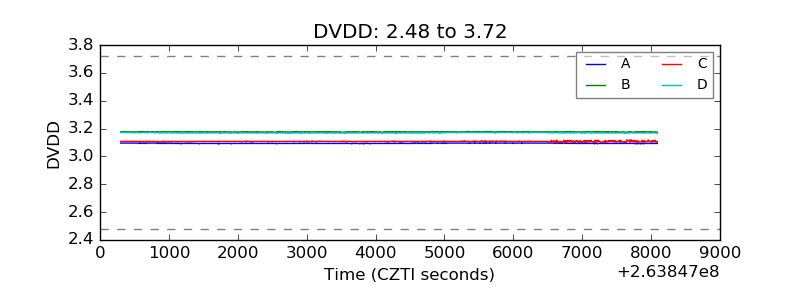 |
| Temperature 1 | 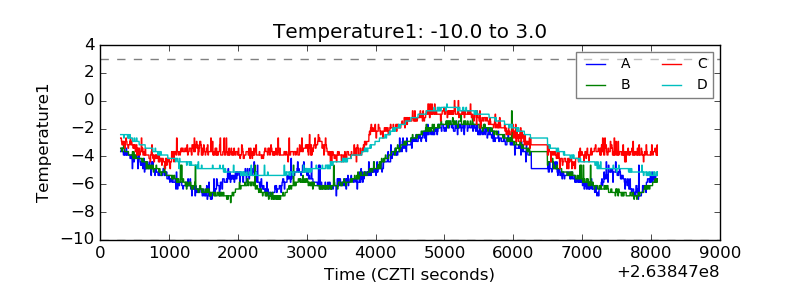 |
| Veto HV Monitor |  |
| Veto LLD |  |
| Alpha Counter | 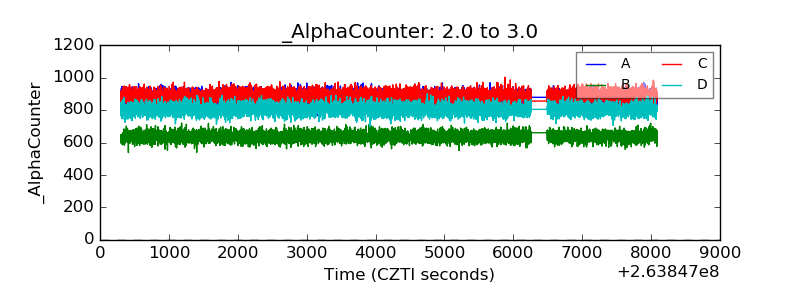 |
| _CPM_Rate | 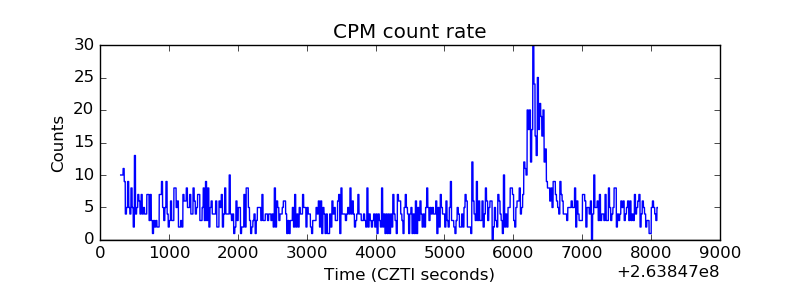 |
| CZT Counter |  |
| +2.5 Volts monitor |  |
| +5 Volts monitor |  |
| _ROLL_ROT |  |
| _Roll_DEC |  |
| _Roll_RA |  |
| Veto Counter |  |