| Param | Original file | Final file |
|---|---|---|
| Filename | modeM0/AS1A04_229T01_9000002096_14179cztM0_level2.evt | modeM0/AS1A04_229T01_9000002096_14179cztM0_level2_quad_clean.evt |
| Size (bytes) | 604,532,160 | 90,095,040 |
| Size | 576.5 MB | 85.9 MB |
| Events in quadrant A | 4,081,785 | 544,754 |
| Events in quadrant B | 4,843,951 | 534,930 |
| Events in quadrant C | 4,158,289 | 529,952 |
| Events in quadrant D | 4,661,935 | 542,716 |
| Mode M9 | |||
|---|---|---|---|
| Quadrant | BADHDUFLAG | Total packets | Discarded packets |
| A | 0 | 9 | 3 |
| B | 0 | 10 | 4 |
| C | 0 | 11 | 5 |
| D | 0 | 10 | 4 |
| Mode M0 | |||
|---|---|---|---|
| Quadrant | BADHDUFLAG | Total packets | Discarded packets |
| A | 0 | 24586 | 7087 |
| B | 0 | 27941 | 8180 |
| C | 0 | 24529 | 6987 |
| D | 0 | 27887 | 8402 |
| Mode SS | |||
|---|---|---|---|
| Quadrant | BADHDUFLAG | Total packets | Discarded packets |
| A | 0 | 241 | 69 |
| B | 0 | 237 | 69 |
| C | 0 | 244 | 70 |
| D | 0 | 240 | 68 |
| Quadrant | Total seconds | Saturated seconds | Saturation percentage |
|---|---|---|---|
| A | 8258 | 64 | 0.775006% |
| B | 8268 | 260 | 3.144654% |
| C | 8315 | 90 | 1.082381% |
| D | 8267 | 153 | 1.850732% |
Noise dominated data is calculated using 1-second bins in cleaned event files. If a bin has >2000 counts, and if more than 50% of those come from <1% of pixels, then it is considered to be noise-dominated and hence unusable.
| Quadrant | # 1 sec bins | Bins with >0 counts | Bins with >2000 counts | High rate bins dominated by noise | Noise dominated (total time) | Noise dominated (detector-on time) | Marked lightcurve |
|---|---|---|---|---|---|---|---|
| A | 10609 | 8559 | 0 | 0 | 0.00% | 0.00% | 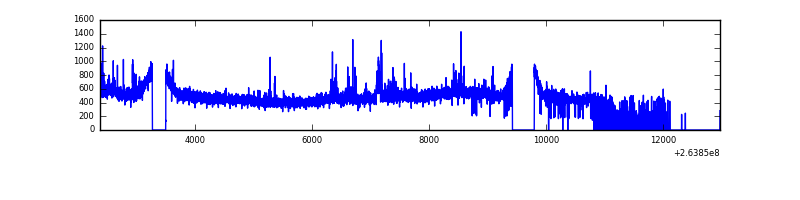 |
| B | 10006 | 8569 | 48 | 48 | 0.48% | 0.56% | 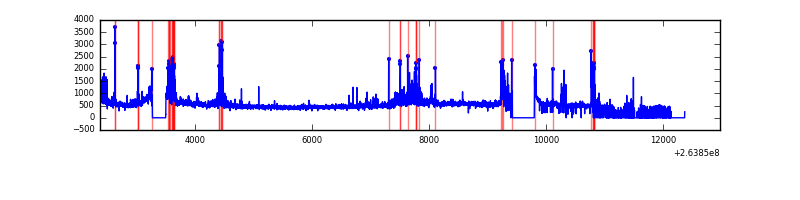 |
| C | 9959 | 8629 | 7 | 7 | 0.07% | 0.08% | 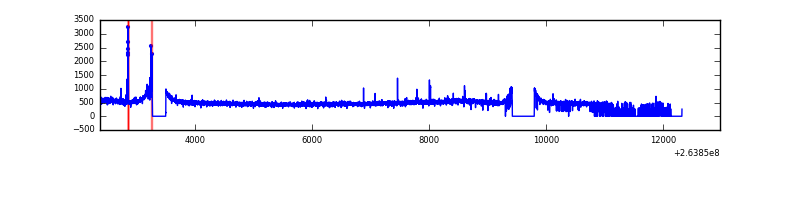 |
| D | 10036 | 8583 | 22 | 22 | 0.22% | 0.26% | 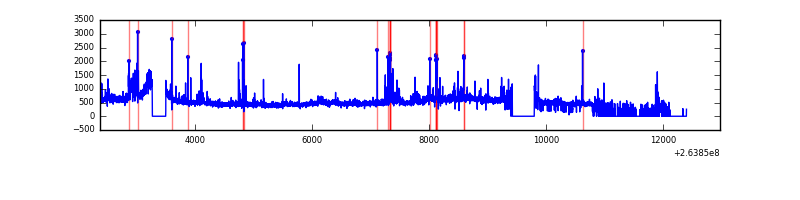 |
Top three noisy pixels from each quadrant. If the there are fewer than three noisy pixels in the level2.evt file, extra rows are filled as -1
| Pixel properties | Quadrant properties | ||||||
|---|---|---|---|---|---|---|---|
| Quadrant | DetID | PixID | Counts | Sigma | Mean | Median | Sigma |
| A | 12 | 189 | 117967 | 559.34 | 1024 | 1003 | 209.1 |
| A | 12 | 96 | 25006 | 114.79 | 1024 | 1003 | 209.1 |
| A | 0 | 226 | 8993 | 38.21 | 1024 | 1003 | 209.1 |
| B | 0 | 85 | 493089 | 2504.18 | 1029 | 1006 | 196.5 |
| B | 0 | 219 | 116856 | 589.55 | 1029 | 1006 | 196.5 |
| B | 0 | 189 | 104017 | 524.22 | 1029 | 1006 | 196.5 |
| C | 3 | 233 | 192550 | 821.09 | 1001 | 1006 | 233.3 |
| C | 0 | 207 | 48026 | 201.56 | 1001 | 1006 | 233.3 |
| C | 13 | 61 | 7370 | 27.28 | 1001 | 1006 | 233.3 |
| D | 8 | 195 | 293681 | 1232.69 | 980 | 957 | 237.5 |
| D | 7 | 55 | 138494 | 579.18 | 980 | 957 | 237.5 |
| D | 2 | 152 | 137569 | 575.29 | 980 | 957 | 237.5 |
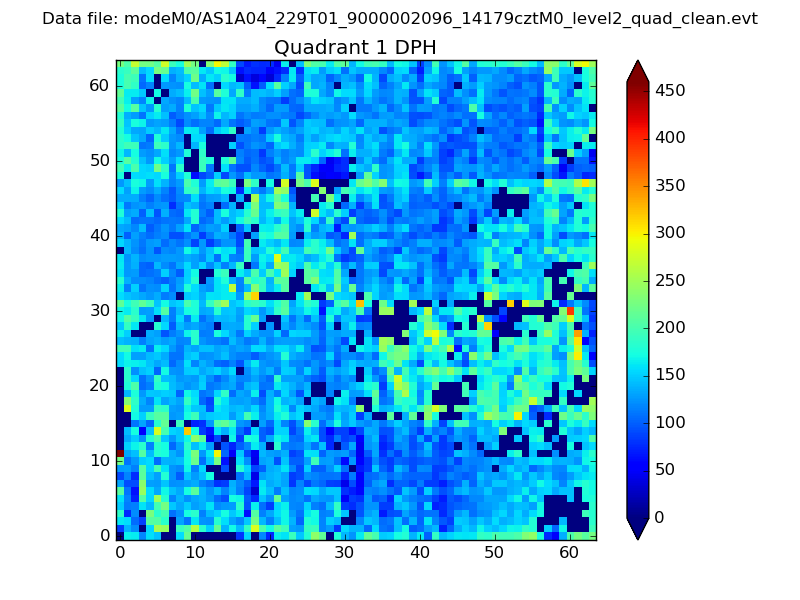
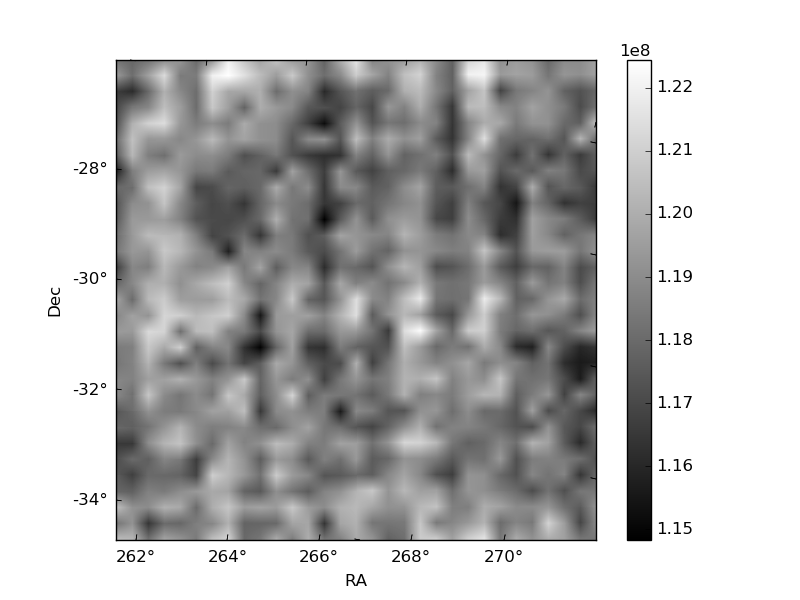
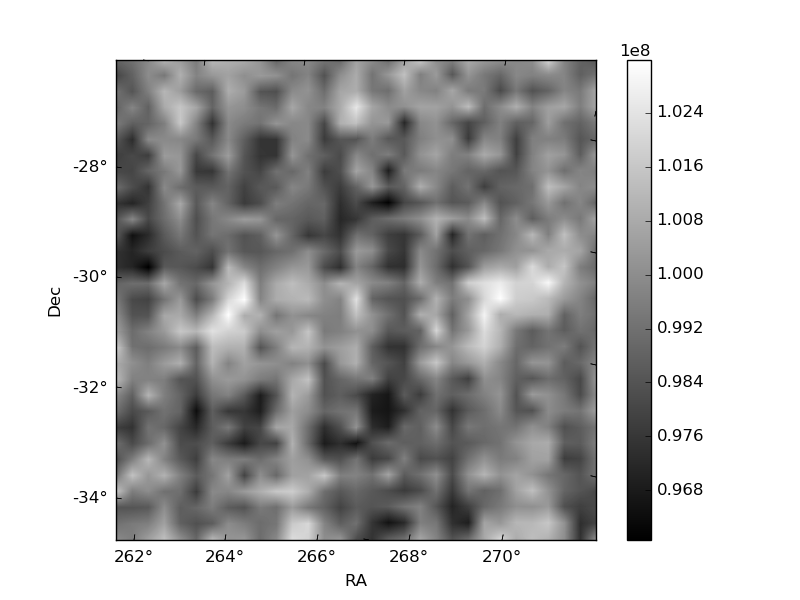
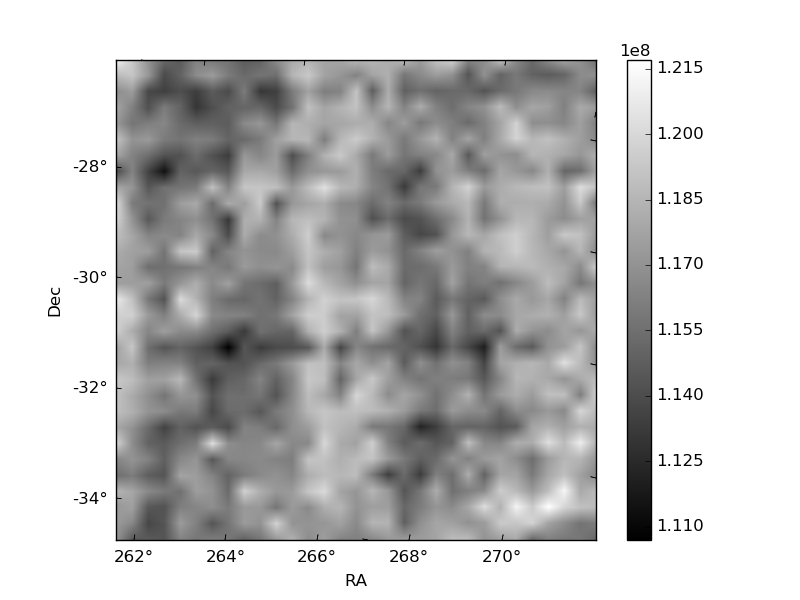
Histogram calculated using DETX and DETY for each event in the final _common_clean file
| Quadrant A |  |
 |
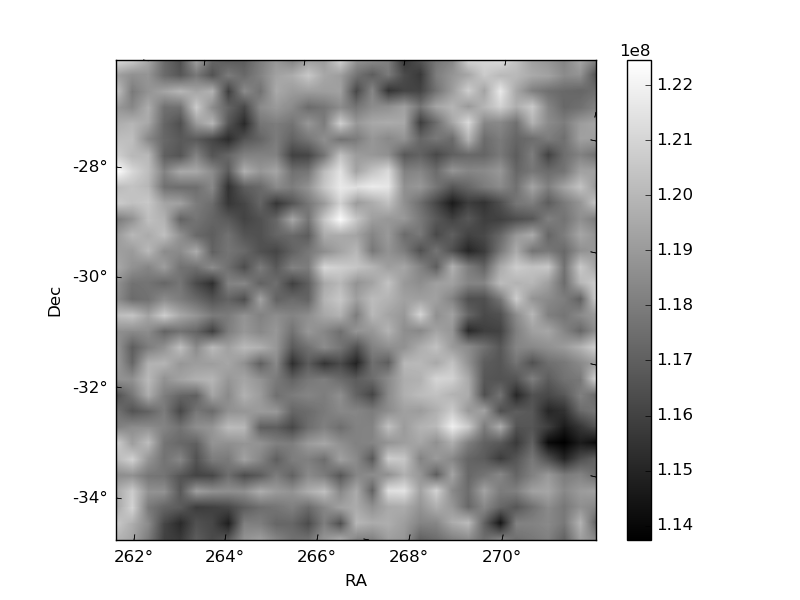
Quadrant B |
|---|---|---|---|
| Quadrant D |  |
 |
Quadrant C |
| Plot type | Count rate plots | Images |
|---|---|---|
| Comparison with Poisson distribution Blue bars denote a histogram of data divided into 1 sec bins. Red curve is a Poisson curve with rate = median count rate of data. |
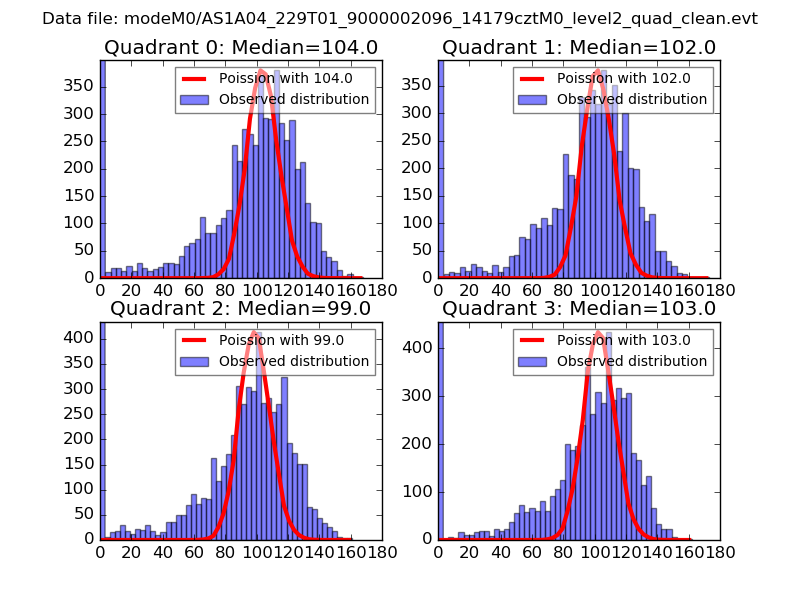 |
 |
| Quadrant-wise count rates Data is divided into 100 sec bins |
 |
|
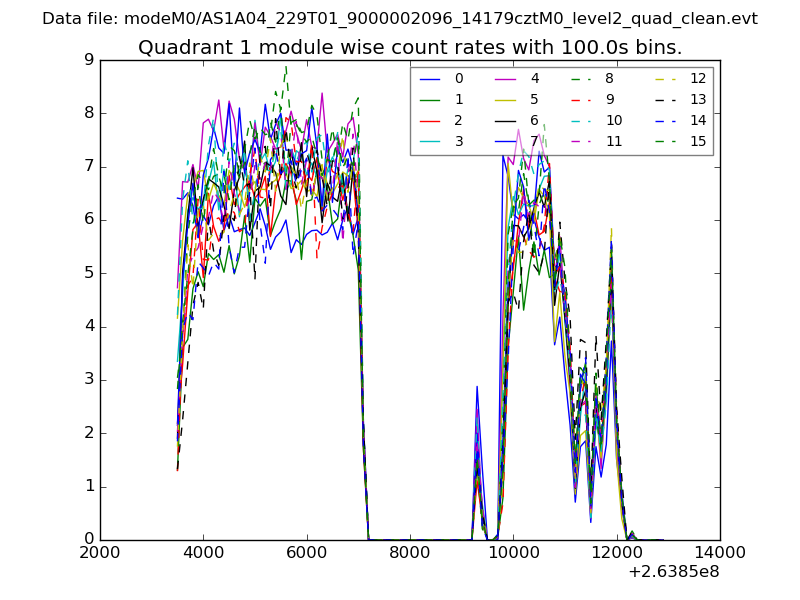
| Module-wise count rates for Quadrant A Data is divided into 100 sec bins |
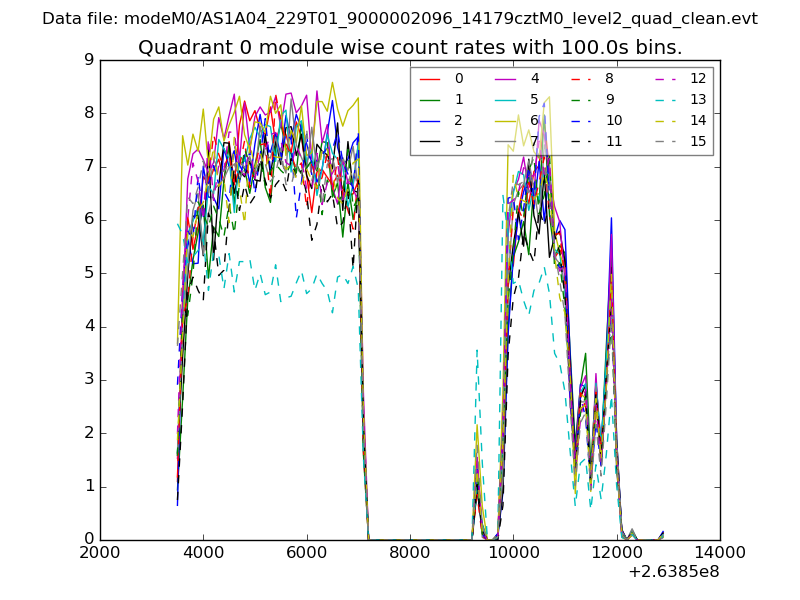 |
 |
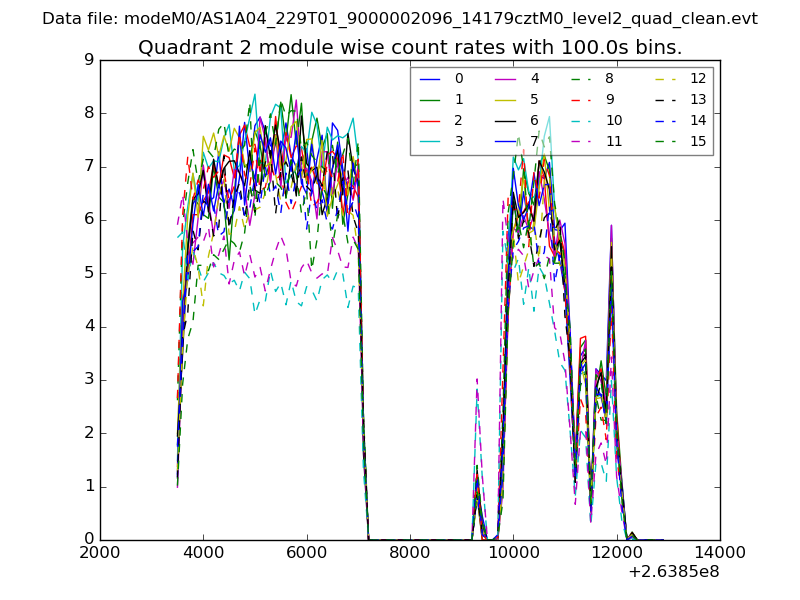
| Module-wise count rates for Quadrant B Data is divided into 100 sec bins |
 |
 |
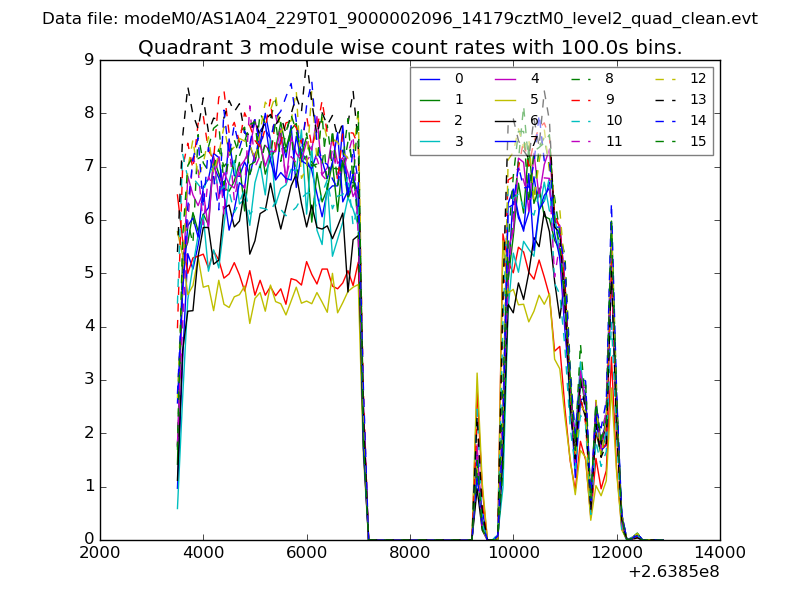
| Module-wise count rates for Quadrant C Data is divided into 100 sec bins |
 |
 |
| Module-wise count rates for Quadrant D Data is divided into 100 sec bins |
 |
 |
| Parameter | Plot |
|---|---|
| CZT HV Monitor | 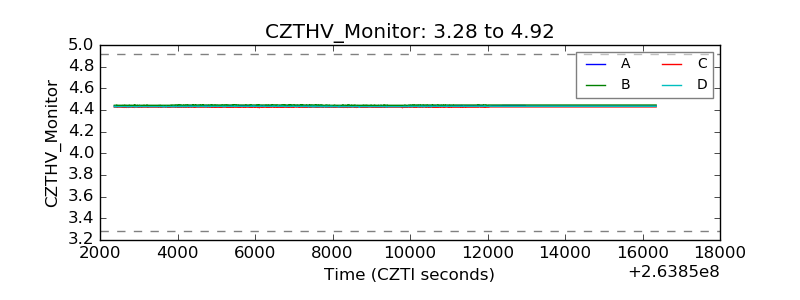 |
| D_VDD | 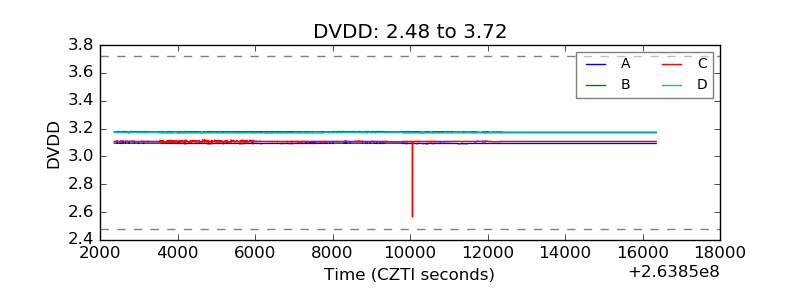 |
| Temperature 1 | 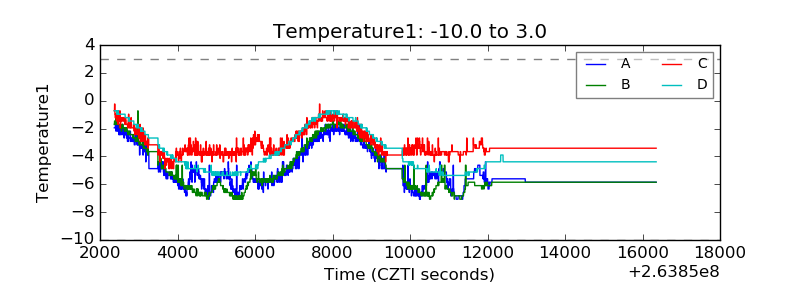 |
| Veto HV Monitor | 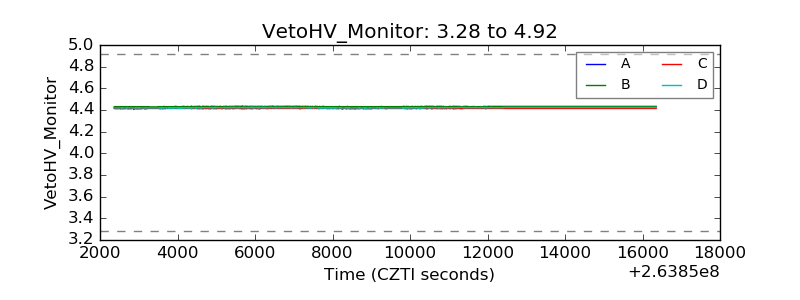 |
| Veto LLD |  |
| Alpha Counter | 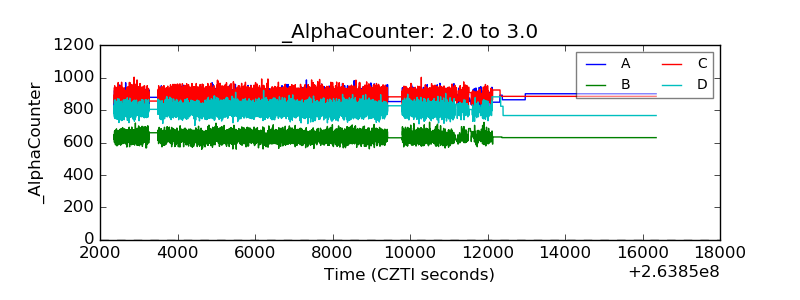 |
| _CPM_Rate | 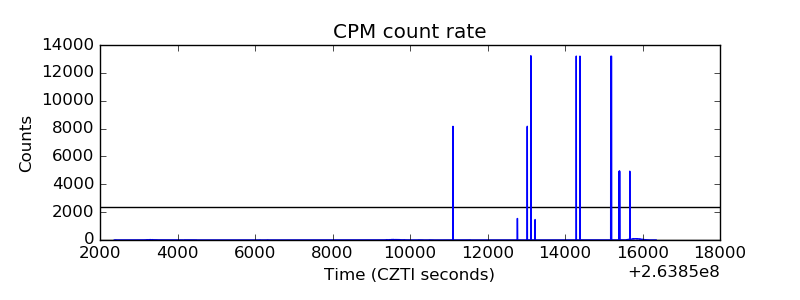 |
| CZT Counter |  |
| +2.5 Volts monitor |  |
| +5 Volts monitor |  |
| _ROLL_ROT | 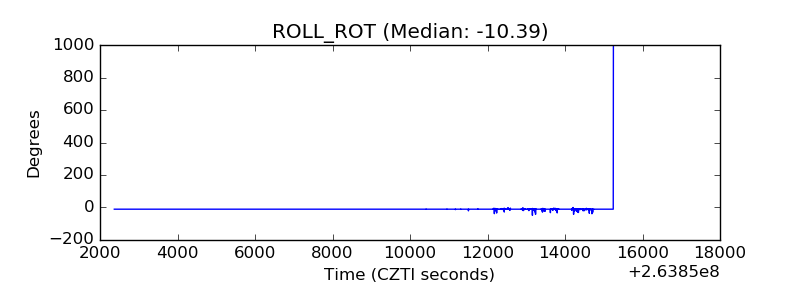 |
| _Roll_DEC | 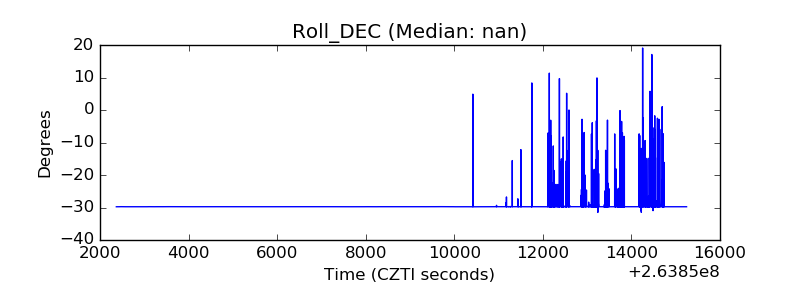 |
| _Roll_RA | 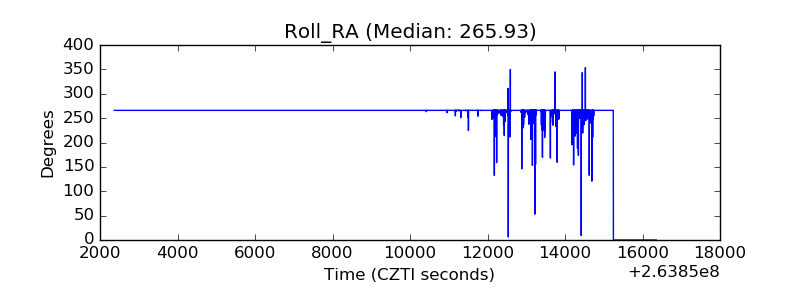 |
| Veto Counter | 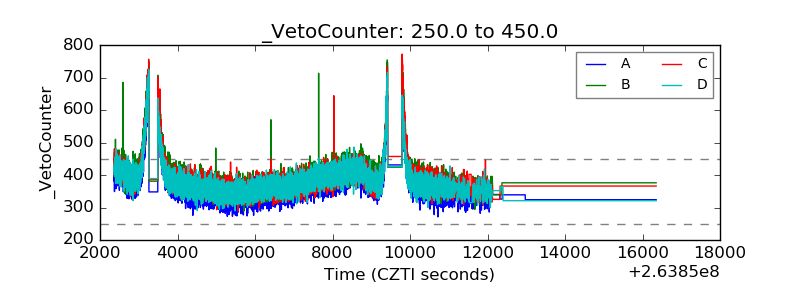 |