| Param | Original file | Final file |
|---|---|---|
| Filename | modeM0/AS1A04_229T01_9000002096_14182cztM0_level2.evt | modeM0/AS1A04_229T01_9000002096_14182cztM0_level2_quad_clean.evt |
| Size (bytes) | 2,439,858,240 | 440,112,960 |
| Size | 2.3 GB | 419.7 MB |
| Events in quadrant A | 16,603,484 | 2,774,946 |
| Events in quadrant B | 18,495,722 | 2,901,298 |
| Events in quadrant C | 16,715,977 | 2,705,380 |
| Events in quadrant D | 19,749,673 | 2,580,237 |
| Mode M9 | |||
|---|---|---|---|
| Quadrant | BADHDUFLAG | Total packets | Discarded packets |
| A | 0 | 46 | 0 |
| B | 0 | 46 | 0 |
| C | 0 | 46 | 0 |
| D | 0 | 46 | 0 |
| Mode M0 | |||
|---|---|---|---|
| Quadrant | BADHDUFLAG | Total packets | Discarded packets |
| A | 0 | 71289 | 8 |
| B | 0 | 76122 | 7 |
| C | 0 | 71148 | 7 |
| D | 0 | 82065 | 7 |
| Mode SS | |||
|---|---|---|---|
| Quadrant | BADHDUFLAG | Total packets | Discarded packets |
| A | 0 | 704 | 0 |
| B | 0 | 704 | 0 |
| C | 0 | 704 | 0 |
| D | 0 | 704 | 0 |
| Quadrant | Total seconds | Saturated seconds | Saturation percentage |
|---|---|---|---|
| A | 34471 | 235 | 0.681732% |
| B | 34471 | 502 | 1.456297% |
| C | 34471 | 220 | 0.638218% |
| D | 34471 | 314 | 0.910911% |
Noise dominated data is calculated using 1-second bins in cleaned event files. If a bin has >2000 counts, and if more than 50% of those come from <1% of pixels, then it is considered to be noise-dominated and hence unusable.
| Quadrant | # 1 sec bins | Bins with >0 counts | Bins with >2000 counts | High rate bins dominated by noise | Noise dominated (total time) | Noise dominated (detector-on time) | Marked lightcurve |
|---|---|---|---|---|---|---|---|
| A | 39103 | 34478 | 4 | 4 | 0.01% | 0.01% | 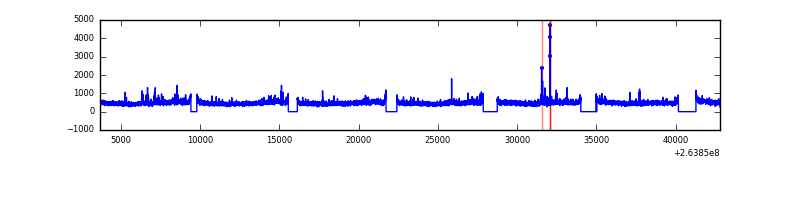 |
| B | 39103 | 34479 | 114 | 114 | 0.29% | 0.33% | 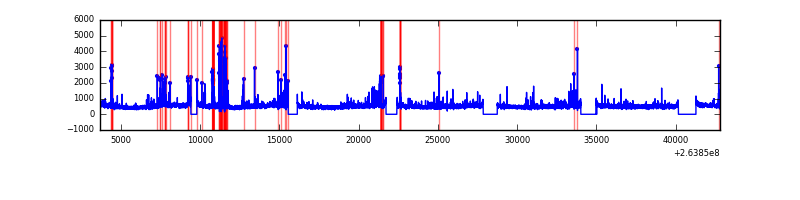 |
| C | 39103 | 34479 | 5 | 5 | 0.01% | 0.01% | 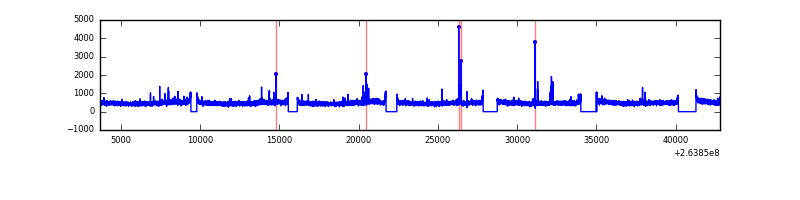 |
| D | 39103 | 34478 | 76 | 76 | 0.19% | 0.22% | 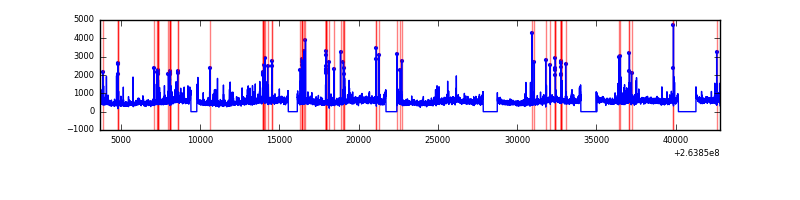 |
Top three noisy pixels from each quadrant. If the there are fewer than three noisy pixels in the level2.evt file, extra rows are filled as -1
| Pixel properties | Quadrant properties | ||||||
|---|---|---|---|---|---|---|---|
| Quadrant | DetID | PixID | Counts | Sigma | Mean | Median | Sigma |
| A | 12 | 189 | 268819 | 312.16 | 4217 | 4132 | 847.9 |
| A | 15 | 222 | 79944 | 89.41 | 4217 | 4132 | 847.9 |
| A | 0 | 226 | 37011 | 38.78 | 4217 | 4132 | 847.9 |
| B | 0 | 85 | 656279 | 823.07 | 4224 | 4124 | 792.3 |
| B | 0 | 219 | 482364 | 603.58 | 4224 | 4124 | 792.3 |
| B | 0 | 189 | 220727 | 273.37 | 4224 | 4124 | 792.3 |
| C | 3 | 233 | 634588 | 673.56 | 4086 | 4117 | 936.0 |
| C | 0 | 207 | 123295 | 127.32 | 4086 | 4117 | 936.0 |
| C | 13 | 61 | 29485 | 27.1 | 4086 | 4117 | 936.0 |
| D | 8 | 195 | 2468911 | 2556.86 | 4062 | 3967 | 964.1 |
| D | 7 | 254 | 451976 | 464.71 | 4062 | 3967 | 964.1 |
| D | 2 | 152 | 363944 | 373.4 | 4062 | 3967 | 964.1 |
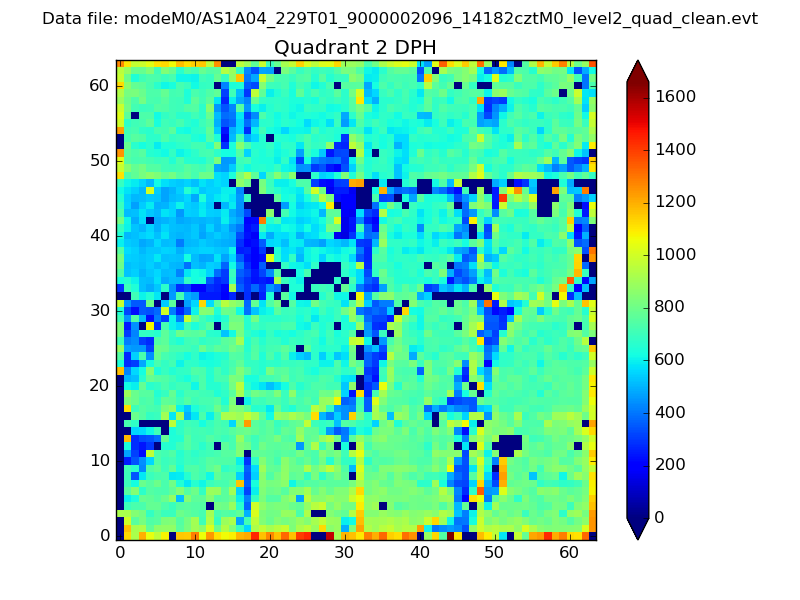
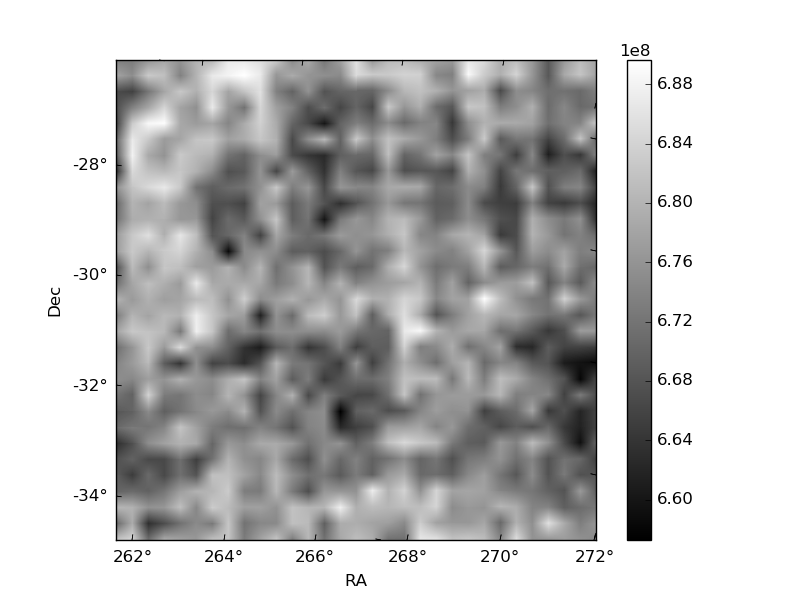
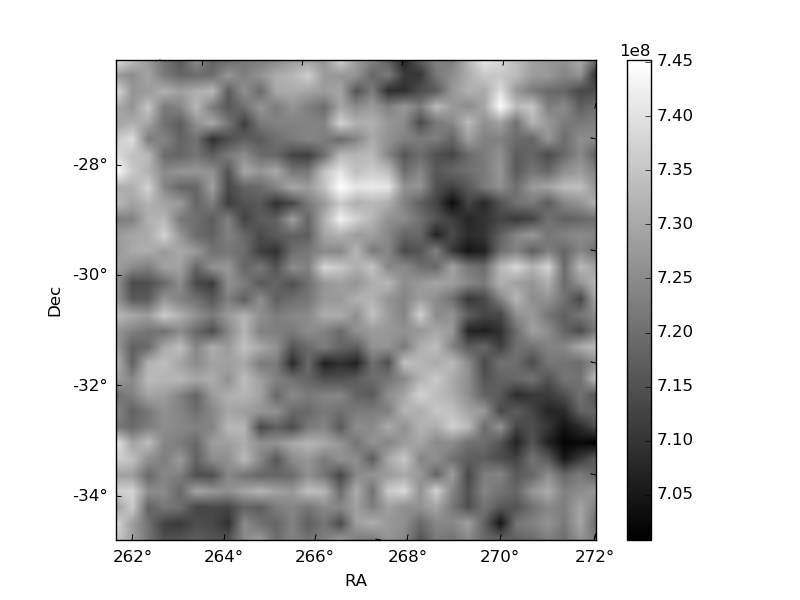
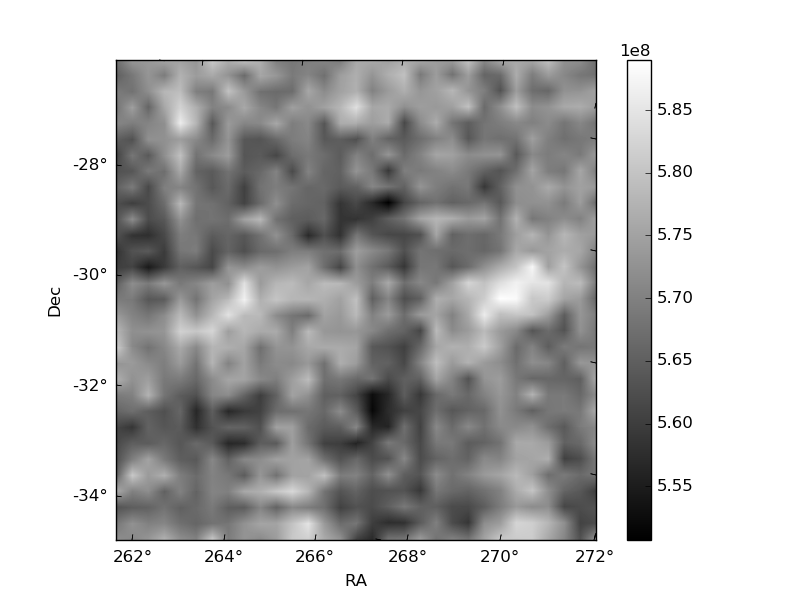
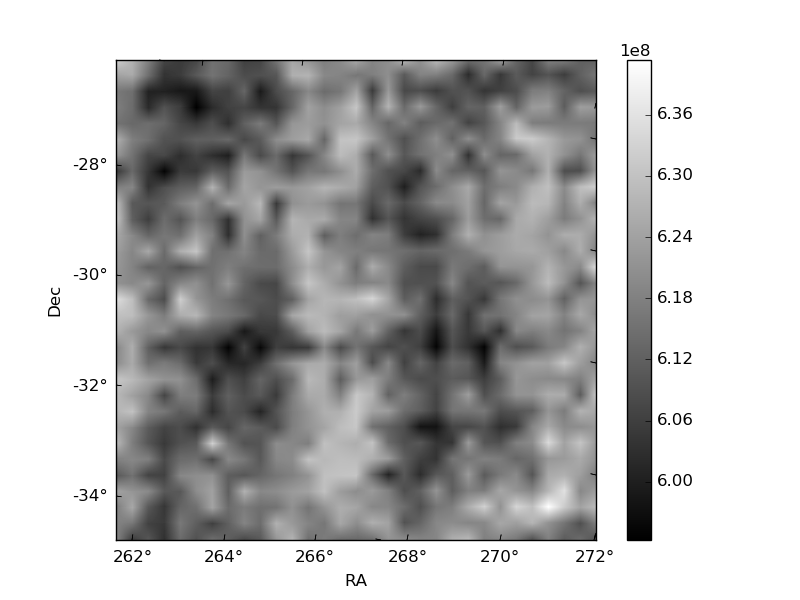
Histogram calculated using DETX and DETY for each event in the final _common_clean file
| Quadrant A | 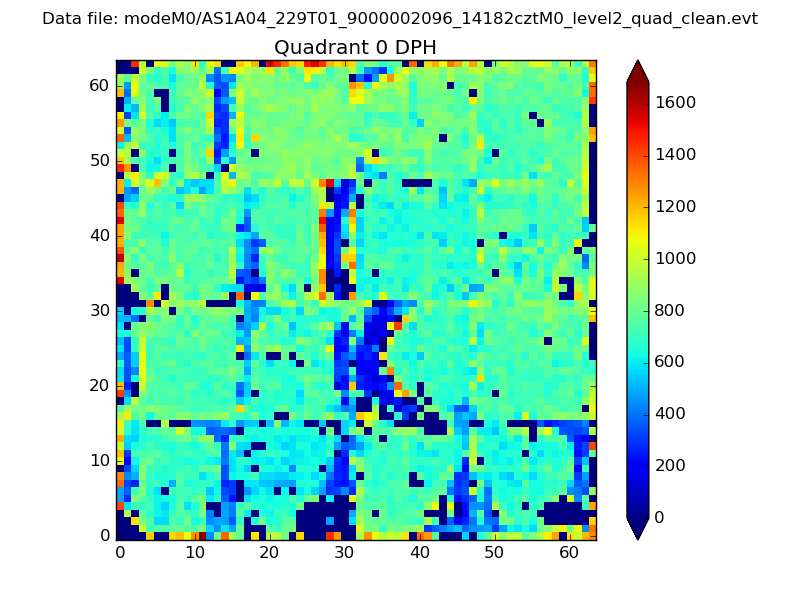 |
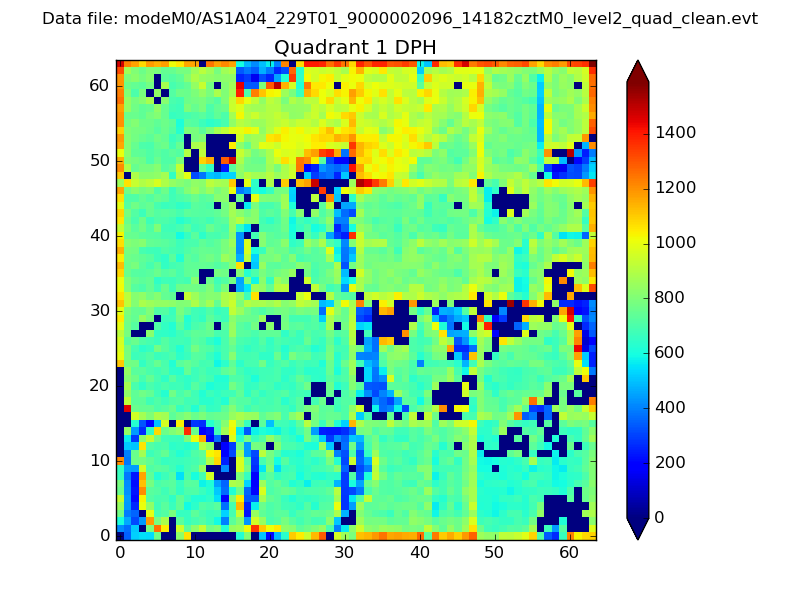 |
Quadrant B |
|---|---|---|---|
| Quadrant D | 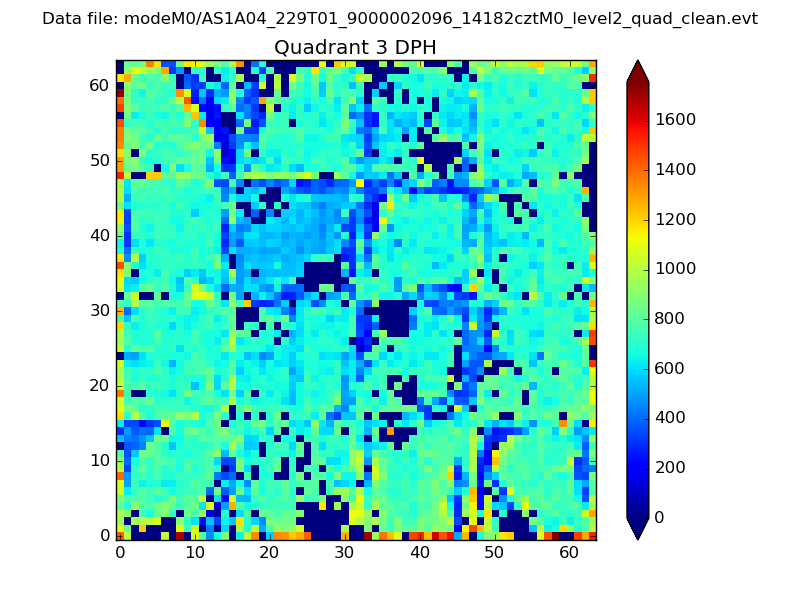 |
 |
Quadrant C |
| Plot type | Count rate plots | Images |
|---|---|---|
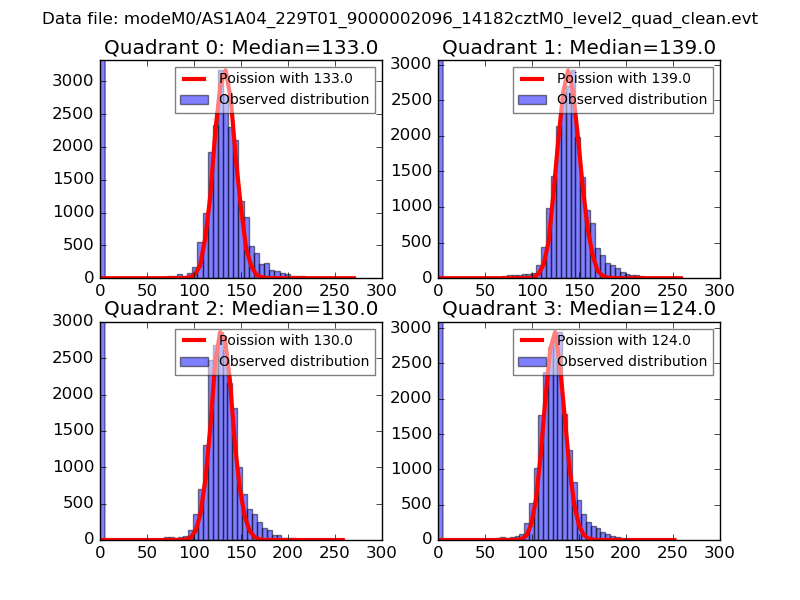
| Comparison with Poisson distribution Blue bars denote a histogram of data divided into 1 sec bins. Red curve is a Poisson curve with rate = median count rate of data. |
 |
 |
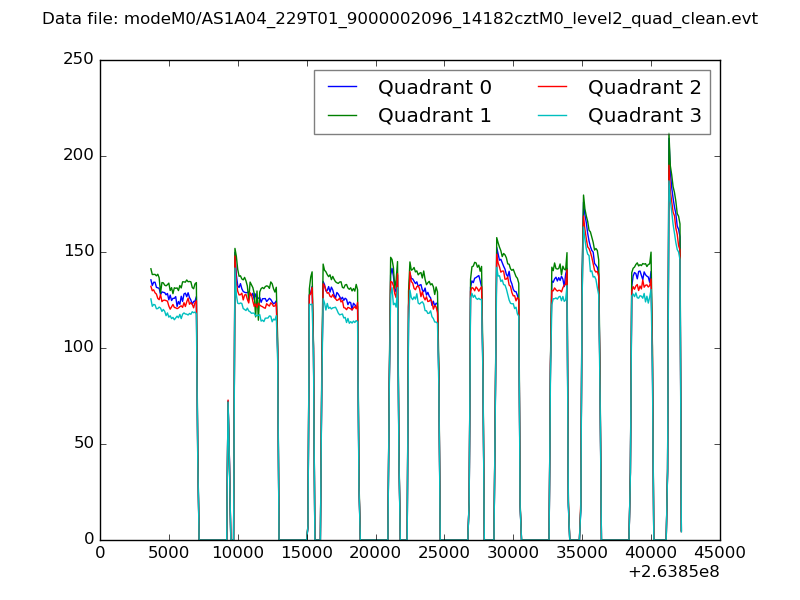
| Quadrant-wise count rates Data is divided into 100 sec bins |
 |
|
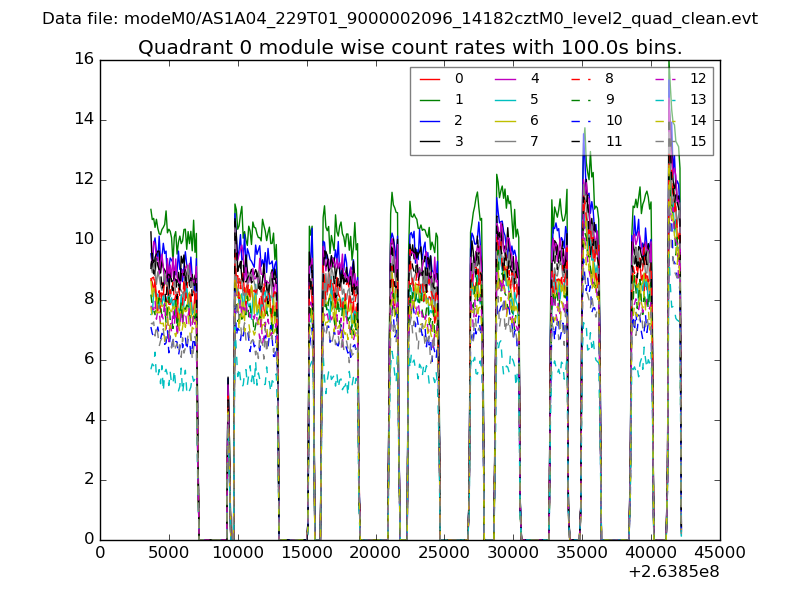
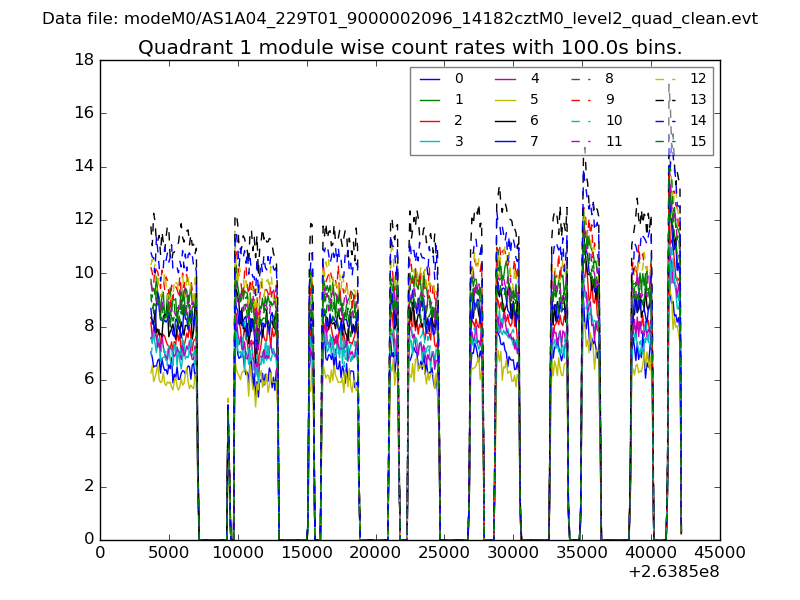
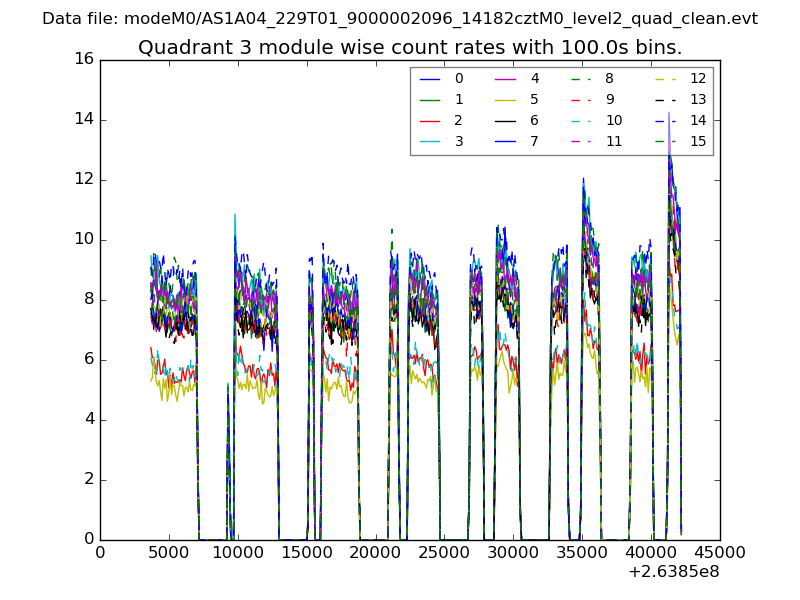
| Module-wise count rates for Quadrant A Data is divided into 100 sec bins |
 |
 |
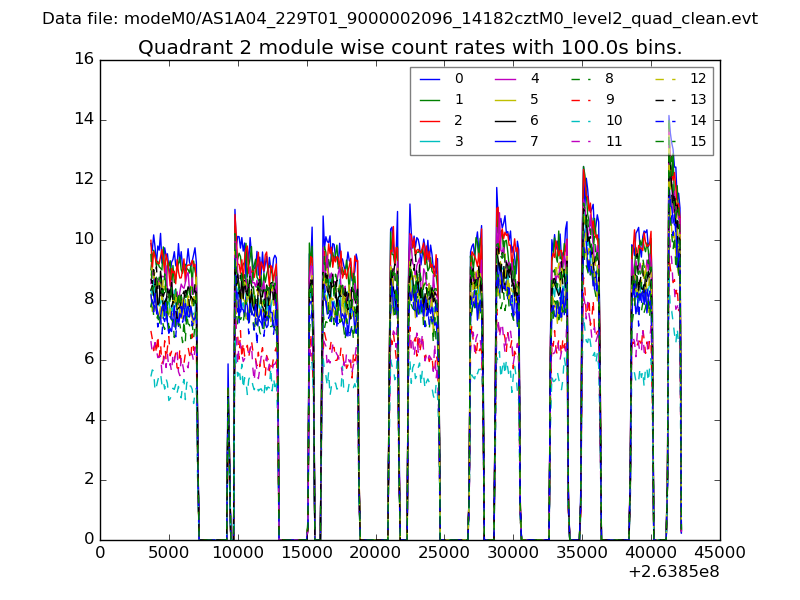
| Module-wise count rates for Quadrant B Data is divided into 100 sec bins |
 |
 |
| Module-wise count rates for Quadrant C Data is divided into 100 sec bins |
 |
 |
| Module-wise count rates for Quadrant D Data is divided into 100 sec bins |
 |
 |
| Parameter | Plot |
|---|---|
| CZT HV Monitor | 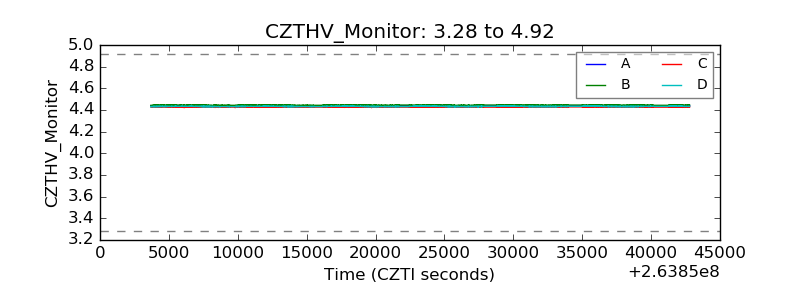 |
| D_VDD | 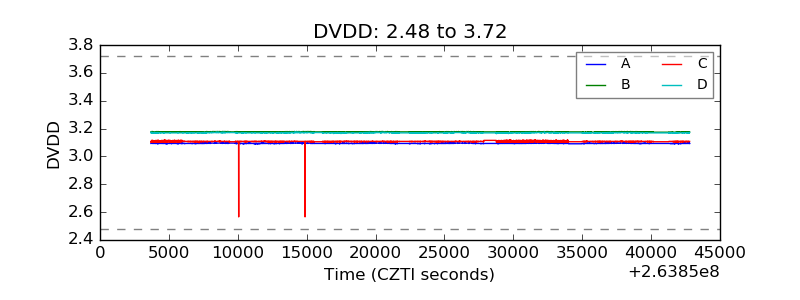 |
| Temperature 1 | 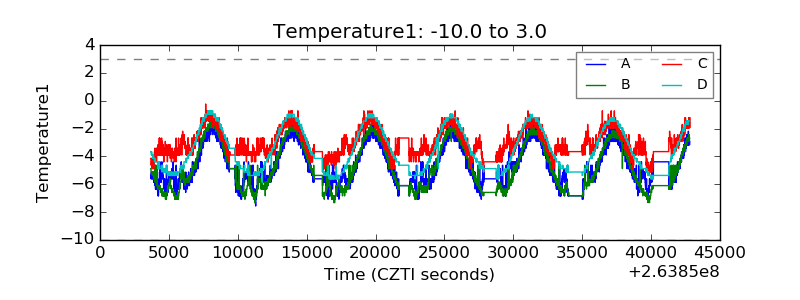 |
| Veto HV Monitor |  |
| Veto LLD | 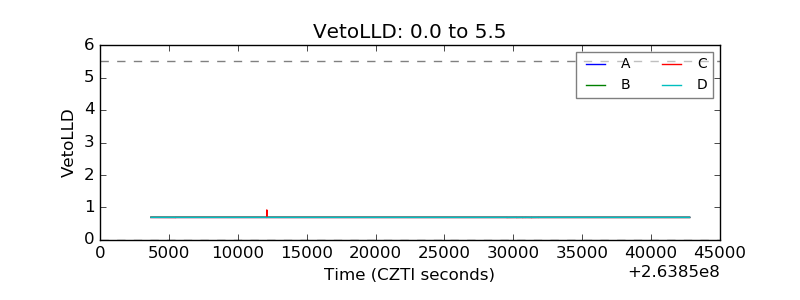 |
| Alpha Counter | 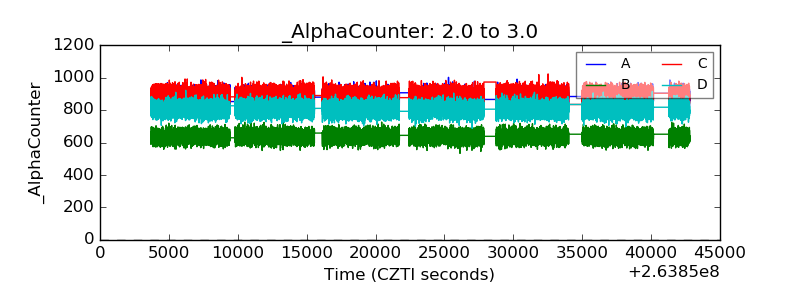 |
| _CPM_Rate | 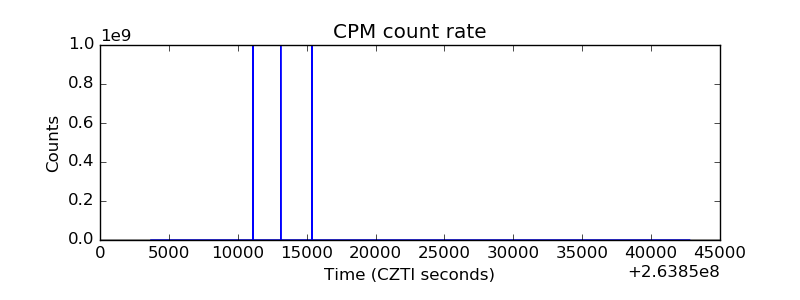 |
| CZT Counter | 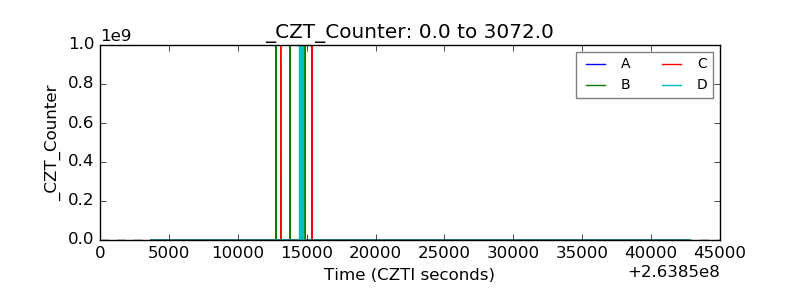 |
| +2.5 Volts monitor |  |
| +5 Volts monitor |  |
| _ROLL_ROT | 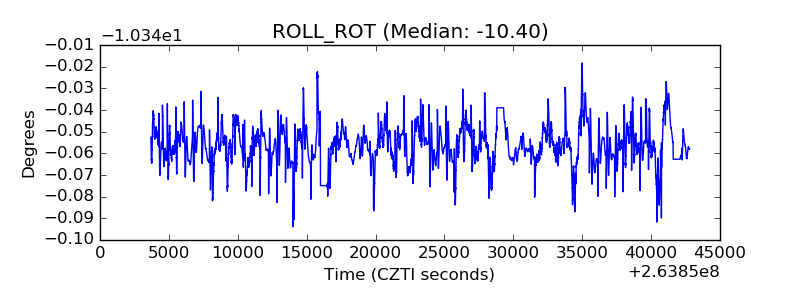 |
| _Roll_DEC | 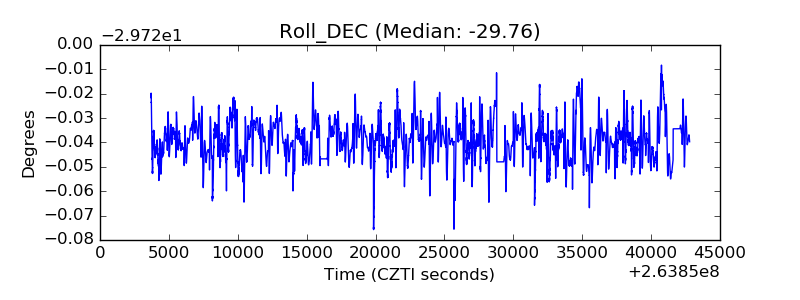 |
| _Roll_RA | 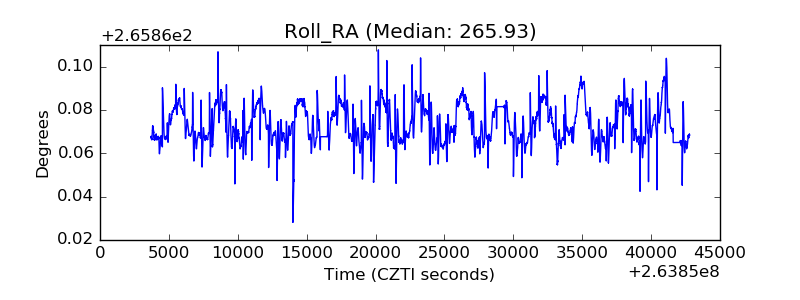 |
| Veto Counter | 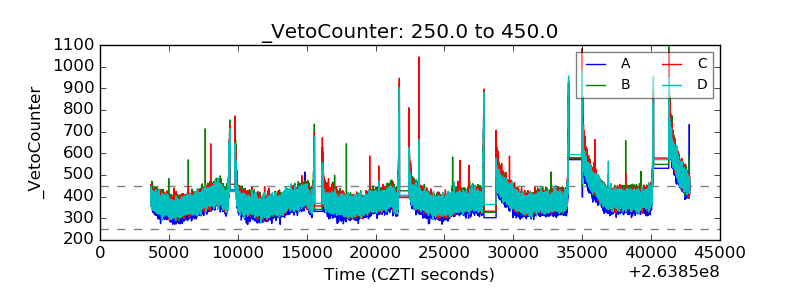 |