| Param | Original file | Final file |
|---|---|---|
| Filename | modeM0/AS1A04_229T01_9000002096_14183cztM0_level2.evt | modeM0/AS1A04_229T01_9000002096_14183cztM0_level2_quad_clean.evt |
| Size (bytes) | 479,255,040 | 76,023,360 |
| Size | 457.1 MB | 72.5 MB |
| Events in quadrant A | 3,251,522 | 474,449 |
| Events in quadrant B | 3,534,032 | 492,392 |
| Events in quadrant C | 3,276,899 | 456,674 |
| Events in quadrant D | 4,022,740 | 437,211 |
| Mode M9 | |||
|---|---|---|---|
| Quadrant | BADHDUFLAG | Total packets | Discarded packets |
| A | 0 | 13 | 0 |
| B | 0 | 13 | 0 |
| C | 0 | 13 | 0 |
| D | 0 | 13 | 0 |
| Mode M0 | |||
|---|---|---|---|
| Quadrant | BADHDUFLAG | Total packets | Discarded packets |
| A | 0 | 13474 | 2 |
| B | 0 | 14276 | 1 |
| C | 0 | 13438 | 1 |
| D | 0 | 16610 | 1 |
| Mode SS | |||
|---|---|---|---|
| Quadrant | BADHDUFLAG | Total packets | Discarded packets |
| A | 0 | 128 | 0 |
| B | 0 | 128 | 0 |
| C | 0 | 128 | 0 |
| D | 0 | 128 | 0 |
| Quadrant | Total seconds | Saturated seconds | Saturation percentage |
|---|---|---|---|
| A | 6325 | 32 | 0.505929% |
| B | 6325 | 44 | 0.695652% |
| C | 6325 | 21 | 0.332016% |
| D | 6325 | 47 | 0.743083% |
Noise dominated data is calculated using 1-second bins in cleaned event files. If a bin has >2000 counts, and if more than 50% of those come from <1% of pixels, then it is considered to be noise-dominated and hence unusable.
| Quadrant | # 1 sec bins | Bins with >0 counts | Bins with >2000 counts | High rate bins dominated by noise | Noise dominated (total time) | Noise dominated (detector-on time) | Marked lightcurve |
|---|---|---|---|---|---|---|---|
| A | 7576 | 6327 | 0 | 0 | 0.00% | 0.00% | 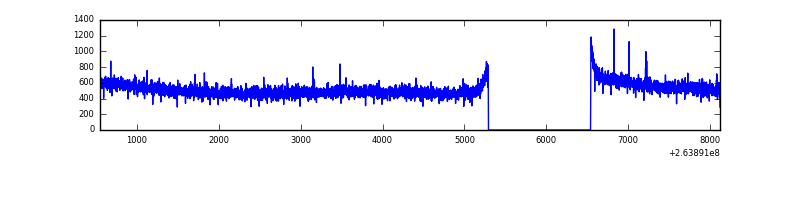 |
| B | 7576 | 6327 | 1 | 1 | 0.01% | 0.02% | 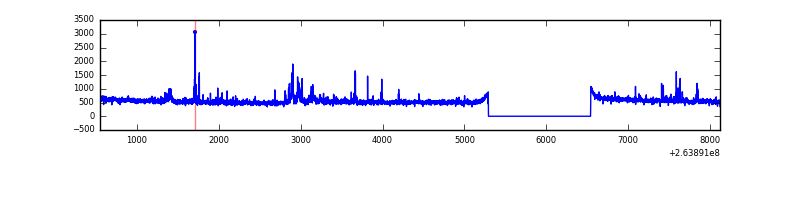 |
| C | 7576 | 6327 | 0 | 0 | 0.00% | 0.00% | 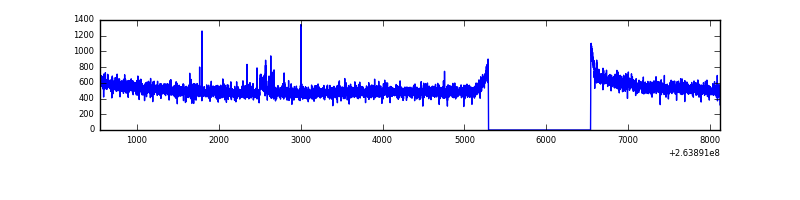 |
| D | 7576 | 6327 | 17 | 17 | 0.22% | 0.27% | 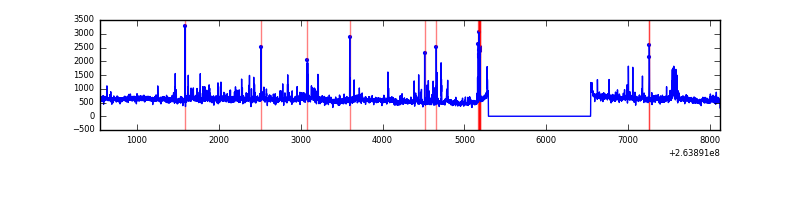 |
Top three noisy pixels from each quadrant. If the there are fewer than three noisy pixels in the level2.evt file, extra rows are filled as -1
| Pixel properties | Quadrant properties | ||||||
|---|---|---|---|---|---|---|---|
| Quadrant | DetID | PixID | Counts | Sigma | Mean | Median | Sigma |
| A | 0 | 226 | 7312 | 38.22 | 841 | 827 | 169.7 |
| A | 12 | 189 | 6978 | 36.25 | 841 | 827 | 169.7 |
| A | 12 | 194 | 6335 | 32.46 | 841 | 827 | 169.7 |
| B | 10 | 244 | 92792 | 589.29 | 833 | 815 | 156.1 |
| B | 0 | 219 | 91292 | 579.68 | 833 | 815 | 156.1 |
| B | 3 | 209 | 30746 | 191.76 | 833 | 815 | 156.1 |
| C | 3 | 233 | 121068 | 654.68 | 804 | 811 | 183.7 |
| C | 10 | 22 | 16531 | 85.58 | 804 | 811 | 183.7 |
| C | 0 | 207 | 6419 | 30.53 | 804 | 811 | 183.7 |
| D | 8 | 195 | 532014 | 2810.89 | 805 | 786 | 189.0 |
| D | 1 | 52 | 124352 | 653.82 | 805 | 786 | 189.0 |
| D | 2 | 152 | 111300 | 584.76 | 805 | 786 | 189.0 |
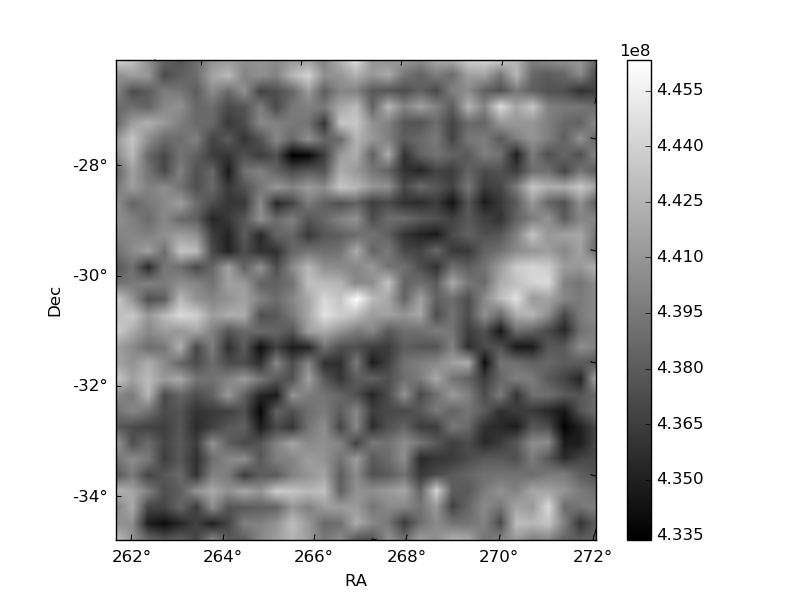
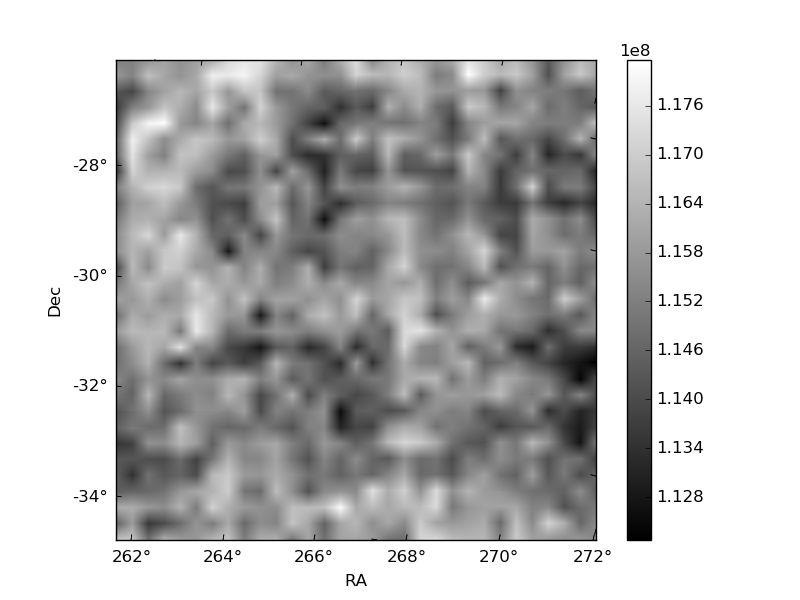
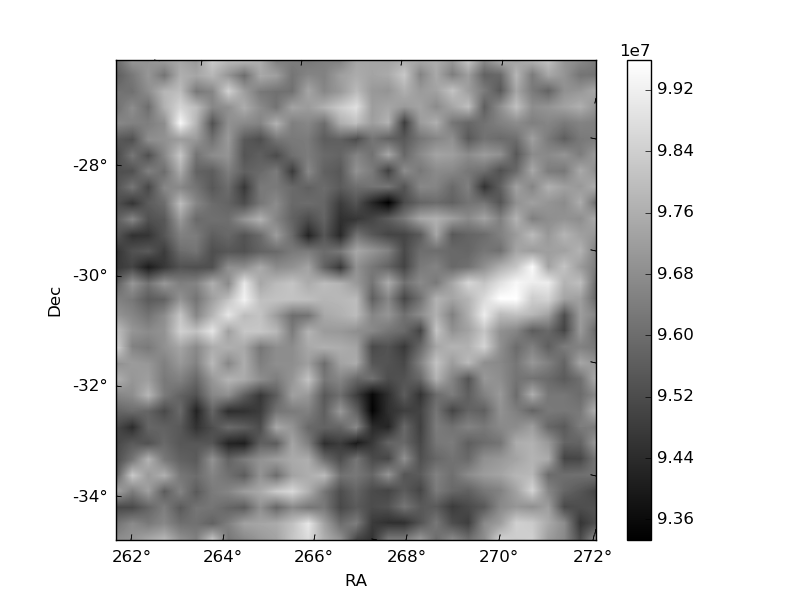
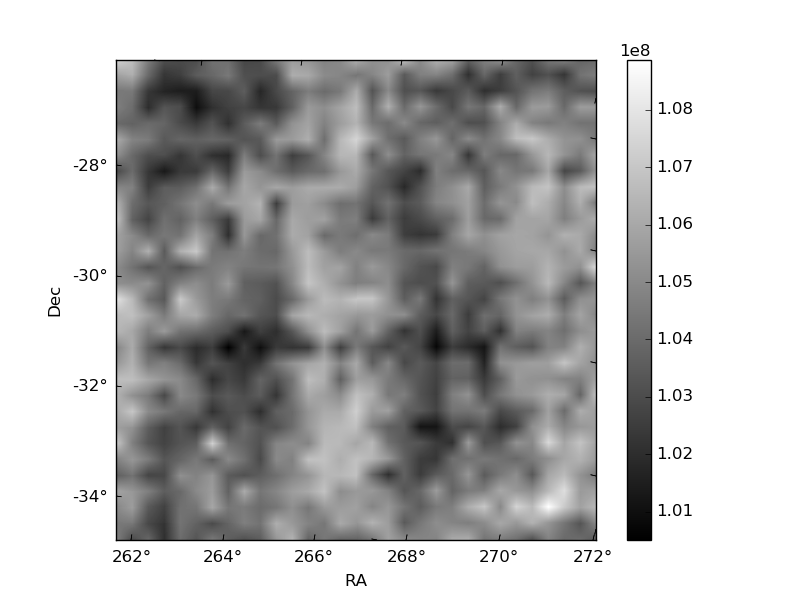
Histogram calculated using DETX and DETY for each event in the final _common_clean file
| Quadrant A | 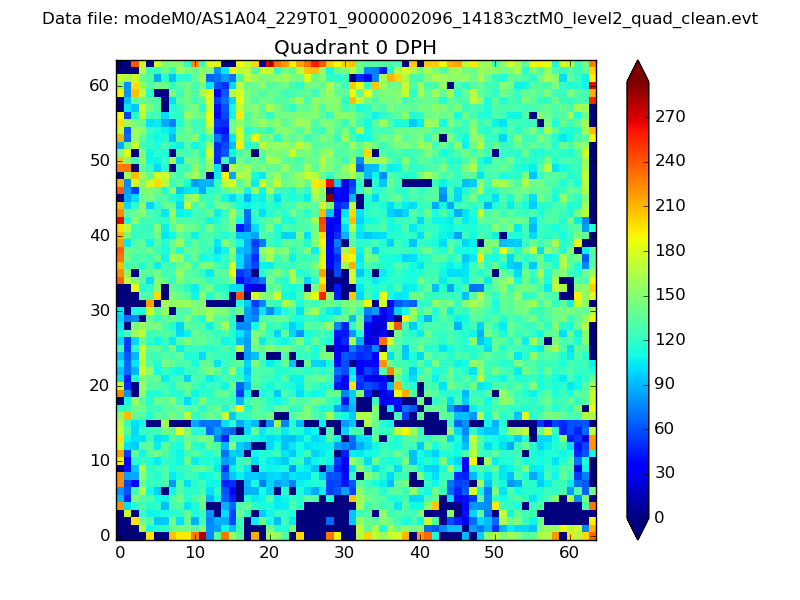 |
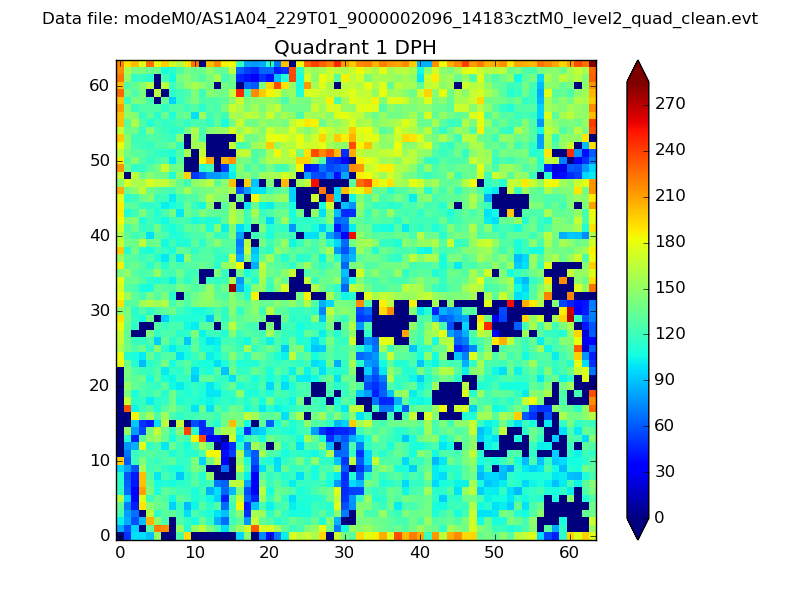 |
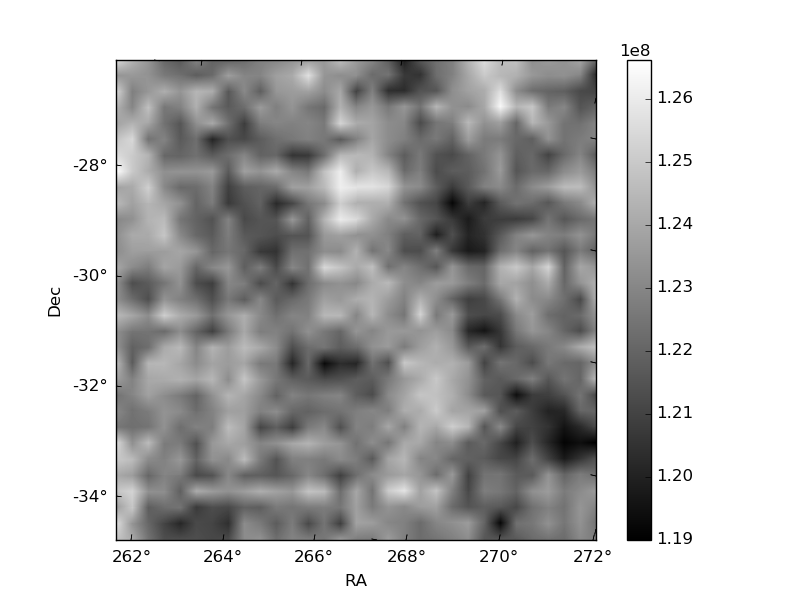
Quadrant B |
|---|---|---|---|
| Quadrant D | 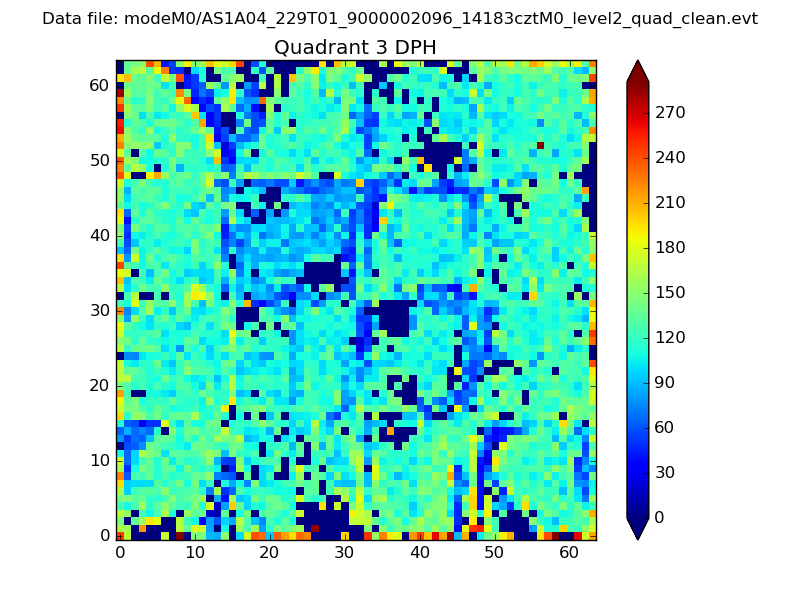 |
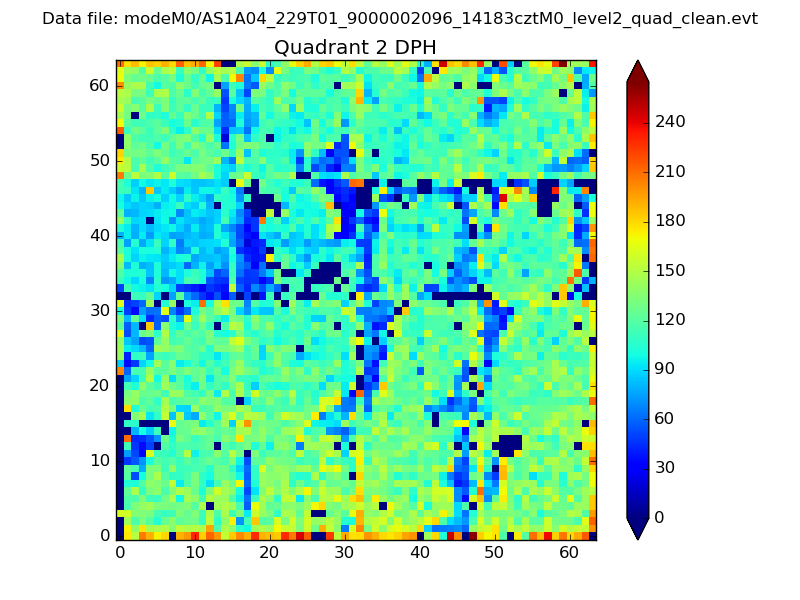 |
Quadrant C |
| Plot type | Count rate plots | Images |
|---|---|---|
| Comparison with Poisson distribution Blue bars denote a histogram of data divided into 1 sec bins. Red curve is a Poisson curve with rate = median count rate of data. |
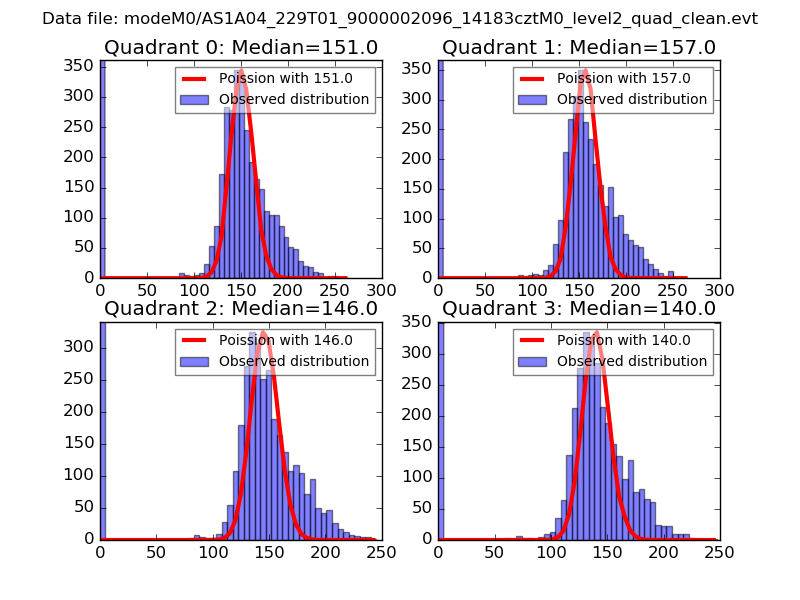 |
 |
| Quadrant-wise count rates Data is divided into 100 sec bins |
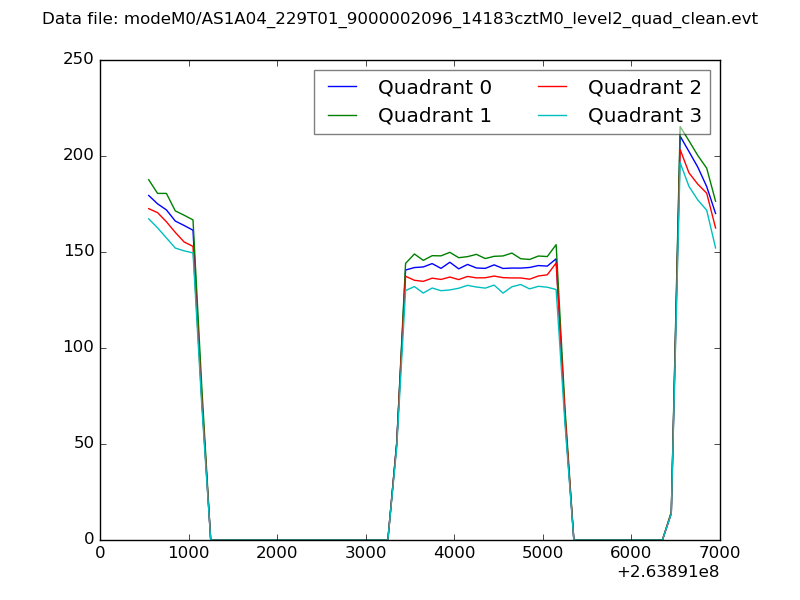 |
|
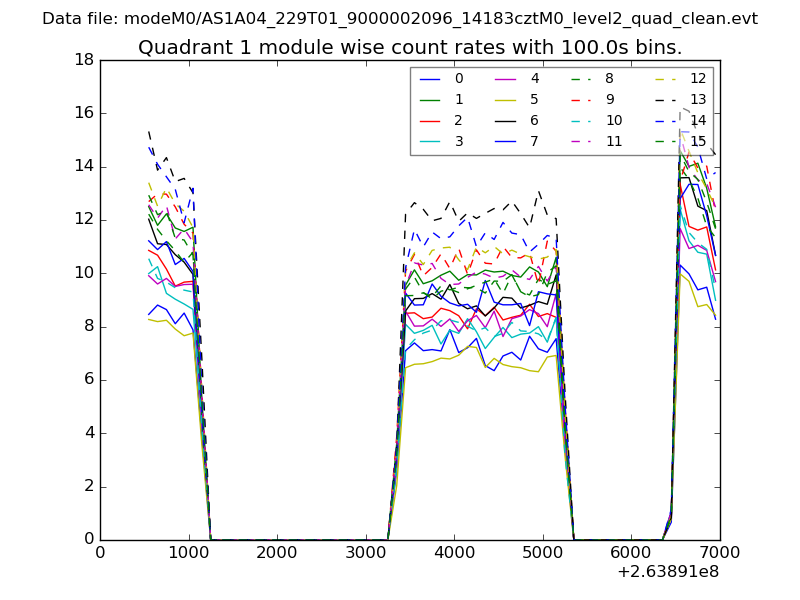
| Module-wise count rates for Quadrant A Data is divided into 100 sec bins |
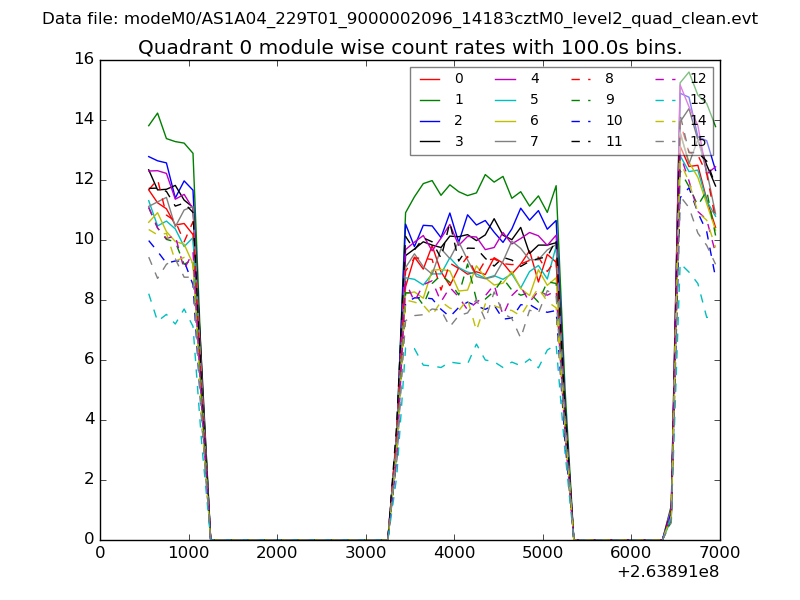 |
 |
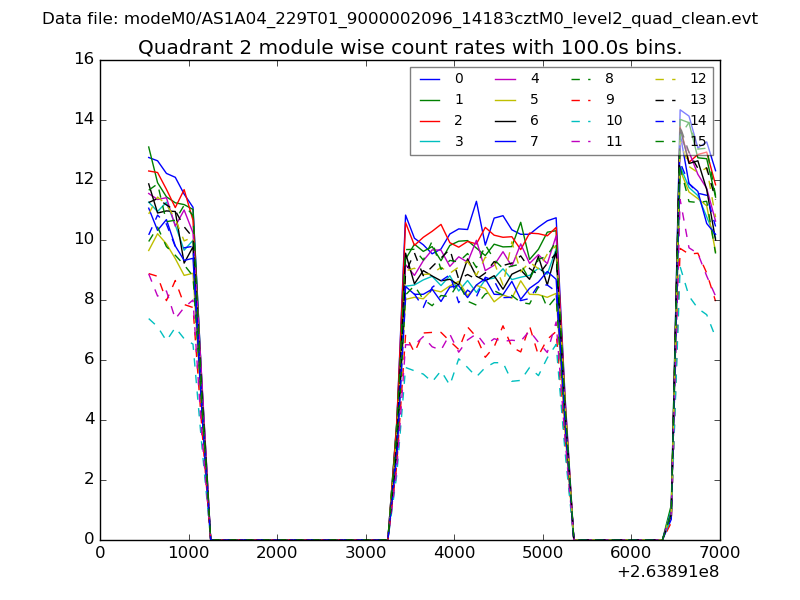
| Module-wise count rates for Quadrant B Data is divided into 100 sec bins |
 |
 |
| Module-wise count rates for Quadrant C Data is divided into 100 sec bins |
 |
 |
| Module-wise count rates for Quadrant D Data is divided into 100 sec bins |
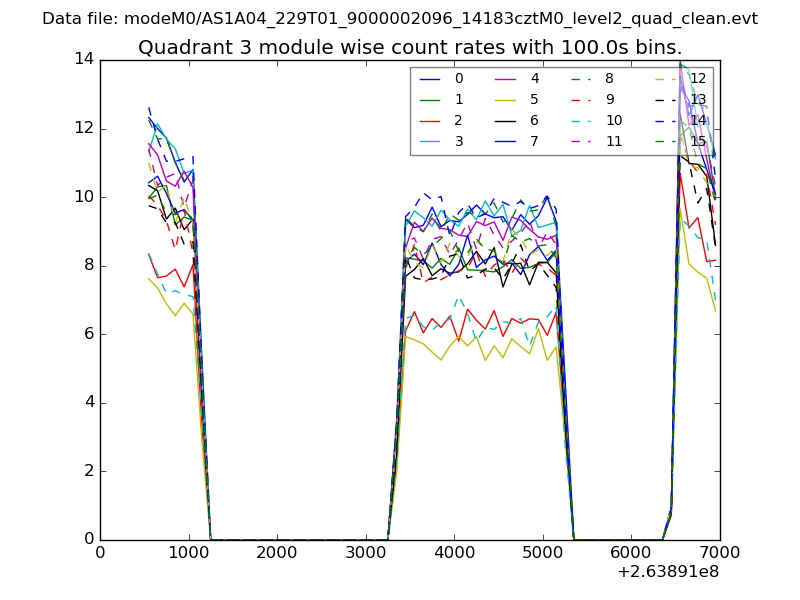 |
 |
| Parameter | Plot |
|---|---|
| CZT HV Monitor | 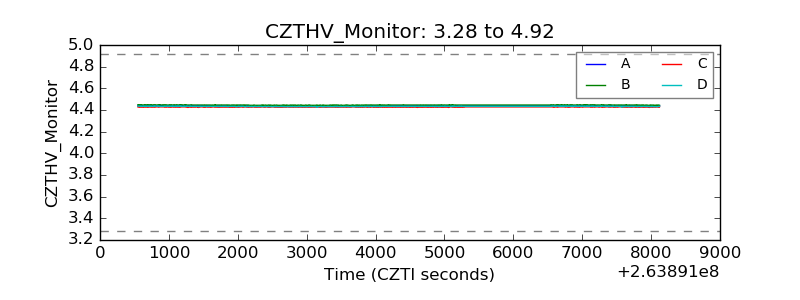 |
| D_VDD | 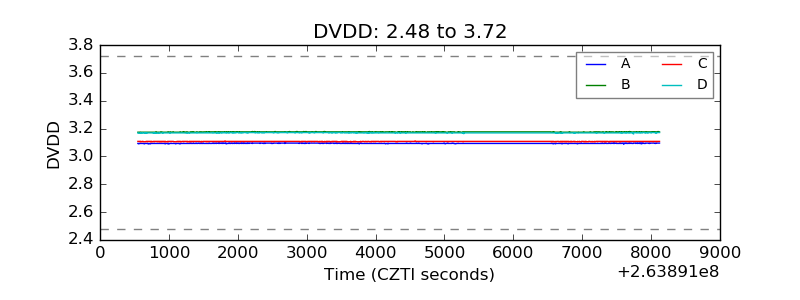 |
| Temperature 1 | 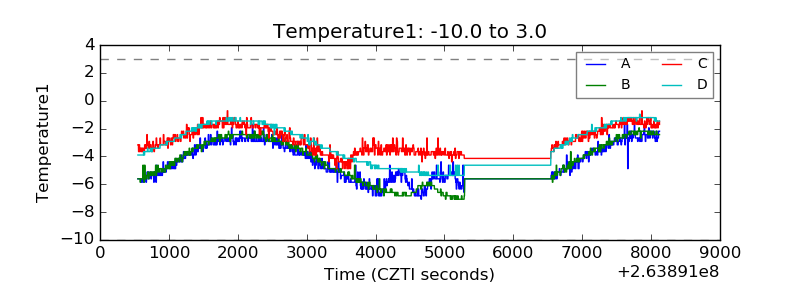 |
| Veto HV Monitor | 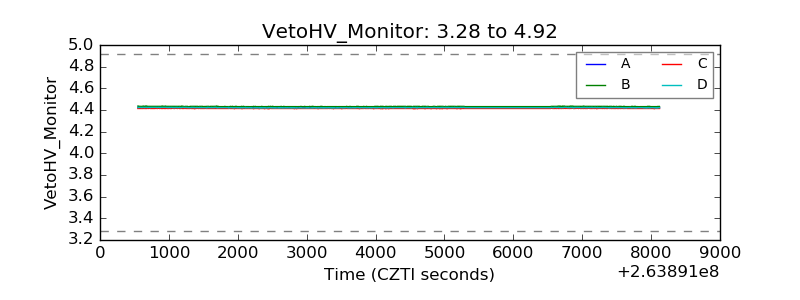 |
| Veto LLD | 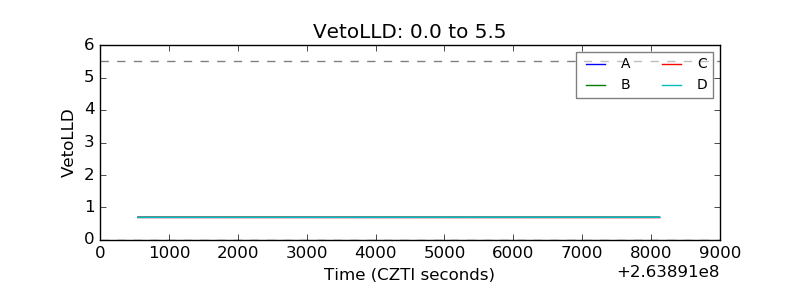 |
| Alpha Counter | 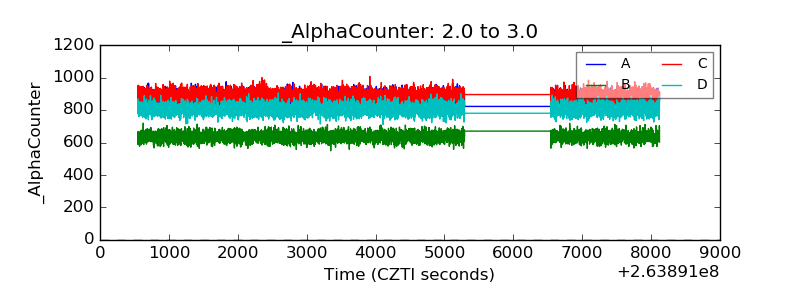 |
| _CPM_Rate | 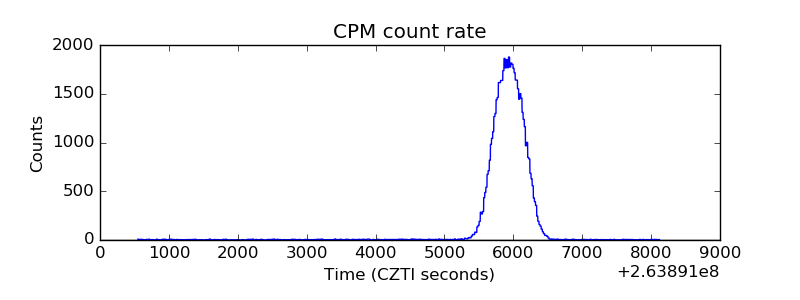 |
| CZT Counter | 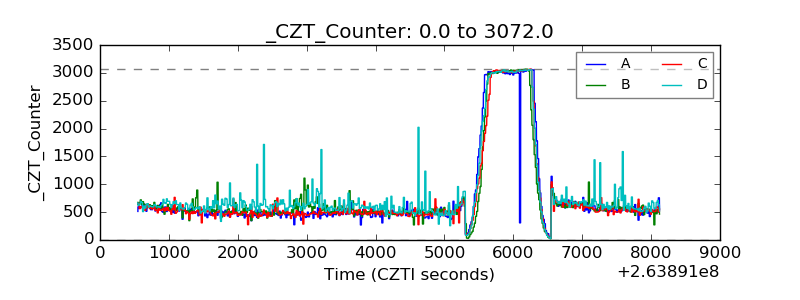 |
| +2.5 Volts monitor |  |
| +5 Volts monitor | 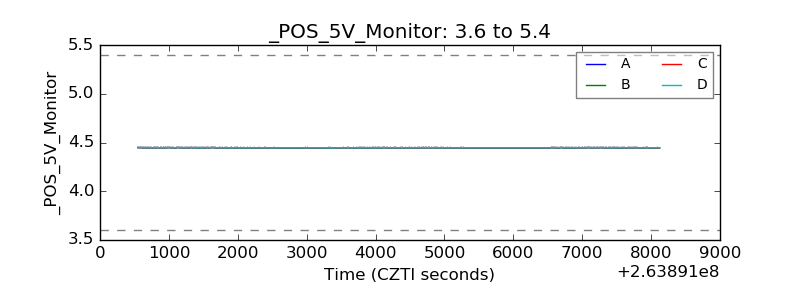 |
| _ROLL_ROT | 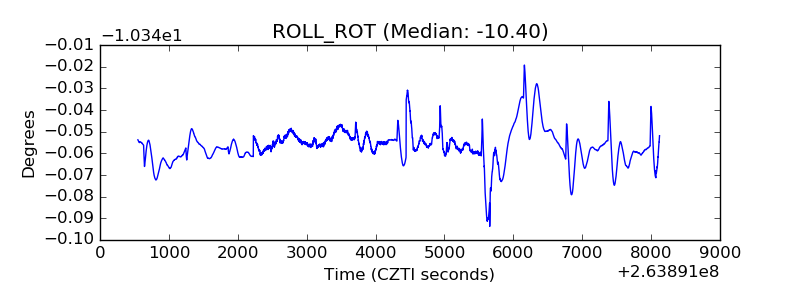 |
| _Roll_DEC | 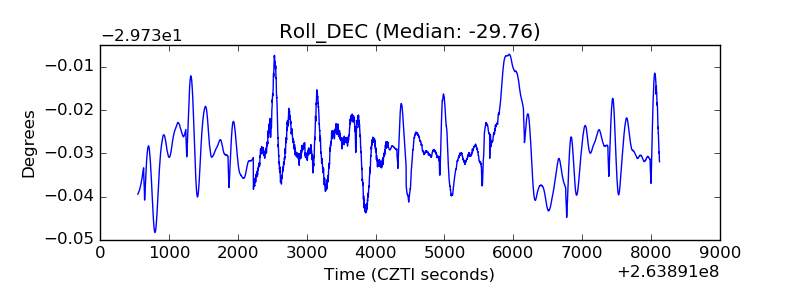 |
| _Roll_RA | 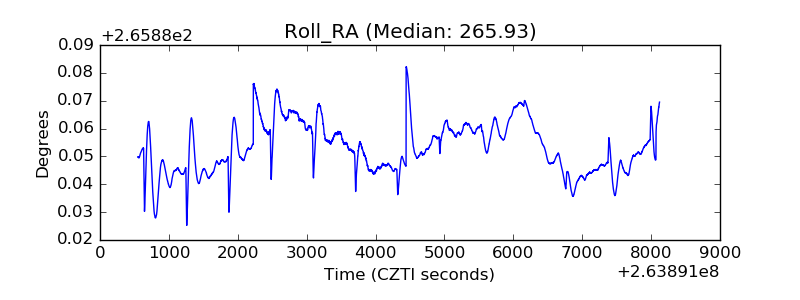 |
| Veto Counter | 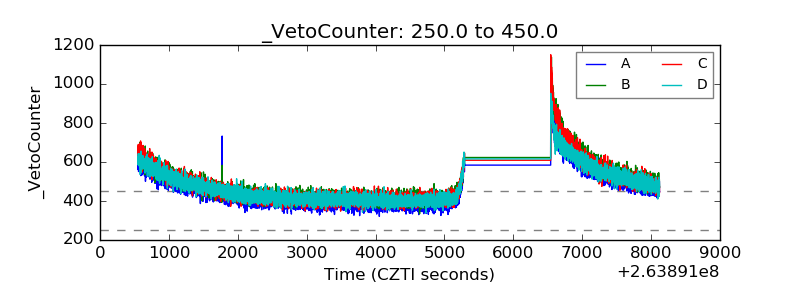 |