| Param | Original file | Final file |
|---|---|---|
| Filename | modeM0/AS1A04_229T01_9000002096_14185cztM0_level2.evt | modeM0/AS1A04_229T01_9000002096_14185cztM0_level2_quad_clean.evt |
| Size (bytes) | 519,540,480 | 67,870,080 |
| Size | 495.5 MB | 64.7 MB |
| Events in quadrant A | 3,472,264 | 408,380 |
| Events in quadrant B | 3,647,942 | 423,737 |
| Events in quadrant C | 3,682,544 | 394,428 |
| Events in quadrant D | 4,490,800 | 375,064 |
| Mode M9 | |||
|---|---|---|---|
| Quadrant | BADHDUFLAG | Total packets | Discarded packets |
| A | 0 | 17 | 0 |
| B | 0 | 17 | 0 |
| C | 0 | 17 | 0 |
| D | 0 | 18 | 0 |
| Mode M0 | |||
|---|---|---|---|
| Quadrant | BADHDUFLAG | Total packets | Discarded packets |
| A | 0 | 14169 | 3 |
| B | 0 | 14772 | 2 |
| C | 0 | 14831 | 2 |
| D | 0 | 17926 | 2 |
| Mode SS | |||
|---|---|---|---|
| Quadrant | BADHDUFLAG | Total packets | Discarded packets |
| A | 0 | 132 | 0 |
| B | 0 | 132 | 0 |
| C | 0 | 132 | 0 |
| D | 0 | 132 | 0 |
| Quadrant | Total seconds | Saturated seconds | Saturation percentage |
|---|---|---|---|
| A | 6498 | 115 | 1.769775% |
| B | 6498 | 144 | 2.216066% |
| C | 6498 | 147 | 2.262235% |
| D | 6498 | 184 | 2.831641% |
Noise dominated data is calculated using 1-second bins in cleaned event files. If a bin has >2000 counts, and if more than 50% of those come from <1% of pixels, then it is considered to be noise-dominated and hence unusable.
| Quadrant | # 1 sec bins | Bins with >0 counts | Bins with >2000 counts | High rate bins dominated by noise | Noise dominated (total time) | Noise dominated (detector-on time) | Marked lightcurve |
|---|---|---|---|---|---|---|---|
| A | 7789 | 6500 | 3 | 3 | 0.04% | 0.05% | 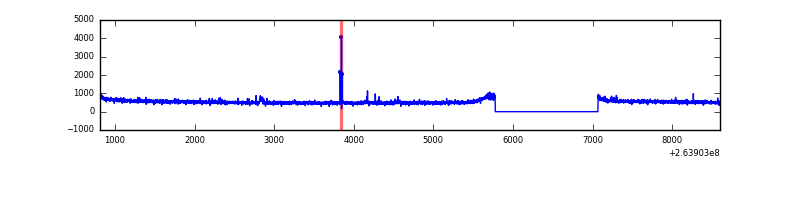 |
| B | 7789 | 6500 | 5 | 5 | 0.06% | 0.08% | 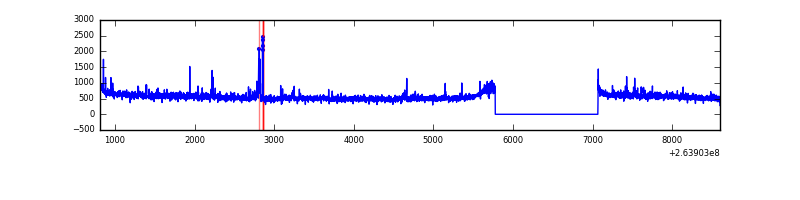 |
| C | 7789 | 6500 | 50 | 50 | 0.64% | 0.77% | 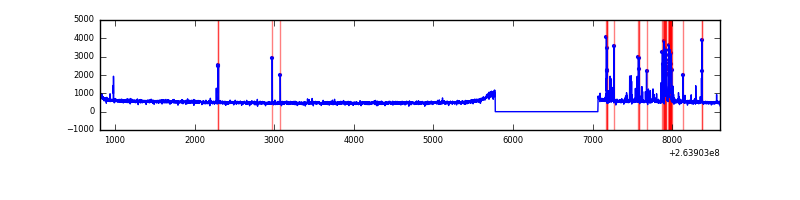 |
| D | 7789 | 6500 | 92 | 92 | 1.18% | 1.42% | 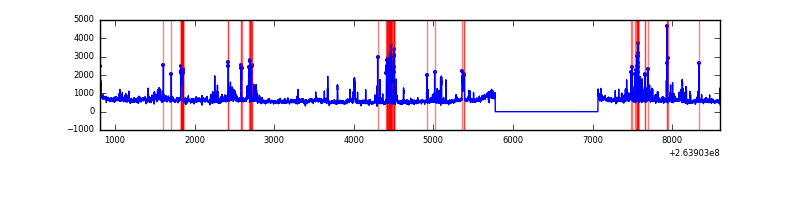 |
Top three noisy pixels from each quadrant. If the there are fewer than three noisy pixels in the level2.evt file, extra rows are filled as -1
| Pixel properties | Quadrant properties | ||||||
|---|---|---|---|---|---|---|---|
| Quadrant | DetID | PixID | Counts | Sigma | Mean | Median | Sigma |
| A | 12 | 189 | 36403 | 199.47 | 888 | 874 | 178.1 |
| A | 9 | 143 | 11296 | 58.51 | 888 | 874 | 178.1 |
| A | 15 | 69 | 11126 | 57.56 | 888 | 874 | 178.1 |
| B | 3 | 209 | 65169 | 392.29 | 885 | 867 | 163.9 |
| B | 4 | 142 | 39924 | 238.28 | 885 | 867 | 163.9 |
| B | 0 | 189 | 35009 | 208.29 | 885 | 867 | 163.9 |
| C | 0 | 207 | 264236 | 1374.41 | 842 | 848 | 191.6 |
| C | 3 | 233 | 112683 | 583.57 | 842 | 848 | 191.6 |
| C | 14 | 234 | 18997 | 94.7 | 842 | 848 | 191.6 |
| D | 8 | 195 | 483166 | 2433.8 | 843 | 825 | 198.2 |
| D | 10 | 157 | 338833 | 1705.52 | 843 | 825 | 198.2 |
| D | 2 | 152 | 108943 | 545.54 | 843 | 825 | 198.2 |
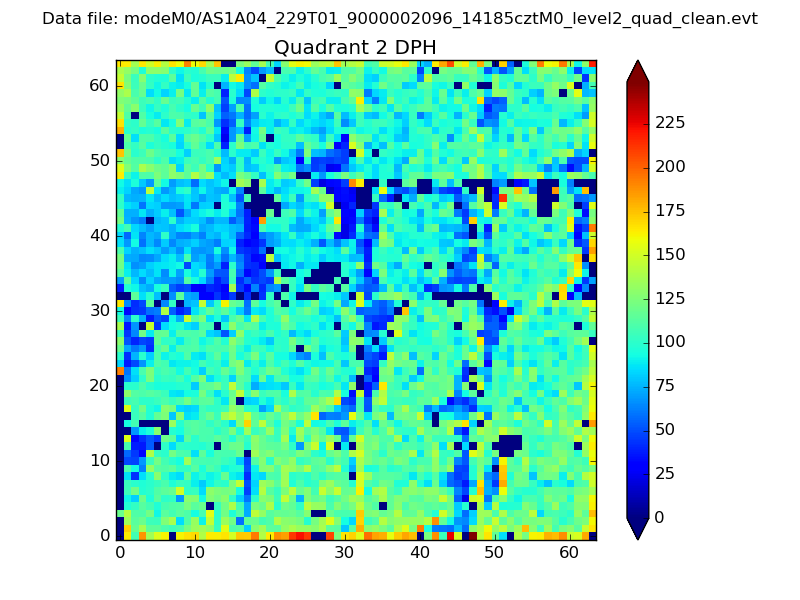
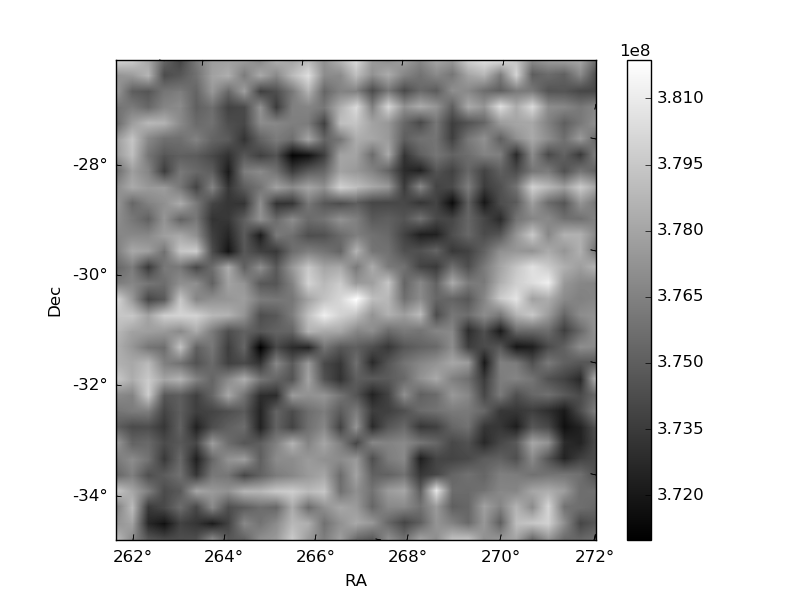
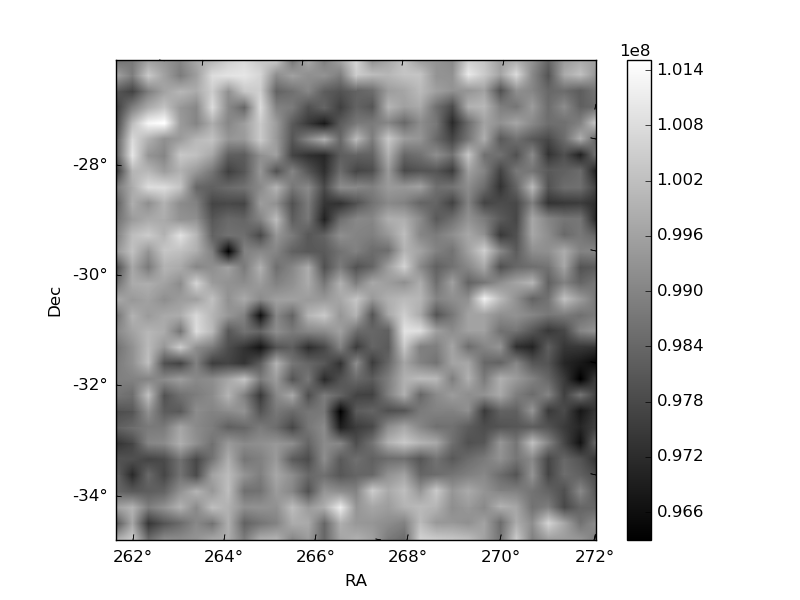
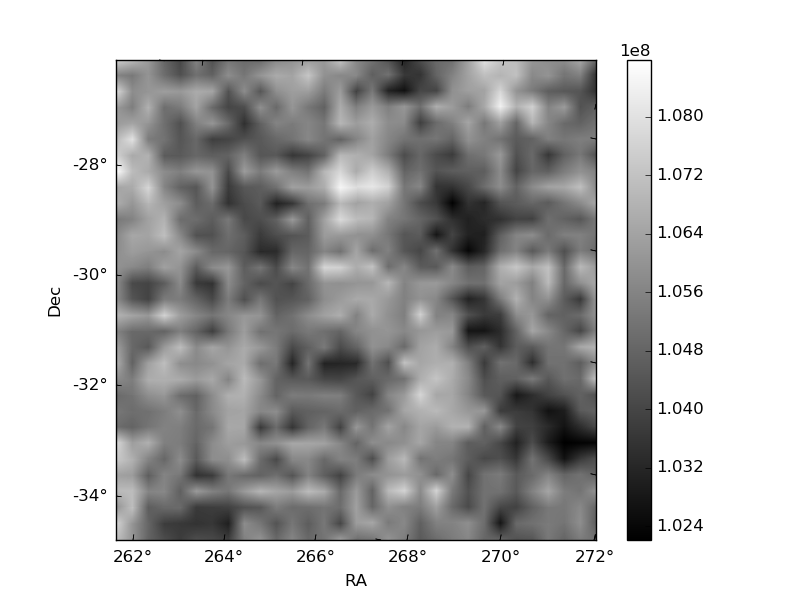
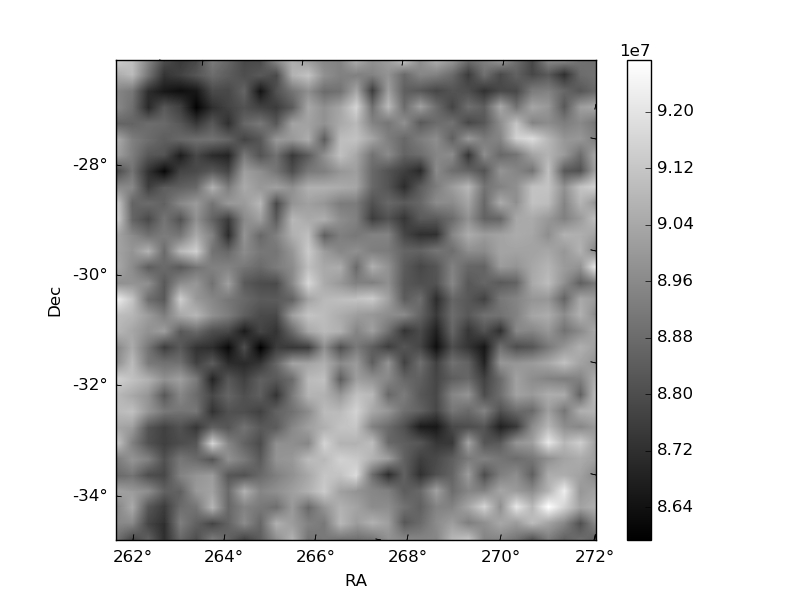
Histogram calculated using DETX and DETY for each event in the final _common_clean file
| Quadrant A | 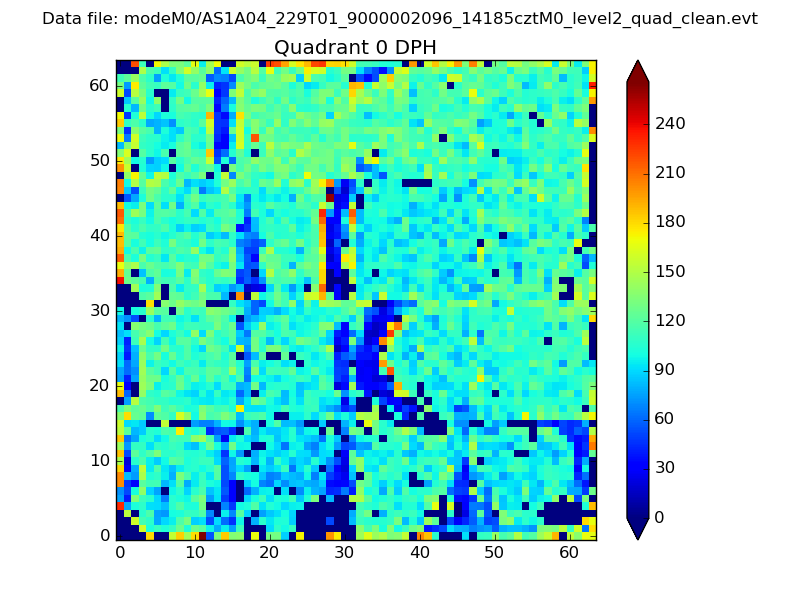 |
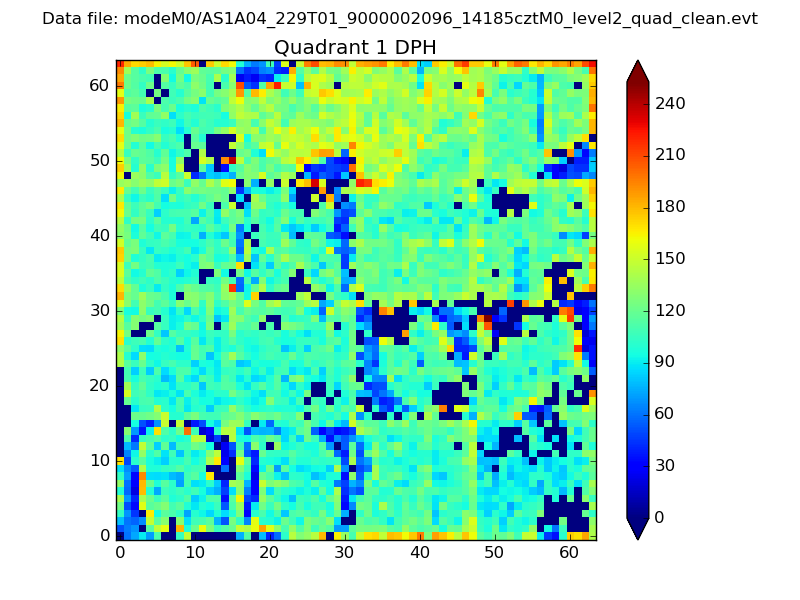 |
Quadrant B |
|---|---|---|---|
| Quadrant D | 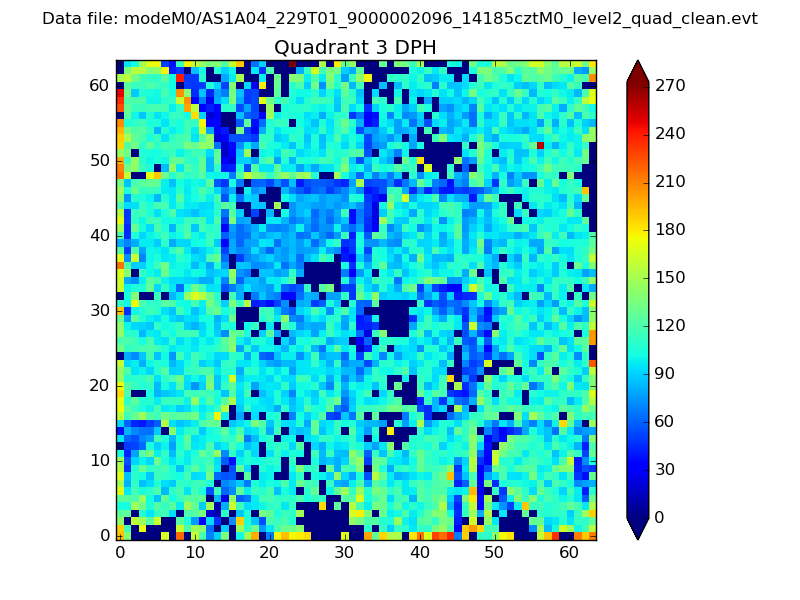 |
 |
Quadrant C |
| Plot type | Count rate plots | Images |
|---|---|---|
| Comparison with Poisson distribution Blue bars denote a histogram of data divided into 1 sec bins. Red curve is a Poisson curve with rate = median count rate of data. |
 |
 |
| Quadrant-wise count rates Data is divided into 100 sec bins |
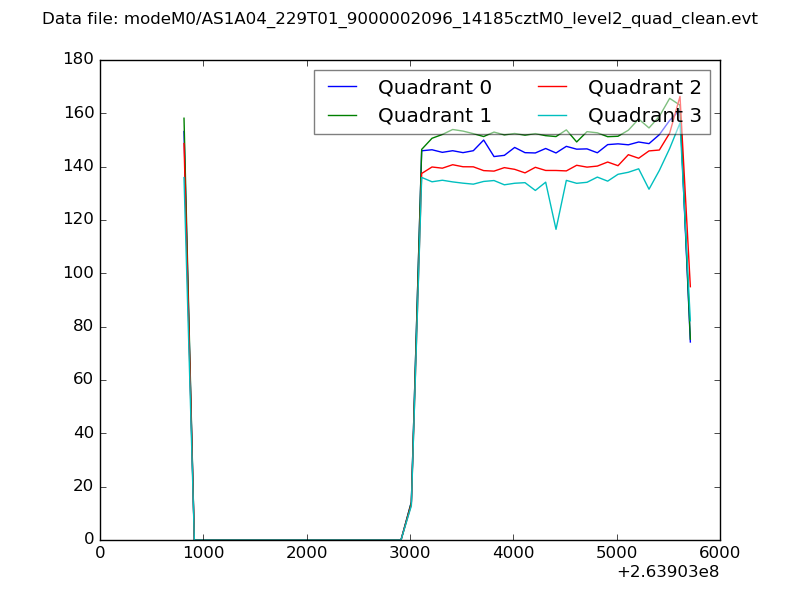 |
|
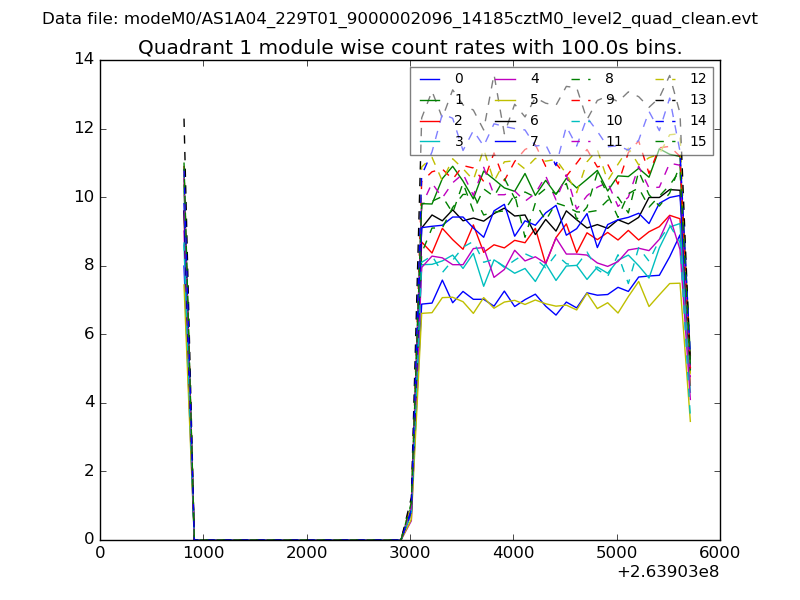
| Module-wise count rates for Quadrant A Data is divided into 100 sec bins |
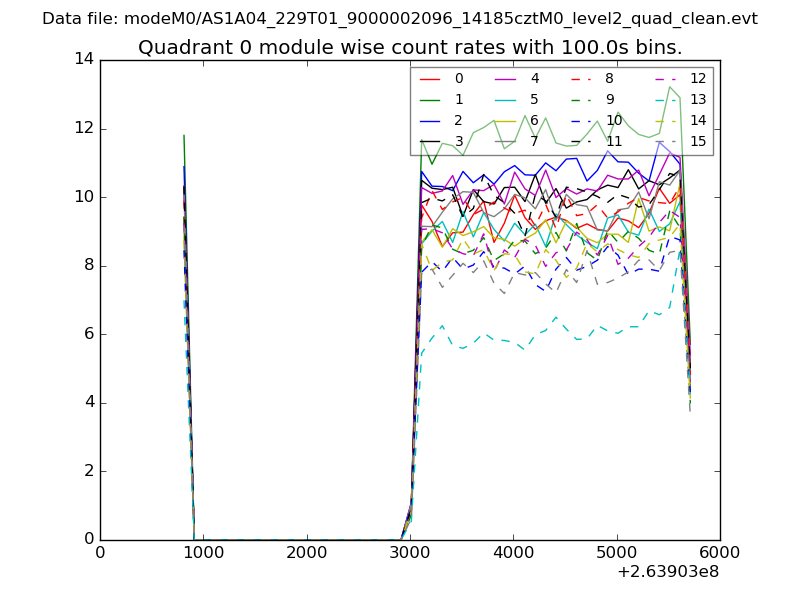 |
 |
| Module-wise count rates for Quadrant B Data is divided into 100 sec bins |
 |
 |
| Module-wise count rates for Quadrant C Data is divided into 100 sec bins |
 |
 |
| Module-wise count rates for Quadrant D Data is divided into 100 sec bins |
 |
 |
| Parameter | Plot |
|---|---|
| CZT HV Monitor |  |
| D_VDD | 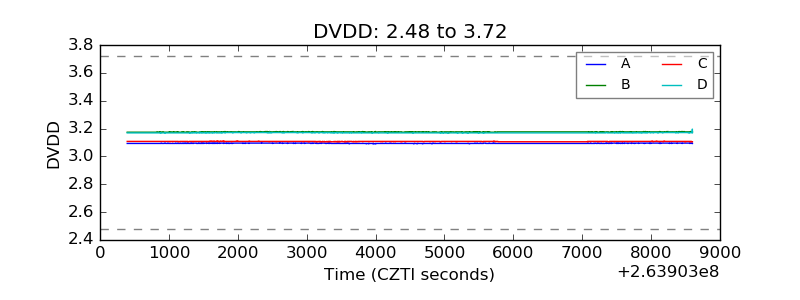 |
| Temperature 1 | 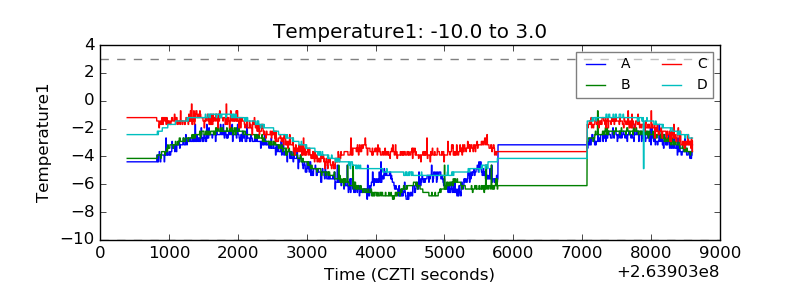 |
| Veto HV Monitor | 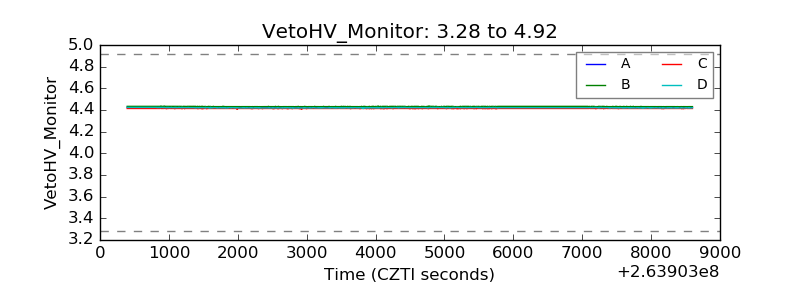 |
| Veto LLD |  |
| Alpha Counter | 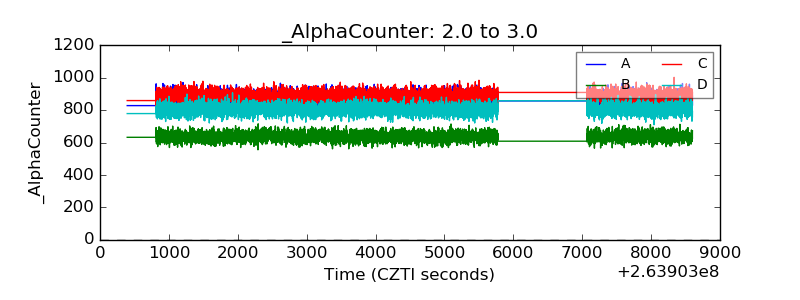 |
| _CPM_Rate | 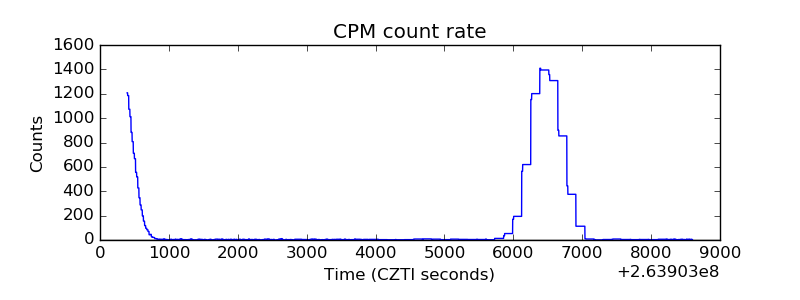 |
| CZT Counter | 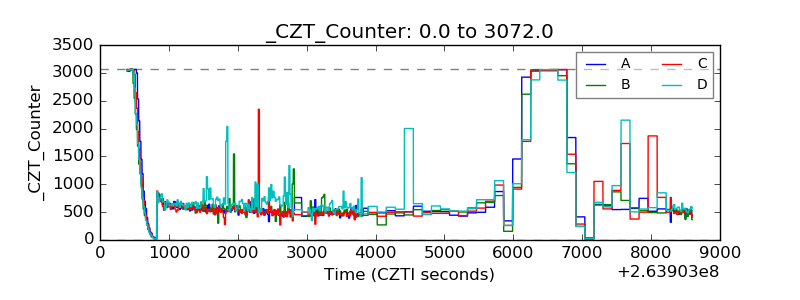 |
| +2.5 Volts monitor |  |
| +5 Volts monitor |  |
| _ROLL_ROT | 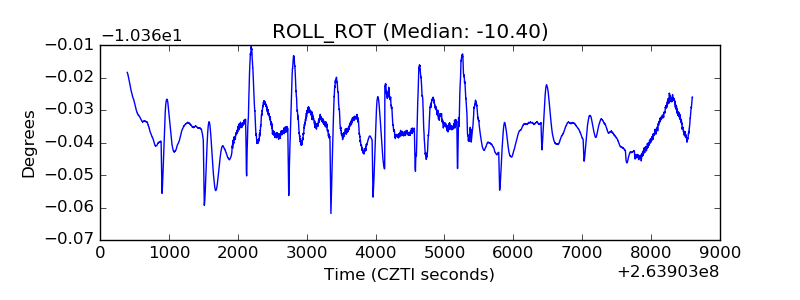 |
| _Roll_DEC | 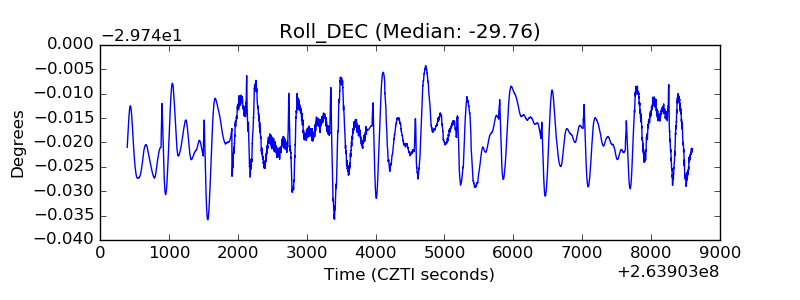 |
| _Roll_RA | 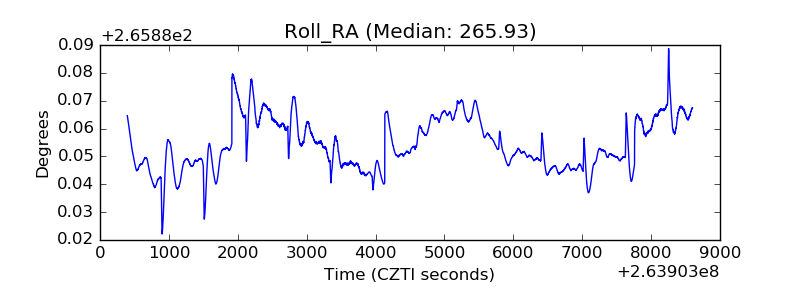 |
| Veto Counter |  |