| Param | Original file | Final file |
|---|---|---|
| Filename | modeM0/AS1A04_229T01_9000002096_14187cztM0_level2.evt | modeM0/AS1A04_229T01_9000002096_14187cztM0_level2_quad_clean.evt |
| Size (bytes) | 480,191,040 | 83,430,720 |
| Size | 457.9 MB | 79.6 MB |
| Events in quadrant A | 3,327,064 | 527,627 |
| Events in quadrant B | 3,538,556 | 547,725 |
| Events in quadrant C | 3,418,147 | 505,183 |
| Events in quadrant D | 3,809,922 | 484,973 |
| Mode M9 | |||
|---|---|---|---|
| Quadrant | BADHDUFLAG | Total packets | Discarded packets |
| A | 0 | 13 | 0 |
| B | 0 | 13 | 0 |
| C | 0 | 13 | 0 |
| D | 0 | 14 | 0 |
| Mode M0 | |||
|---|---|---|---|
| Quadrant | BADHDUFLAG | Total packets | Discarded packets |
| A | 0 | 14028 | 3 |
| B | 0 | 14480 | 2 |
| C | 0 | 14099 | 2 |
| D | 0 | 15572 | 2 |
| Mode SS | |||
|---|---|---|---|
| Quadrant | BADHDUFLAG | Total packets | Discarded packets |
| A | 0 | 136 | 0 |
| B | 0 | 136 | 0 |
| C | 0 | 136 | 0 |
| D | 0 | 136 | 0 |
| Quadrant | Total seconds | Saturated seconds | Saturation percentage |
|---|---|---|---|
| A | 6604 | 104 | 1.574803% |
| B | 6604 | 119 | 1.801938% |
| C | 6604 | 63 | 0.953967% |
| D | 6604 | 127 | 1.923077% |
Noise dominated data is calculated using 1-second bins in cleaned event files. If a bin has >2000 counts, and if more than 50% of those come from <1% of pixels, then it is considered to be noise-dominated and hence unusable.
| Quadrant | # 1 sec bins | Bins with >0 counts | Bins with >2000 counts | High rate bins dominated by noise | Noise dominated (total time) | Noise dominated (detector-on time) | Marked lightcurve |
|---|---|---|---|---|---|---|---|
| A | 7525 | 6606 | 5 | 5 | 0.07% | 0.08% | 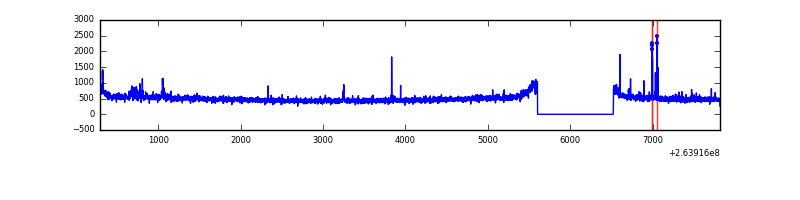 |
| B | 7525 | 6606 | 1 | 1 | 0.01% | 0.02% | 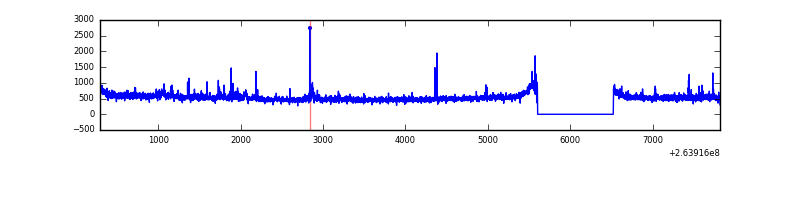 |
| C | 7525 | 6606 | 10 | 10 | 0.13% | 0.15% | 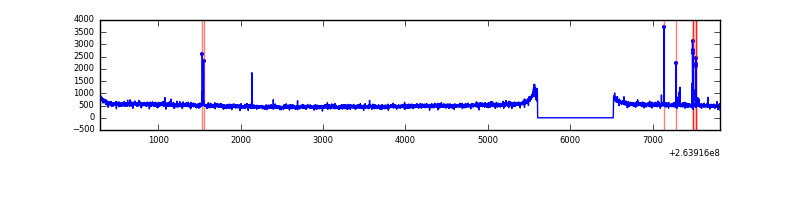 |
| D | 7525 | 6606 | 52 | 52 | 0.69% | 0.79% | 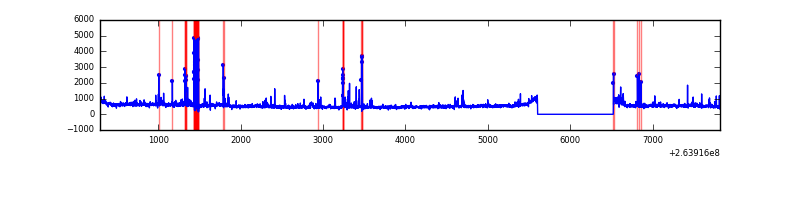 |
Top three noisy pixels from each quadrant. If the there are fewer than three noisy pixels in the level2.evt file, extra rows are filled as -1
| Pixel properties | Quadrant properties | ||||||
|---|---|---|---|---|---|---|---|
| Quadrant | DetID | PixID | Counts | Sigma | Mean | Median | Sigma |
| A | 12 | 189 | 32885 | 186.24 | 842 | 823 | 172.2 |
| A | 15 | 69 | 23104 | 129.43 | 842 | 823 | 172.2 |
| A | 12 | 96 | 15628 | 86.0 | 842 | 823 | 172.2 |
| B | 0 | 219 | 139151 | 863.01 | 844 | 826 | 160.3 |
| B | 3 | 209 | 29330 | 177.84 | 844 | 826 | 160.3 |
| B | 0 | 189 | 27973 | 169.37 | 844 | 826 | 160.3 |
| C | 3 | 233 | 214749 | 1148.93 | 806 | 811 | 186.2 |
| C | 0 | 207 | 52677 | 278.54 | 806 | 811 | 186.2 |
| C | 13 | 61 | 5946 | 27.58 | 806 | 811 | 186.2 |
| D | 8 | 195 | 243794 | 1236.91 | 801 | 783 | 196.5 |
| D | 7 | 254 | 142806 | 722.89 | 801 | 783 | 196.5 |
| D | 10 | 157 | 115730 | 585.07 | 801 | 783 | 196.5 |
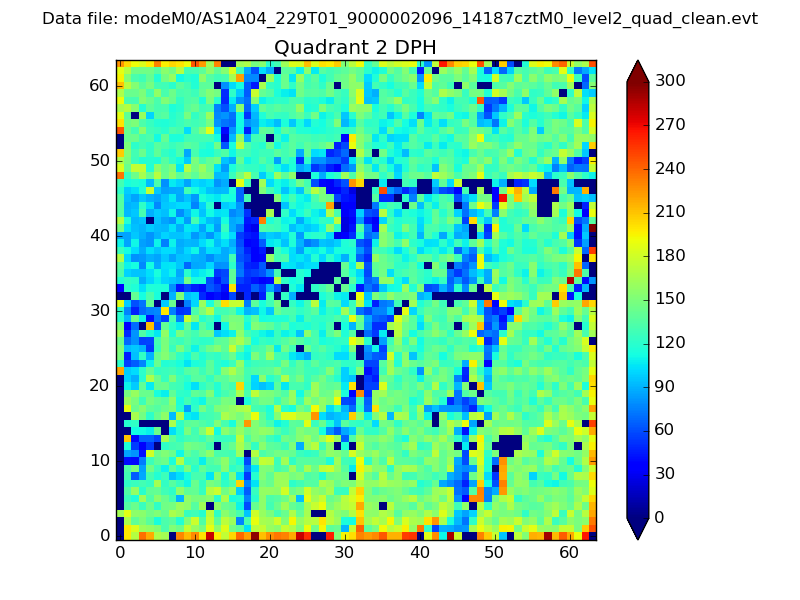
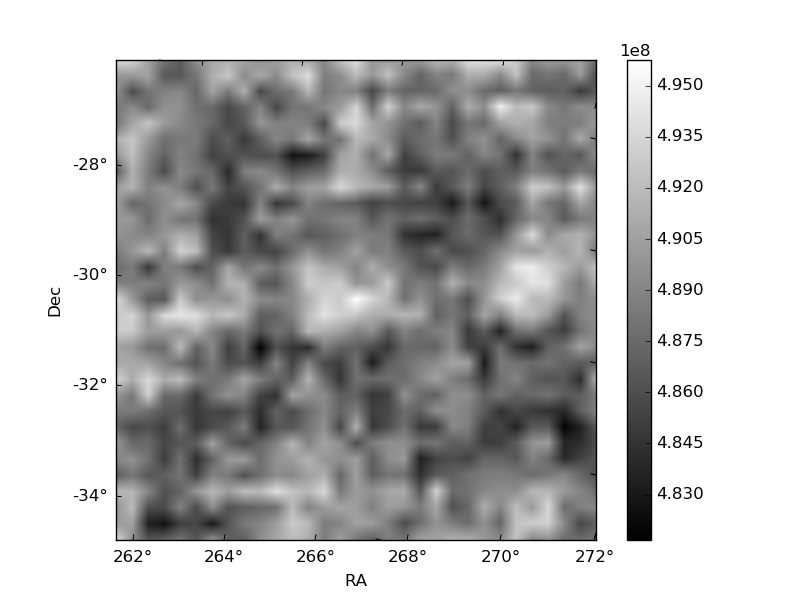
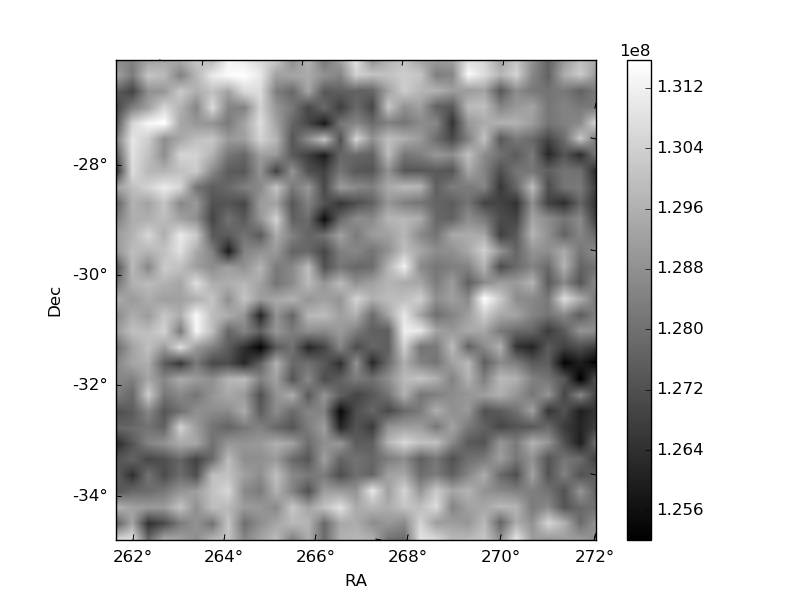
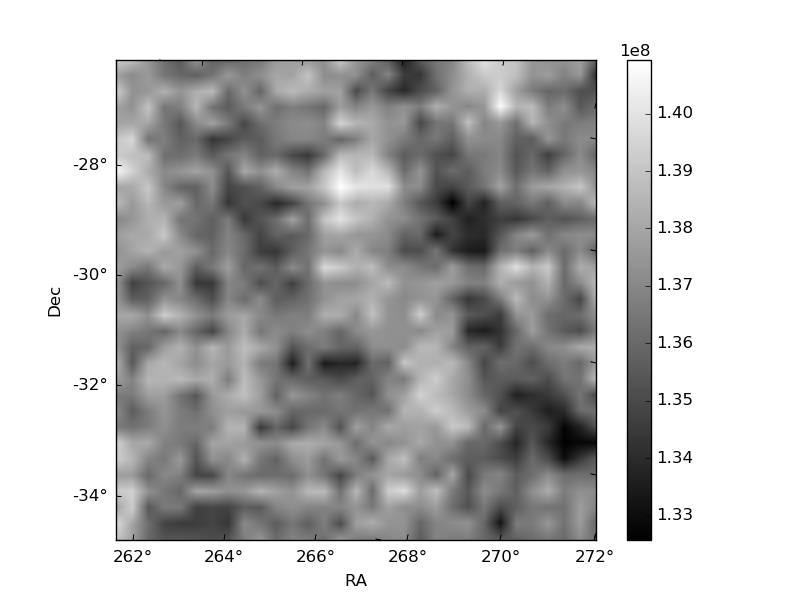
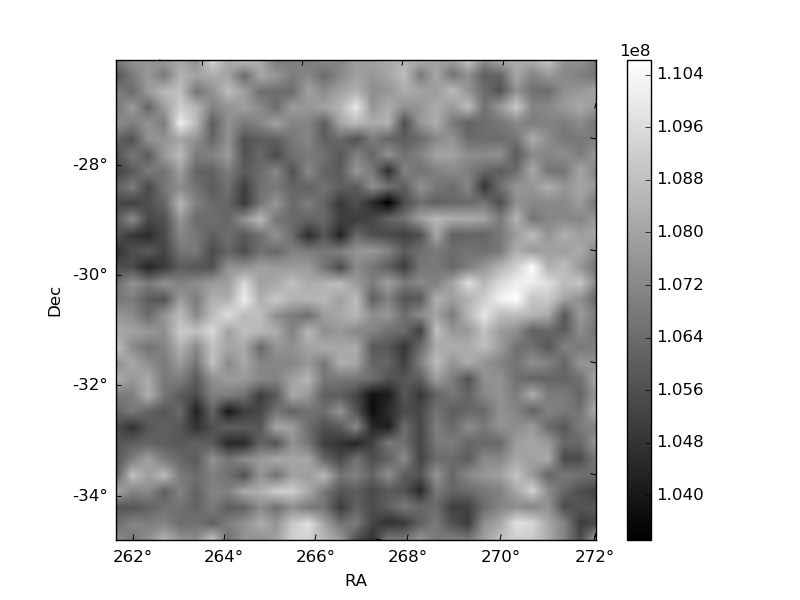
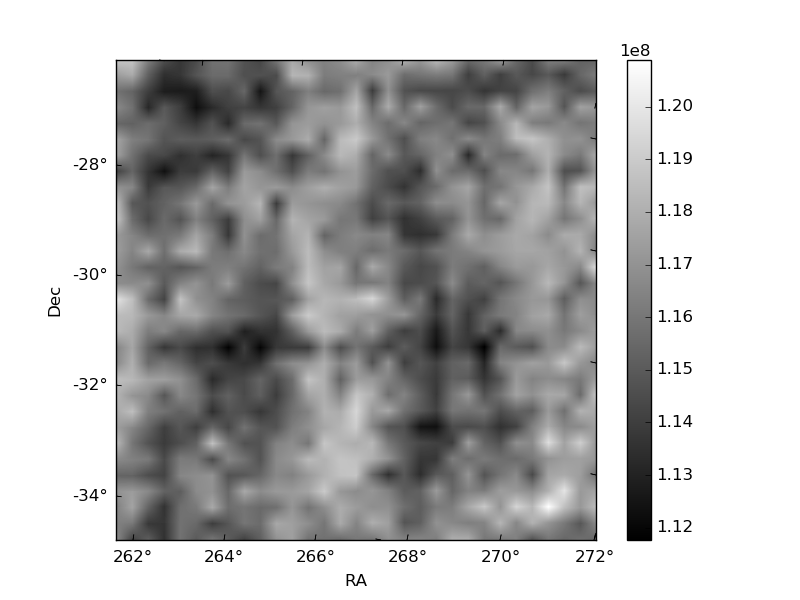
Histogram calculated using DETX and DETY for each event in the final _common_clean file
| Quadrant A | 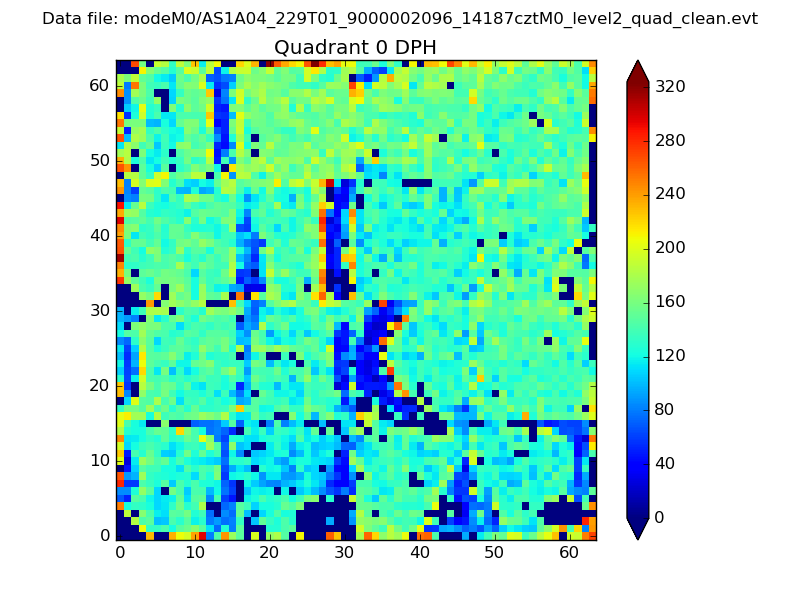 |
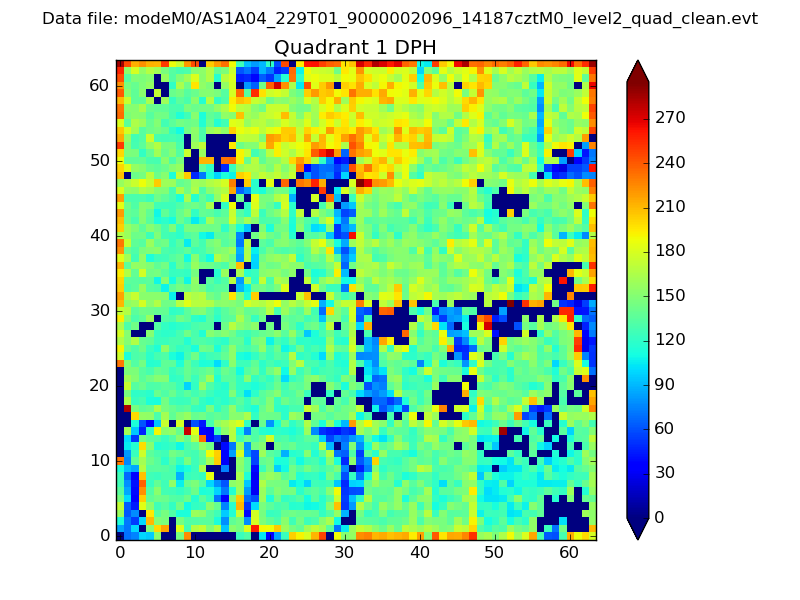 |
Quadrant B |
|---|---|---|---|
| Quadrant D | 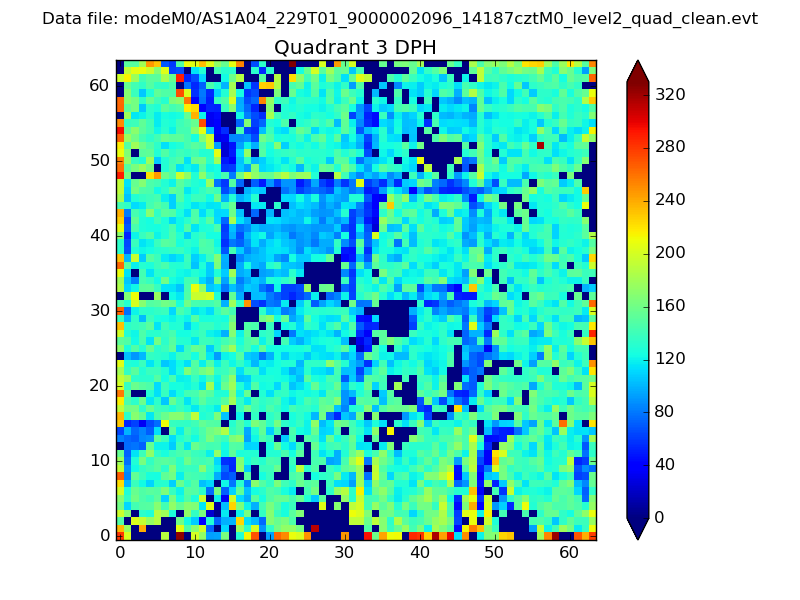 |
 |
Quadrant C |
| Plot type | Count rate plots | Images |
|---|---|---|
| Comparison with Poisson distribution Blue bars denote a histogram of data divided into 1 sec bins. Red curve is a Poisson curve with rate = median count rate of data. |
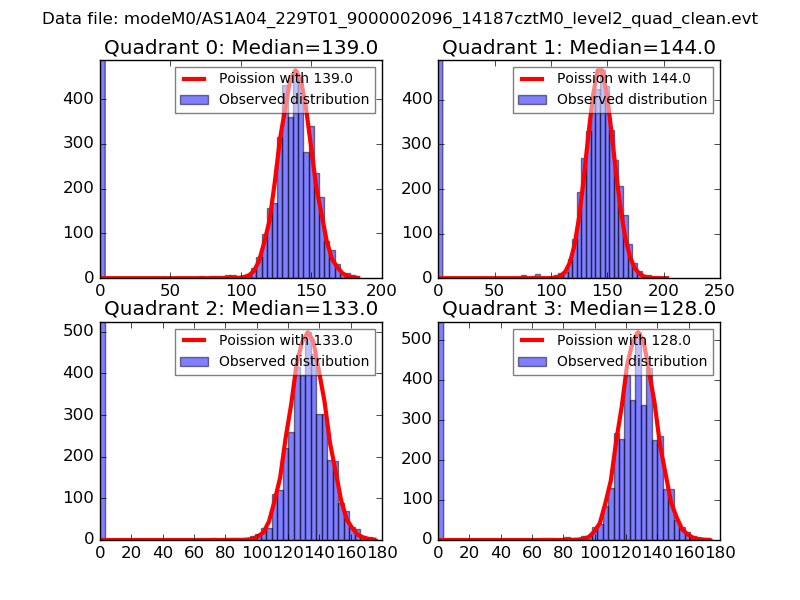 |
 |
| Quadrant-wise count rates Data is divided into 100 sec bins |
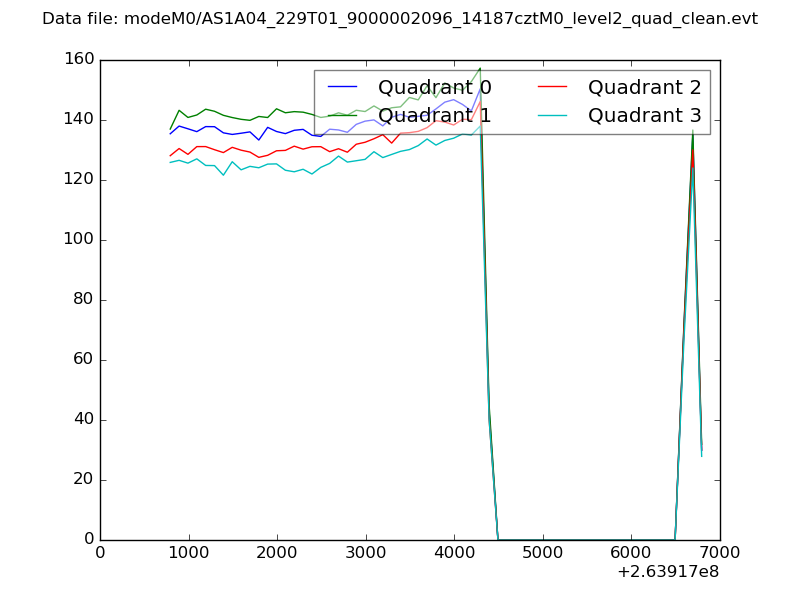 |
|
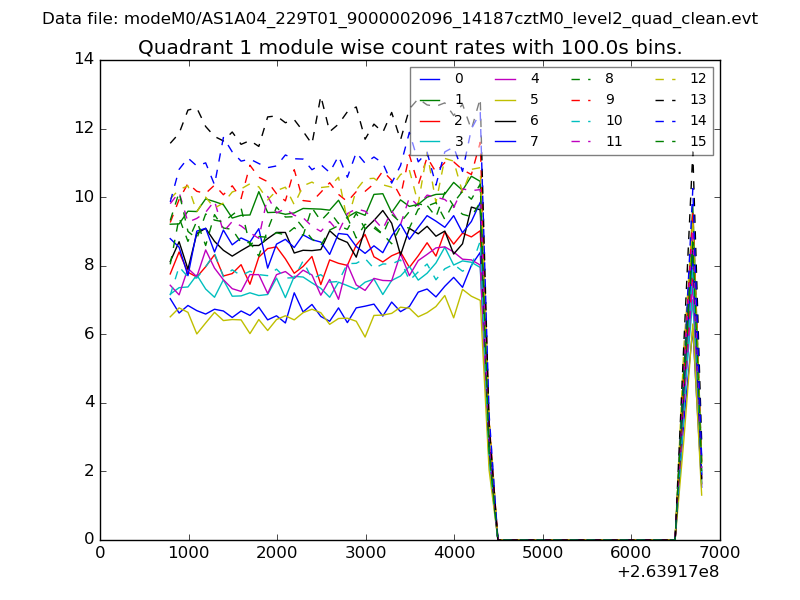
| Module-wise count rates for Quadrant A Data is divided into 100 sec bins |
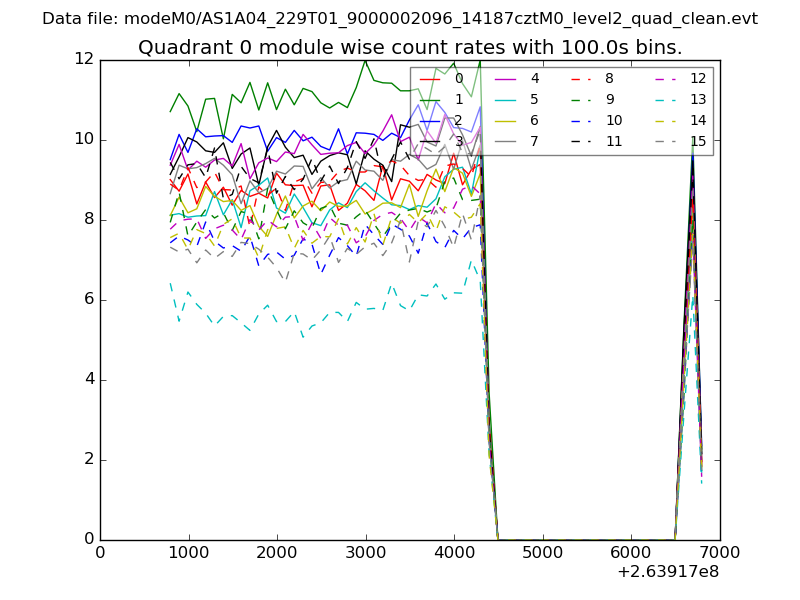 |
 |
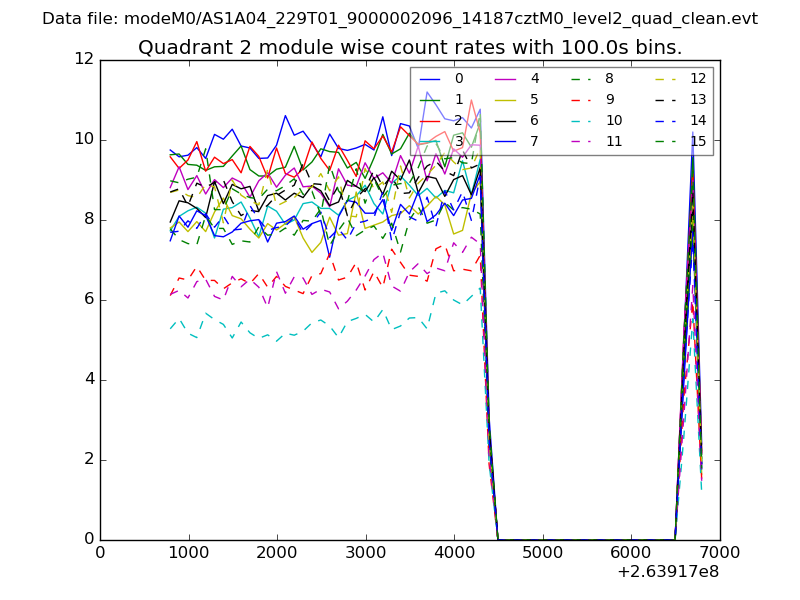
| Module-wise count rates for Quadrant B Data is divided into 100 sec bins |
 |
 |
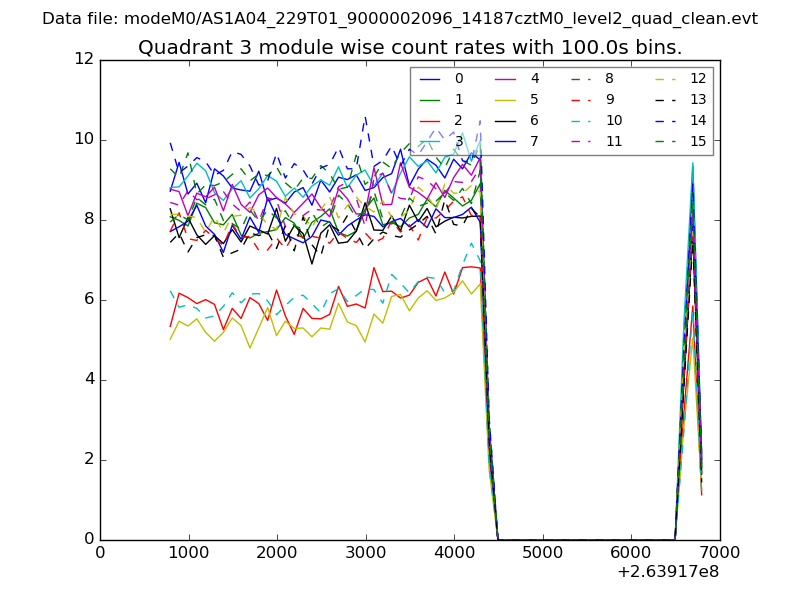
| Module-wise count rates for Quadrant C Data is divided into 100 sec bins |
 |
 |
| Module-wise count rates for Quadrant D Data is divided into 100 sec bins |
 |
 |
| Parameter | Plot |
|---|---|
| CZT HV Monitor | 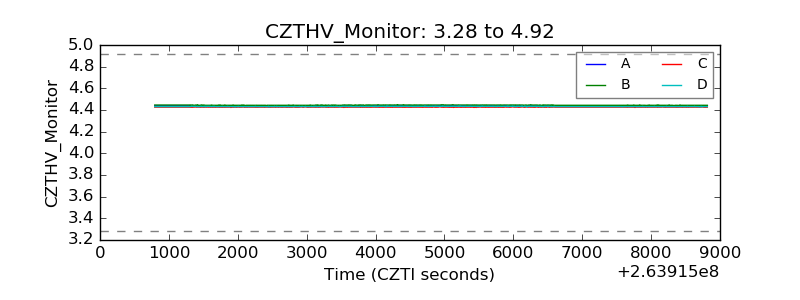 |
| D_VDD | 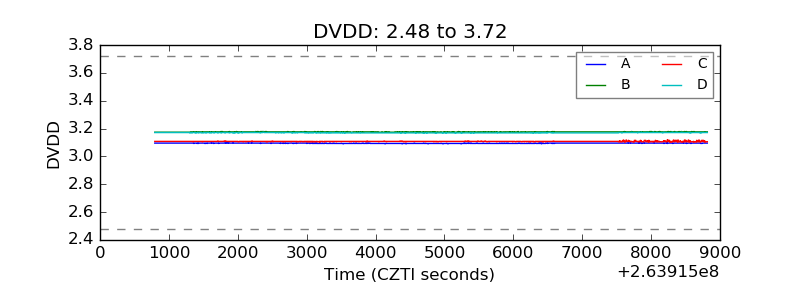 |
| Temperature 1 | 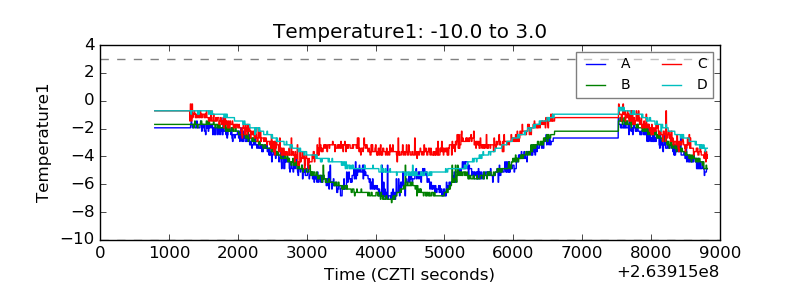 |
| Veto HV Monitor | 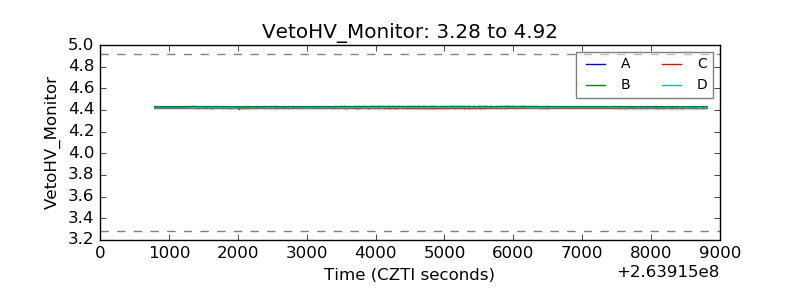 |
| Veto LLD | 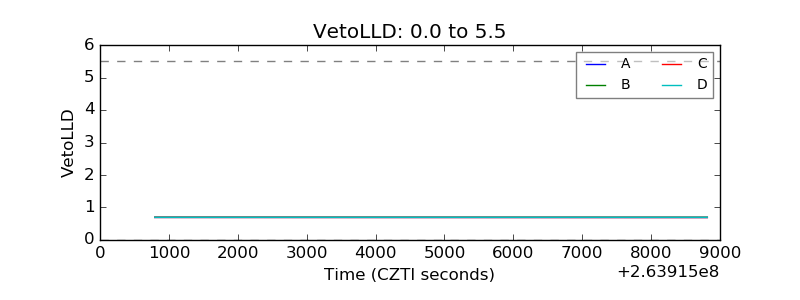 |
| Alpha Counter | 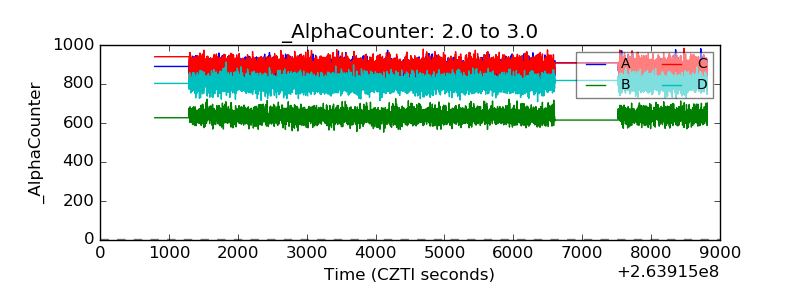 |
| _CPM_Rate | 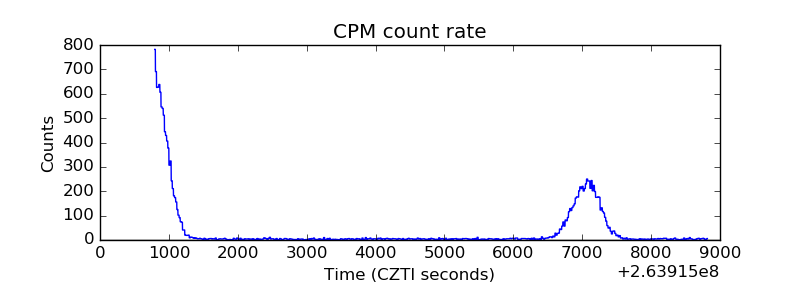 |
| CZT Counter | 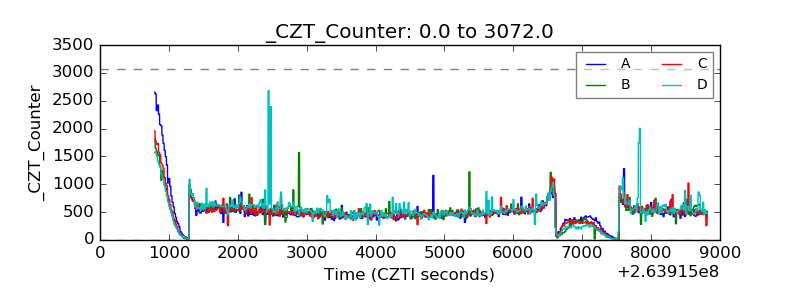 |
| +2.5 Volts monitor |  |
| +5 Volts monitor |  |
| _ROLL_ROT | 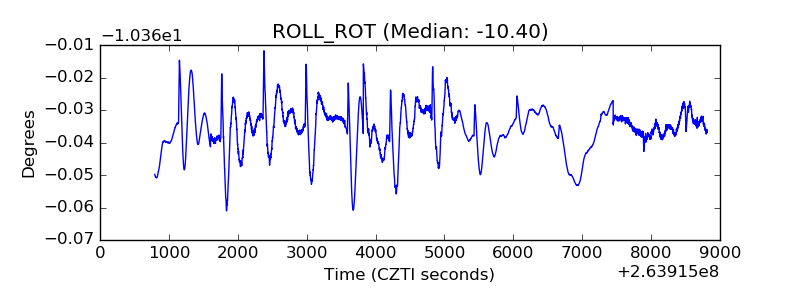 |
| _Roll_DEC | 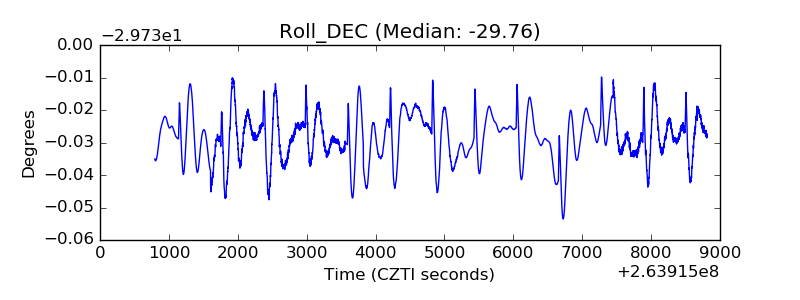 |
| _Roll_RA | 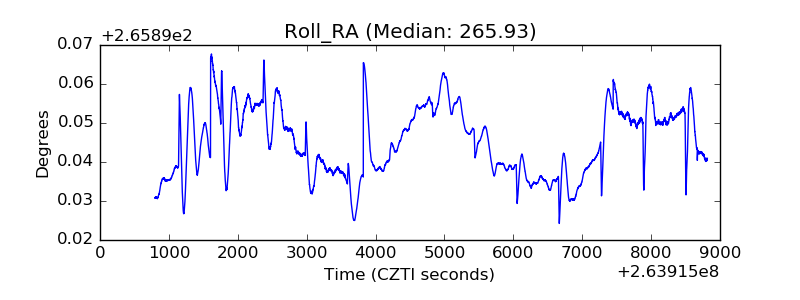 |
| Veto Counter | 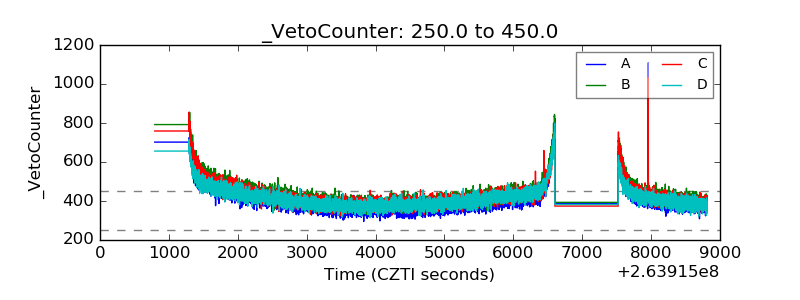 |