| Param | Original file | Final file |
|---|---|---|
| Filename | modeM0/AS1A04_229T01_9000002096_14188cztM0_level2.evt | modeM0/AS1A04_229T01_9000002096_14188cztM0_level2_quad_clean.evt |
| Size (bytes) | 548,654,400 | 90,714,240 |
| Size | 523.2 MB | 86.5 MB |
| Events in quadrant A | 3,601,228 | 573,206 |
| Events in quadrant B | 3,863,931 | 596,891 |
| Events in quadrant C | 3,779,817 | 549,962 |
| Events in quadrant D | 4,875,833 | 518,779 |
| Mode M9 | |||
|---|---|---|---|
| Quadrant | BADHDUFLAG | Total packets | Discarded packets |
| A | 0 | 15 | 0 |
| B | 0 | 15 | 0 |
| C | 0 | 15 | 0 |
| D | 0 | 15 | 0 |
| Mode M0 | |||
|---|---|---|---|
| Quadrant | BADHDUFLAG | Total packets | Discarded packets |
| A | 0 | 15458 | 3 |
| B | 0 | 16029 | 2 |
| C | 0 | 15711 | 2 |
| D | 0 | 19222 | 2 |
| Mode SS | |||
|---|---|---|---|
| Quadrant | BADHDUFLAG | Total packets | Discarded packets |
| A | 0 | 148 | 0 |
| B | 0 | 148 | 0 |
| C | 0 | 148 | 0 |
| D | 0 | 148 | 0 |
| Quadrant | Total seconds | Saturated seconds | Saturation percentage |
|---|---|---|---|
| A | 7307 | 144 | 1.970713% |
| B | 7307 | 189 | 2.586561% |
| C | 7307 | 94 | 1.286438% |
| D | 7307 | 261 | 3.571917% |
Noise dominated data is calculated using 1-second bins in cleaned event files. If a bin has >2000 counts, and if more than 50% of those come from <1% of pixels, then it is considered to be noise-dominated and hence unusable.
| Quadrant | # 1 sec bins | Bins with >0 counts | Bins with >2000 counts | High rate bins dominated by noise | Noise dominated (total time) | Noise dominated (detector-on time) | Marked lightcurve |
|---|---|---|---|---|---|---|---|
| A | 8748 | 7310 | 5 | 5 | 0.06% | 0.07% | 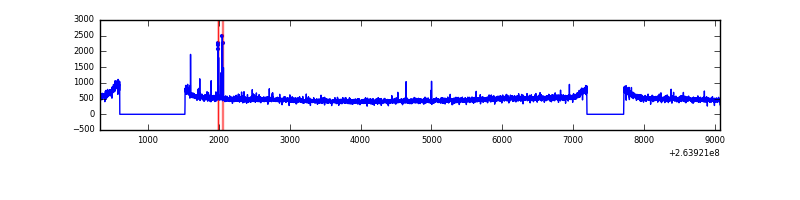 |
| B | 8748 | 7310 | 9 | 9 | 0.10% | 0.12% | 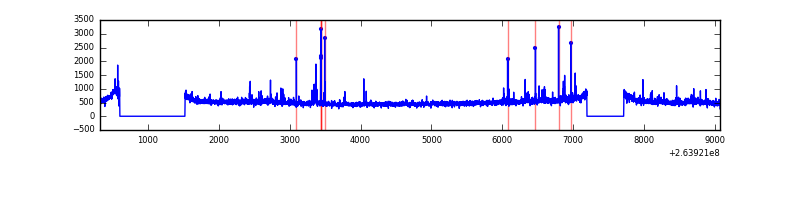 |
| C | 8748 | 7310 | 10 | 10 | 0.11% | 0.14% | 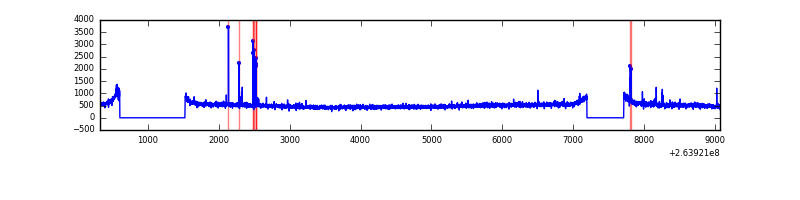 |
| D | 8748 | 7310 | 206 | 206 | 2.35% | 2.82% | 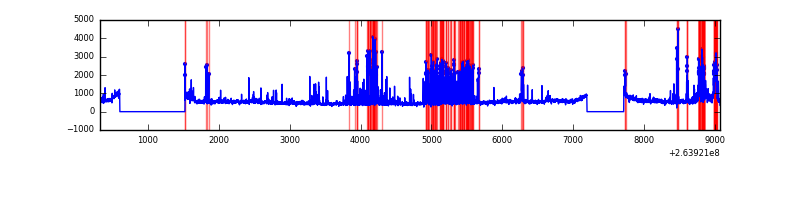 |
Top three noisy pixels from each quadrant. If the there are fewer than three noisy pixels in the level2.evt file, extra rows are filled as -1
| Pixel properties | Quadrant properties | ||||||
|---|---|---|---|---|---|---|---|
| Quadrant | DetID | PixID | Counts | Sigma | Mean | Median | Sigma |
| A | 15 | 69 | 23273 | 119.17 | 923 | 904 | 187.7 |
| A | 12 | 96 | 9924 | 48.05 | 923 | 904 | 187.7 |
| A | 12 | 189 | 9047 | 43.38 | 923 | 904 | 187.7 |
| B | 0 | 219 | 75326 | 418.43 | 927 | 905 | 177.9 |
| B | 4 | 142 | 48313 | 266.55 | 927 | 905 | 177.9 |
| B | 0 | 189 | 40419 | 222.16 | 927 | 905 | 177.9 |
| C | 3 | 233 | 241671 | 1171.16 | 887 | 891 | 205.6 |
| C | 0 | 207 | 60087 | 287.93 | 887 | 891 | 205.6 |
| C | 8 | 128 | 11539 | 51.79 | 887 | 891 | 205.6 |
| D | 10 | 157 | 628024 | 2731.13 | 877 | 855 | 229.6 |
| D | 8 | 195 | 302992 | 1315.72 | 877 | 855 | 229.6 |
| D | 10 | 172 | 252498 | 1095.83 | 877 | 855 | 229.6 |
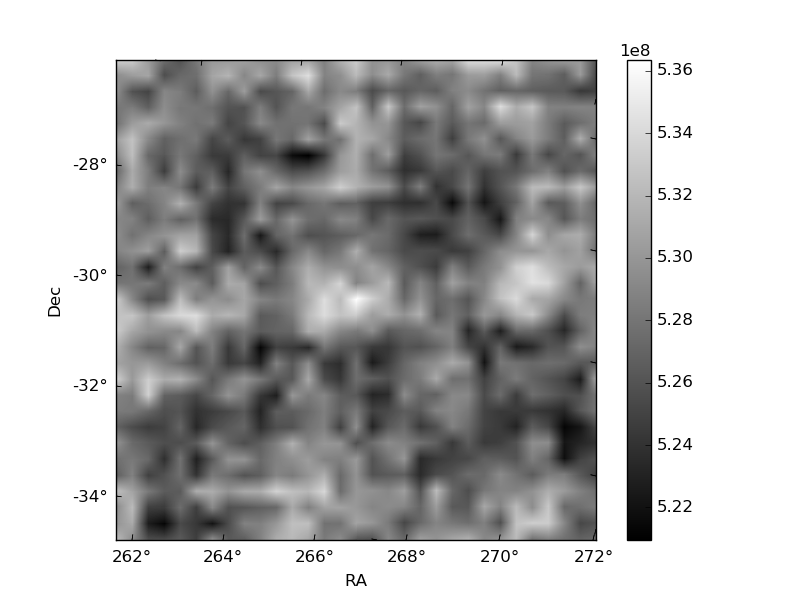
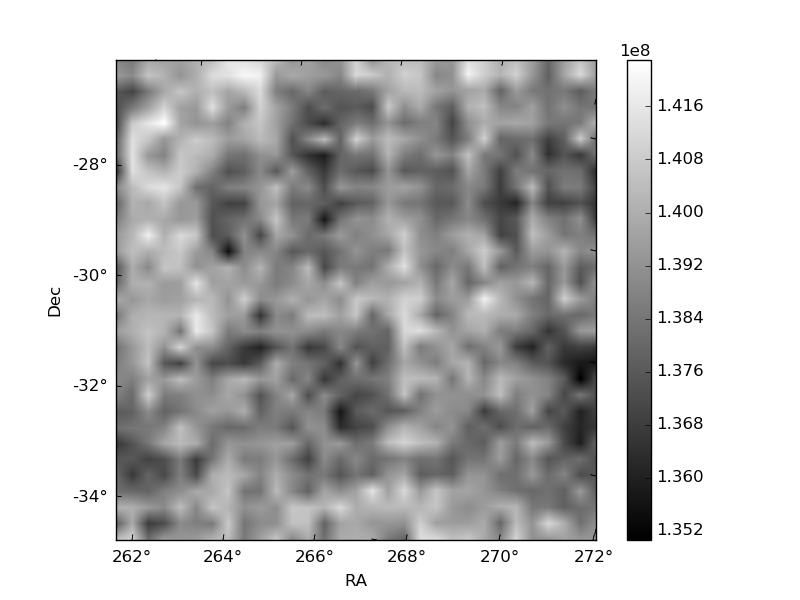
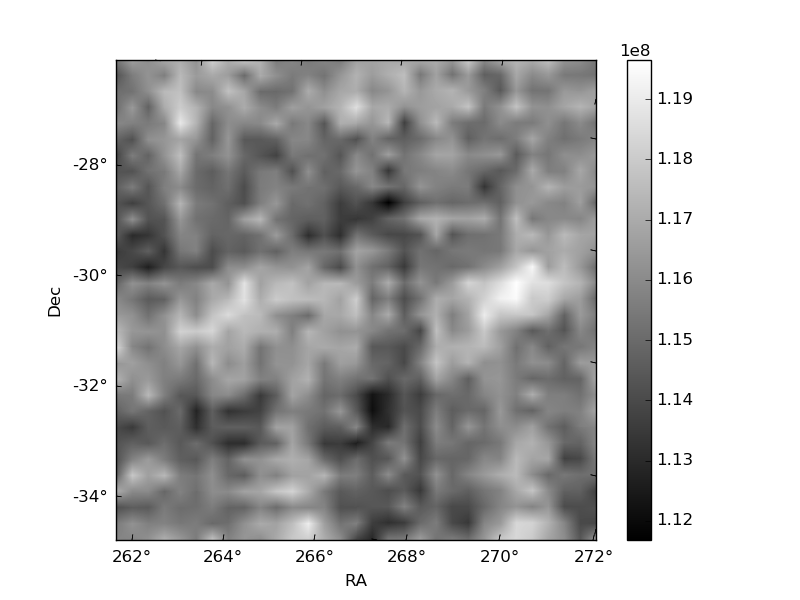
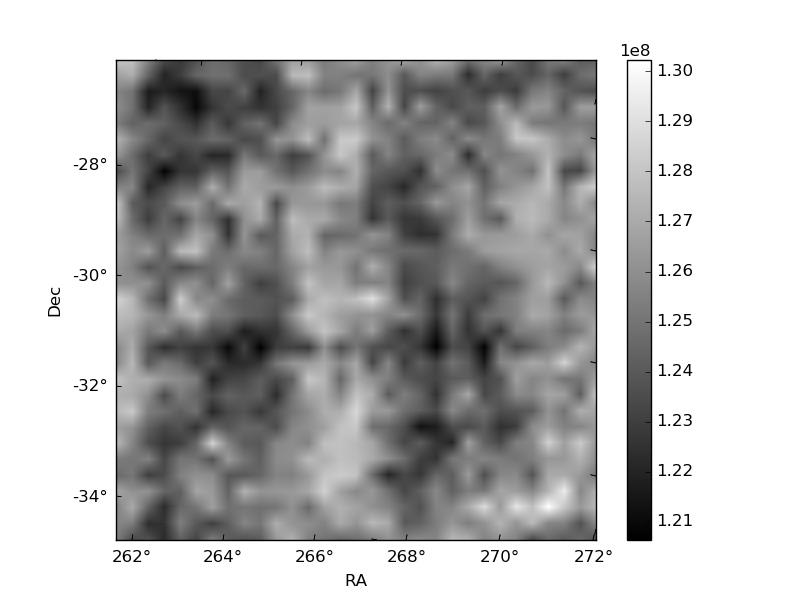
Histogram calculated using DETX and DETY for each event in the final _common_clean file
| Quadrant A | 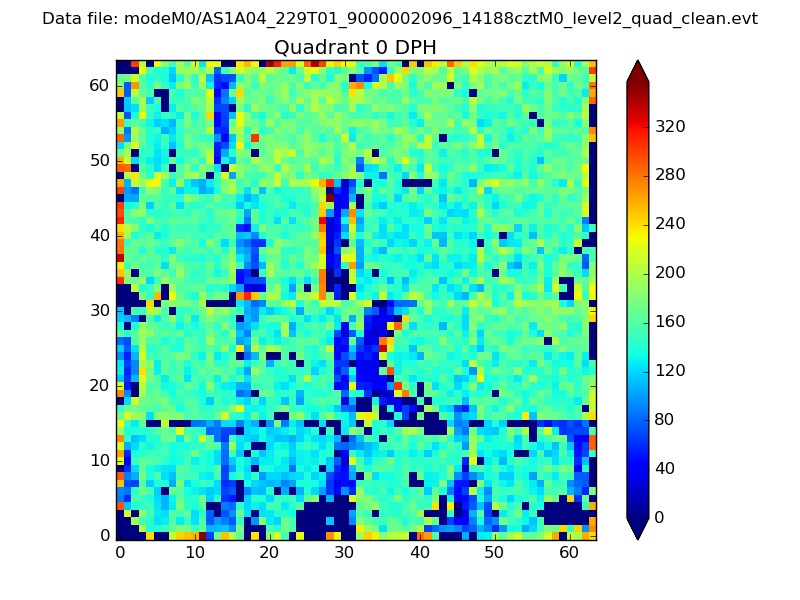 |
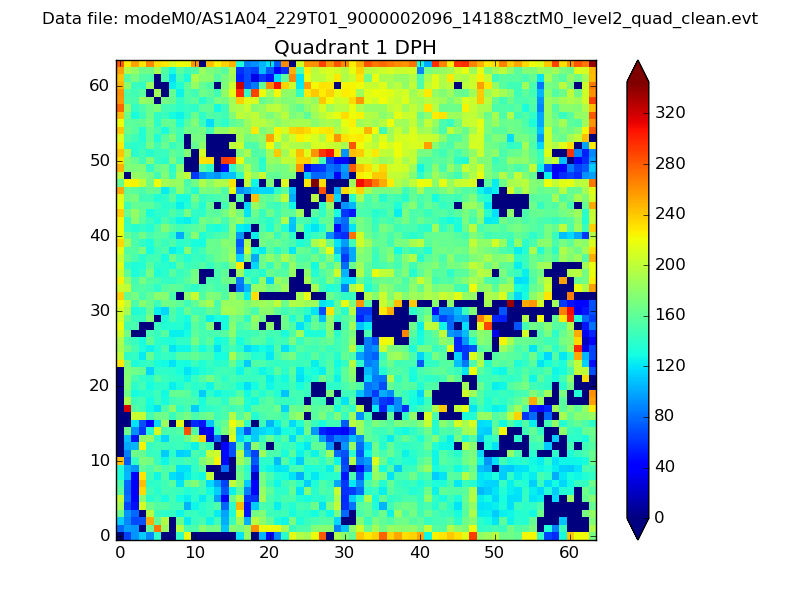 |
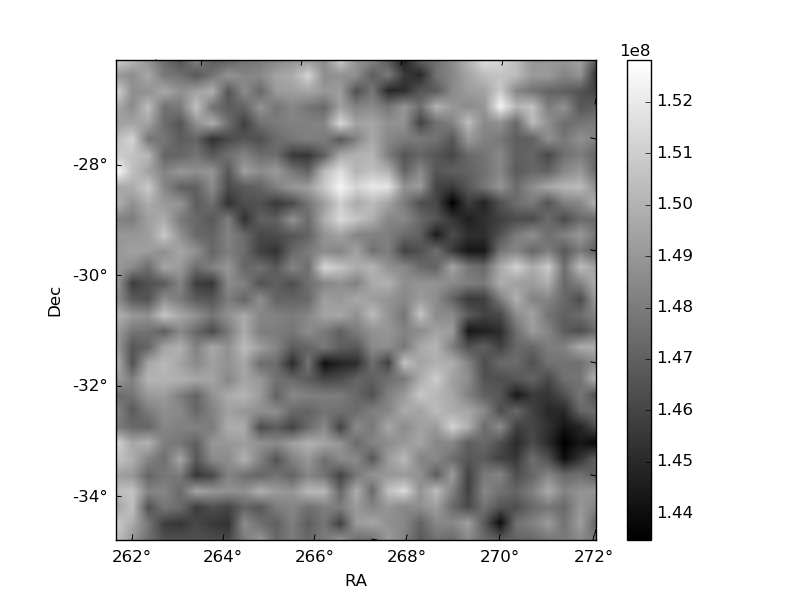
Quadrant B |
|---|---|---|---|
| Quadrant D | 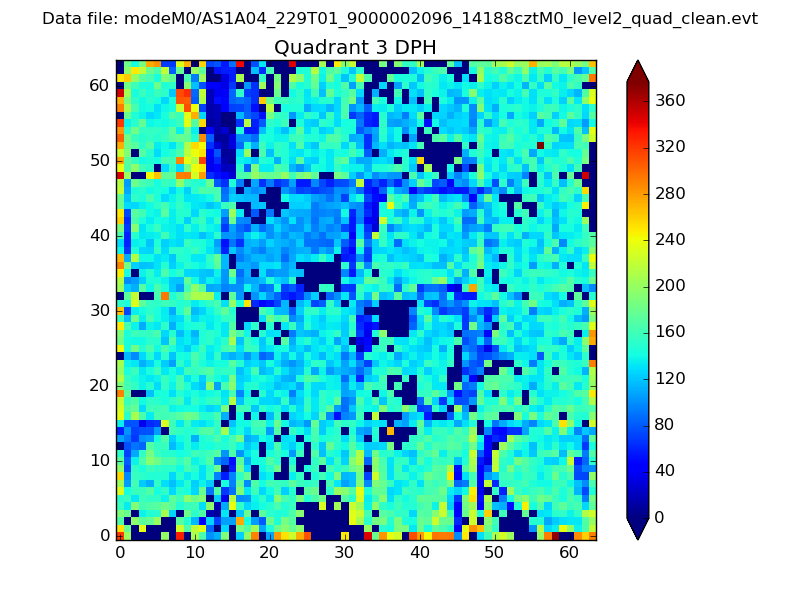 |
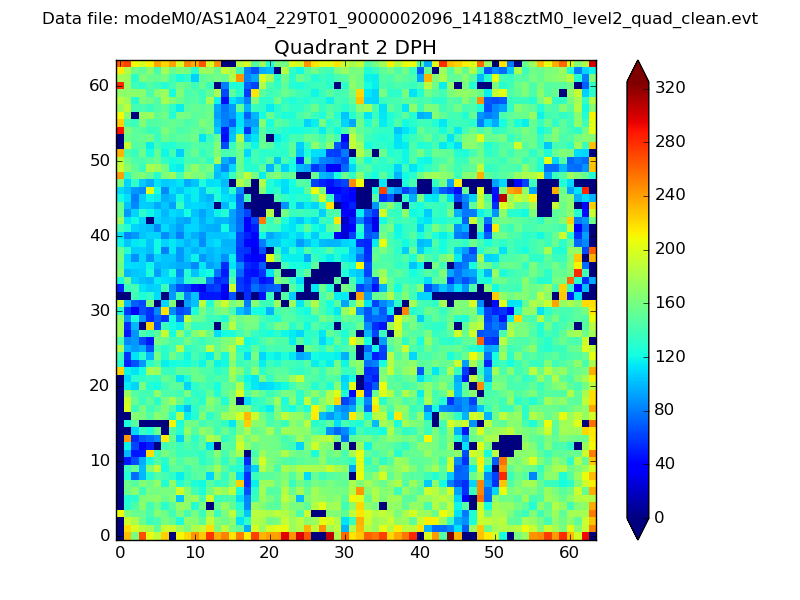 |
Quadrant C |
| Plot type | Count rate plots | Images |
|---|---|---|
| Comparison with Poisson distribution Blue bars denote a histogram of data divided into 1 sec bins. Red curve is a Poisson curve with rate = median count rate of data. |
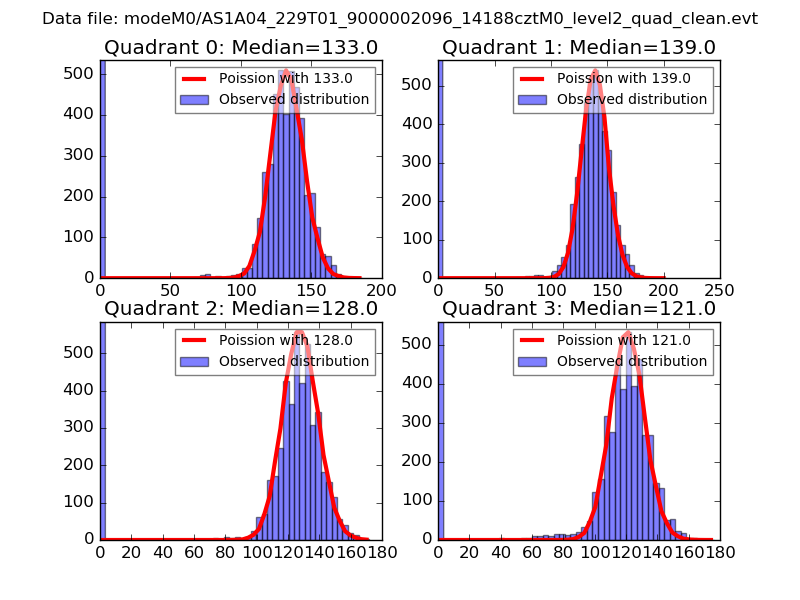 |
 |
| Quadrant-wise count rates Data is divided into 100 sec bins |
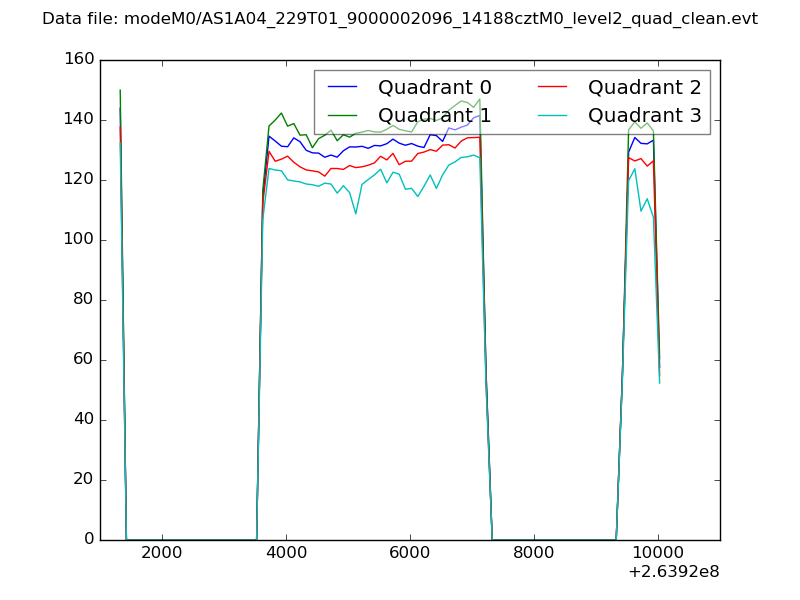 |
|
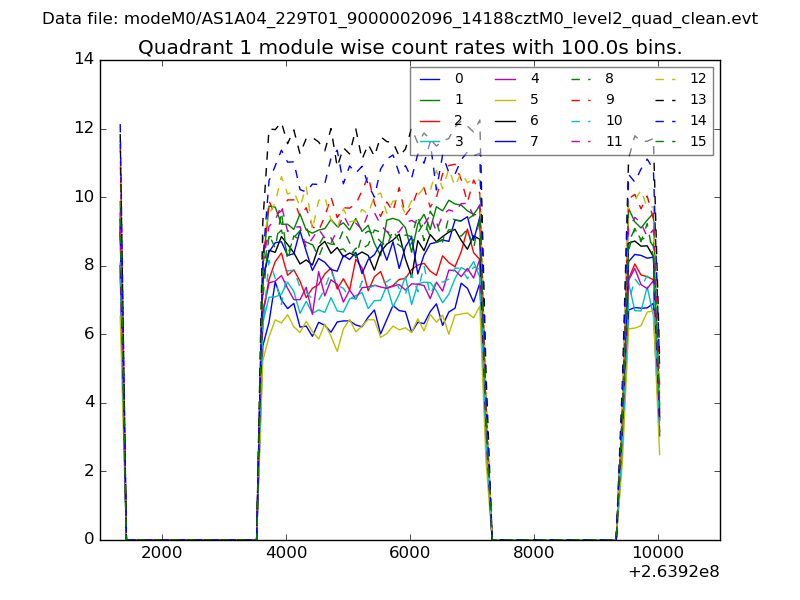
| Module-wise count rates for Quadrant A Data is divided into 100 sec bins |
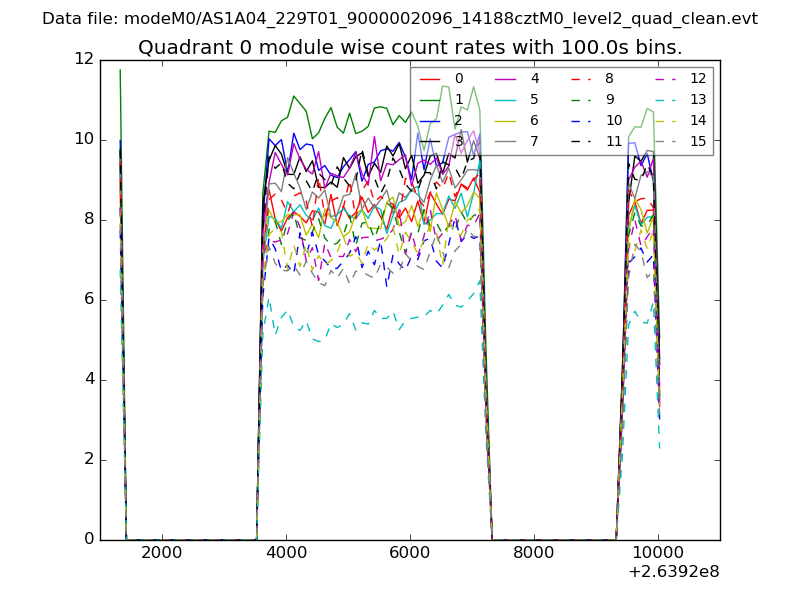 |
 |
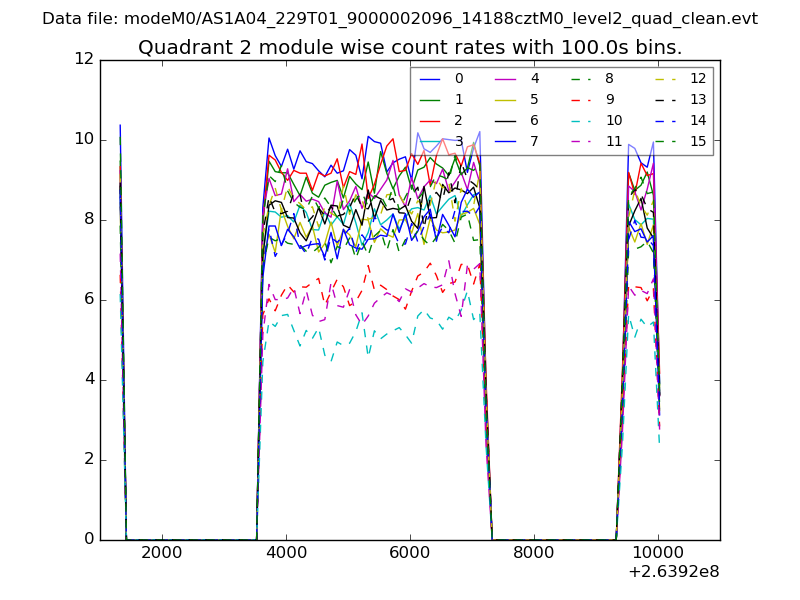
| Module-wise count rates for Quadrant B Data is divided into 100 sec bins |
 |
 |
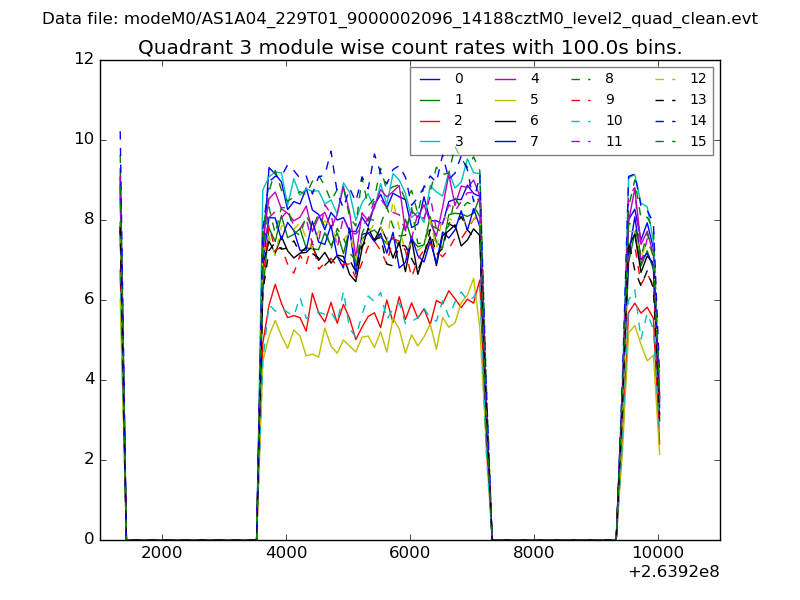
| Module-wise count rates for Quadrant C Data is divided into 100 sec bins |
 |
 |
| Module-wise count rates for Quadrant D Data is divided into 100 sec bins |
 |
 |
| Parameter | Plot |
|---|---|
| CZT HV Monitor | 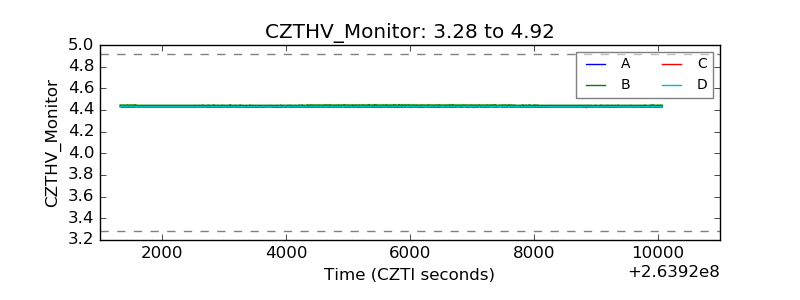 |
| D_VDD | 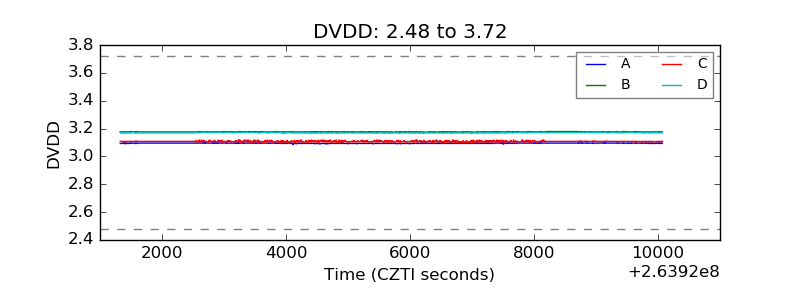 |
| Temperature 1 | 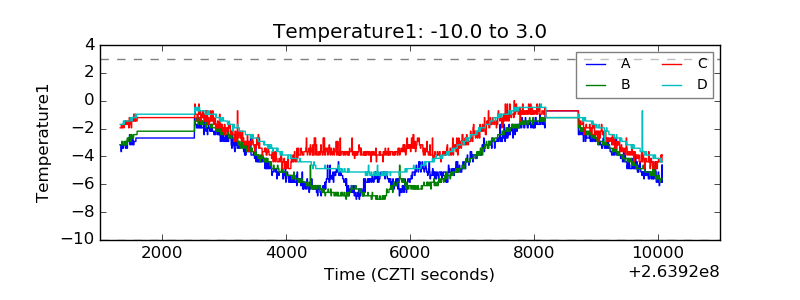 |
| Veto HV Monitor | 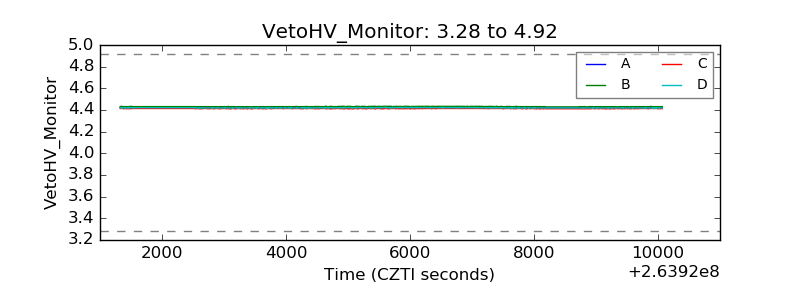 |
| Veto LLD | 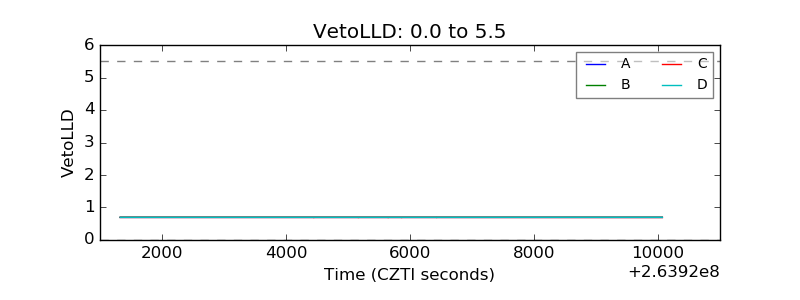 |
| Alpha Counter | 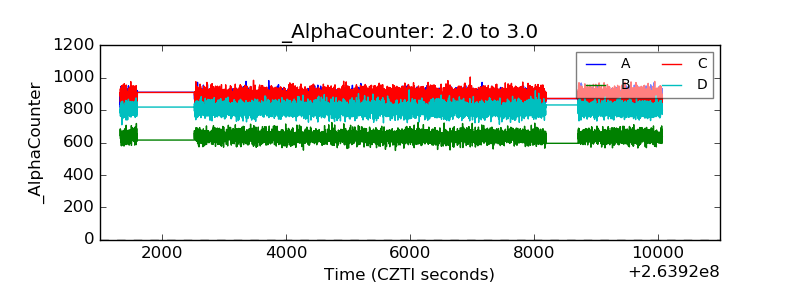 |
| _CPM_Rate | 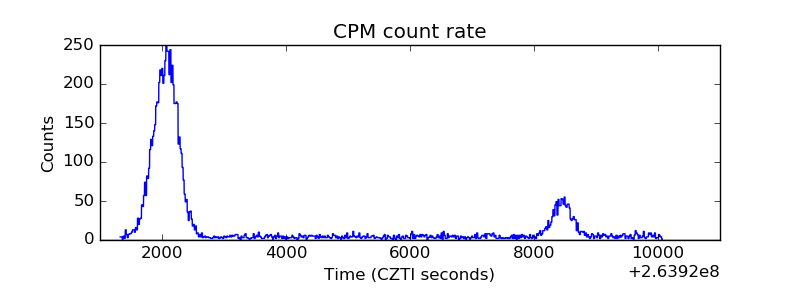 |
| CZT Counter | 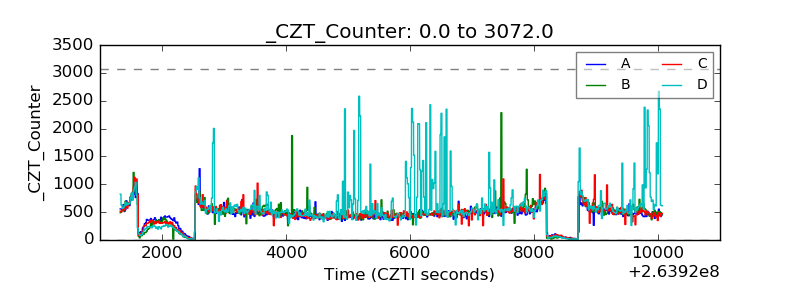 |
| +2.5 Volts monitor | 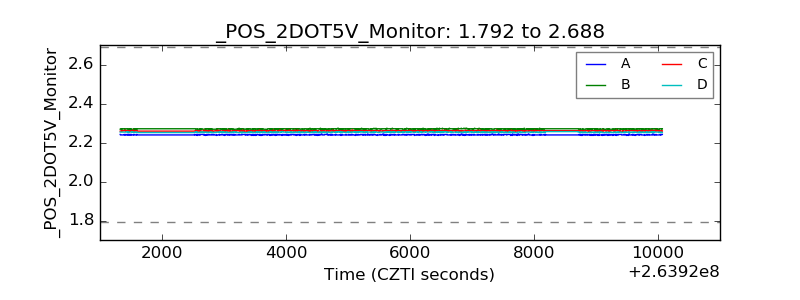 |
| +5 Volts monitor |  |
| _ROLL_ROT | 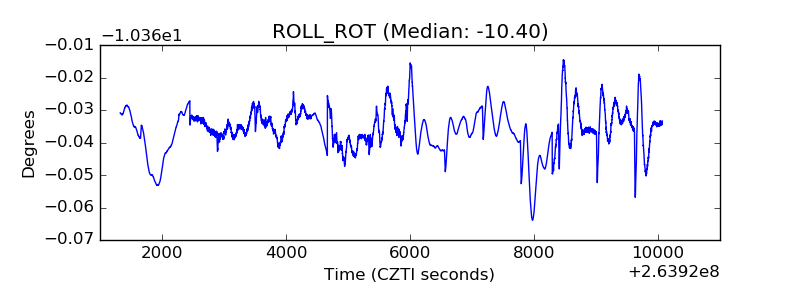 |
| _Roll_DEC | 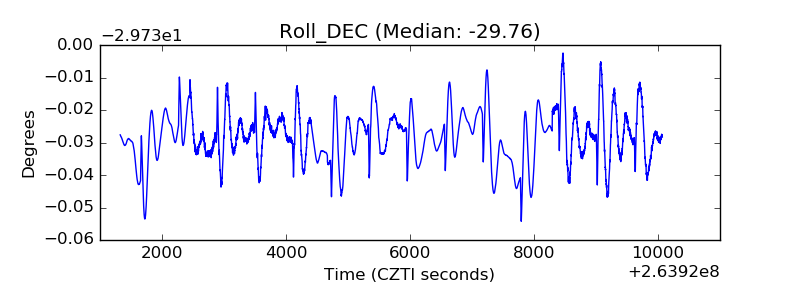 |
| _Roll_RA | 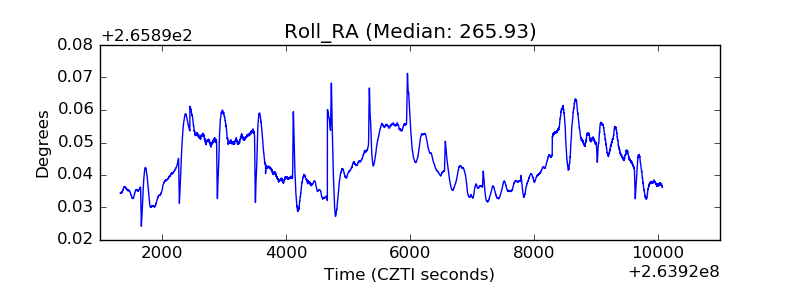 |
| Veto Counter | 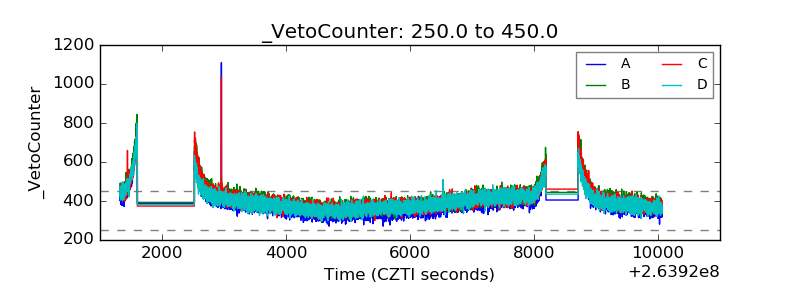 |