| Param | Original file | Final file |
|---|---|---|
| Filename | modeM0/AS1A04_229T01_9000002096_14189cztM0_level2.evt | modeM0/AS1A04_229T01_9000002096_14189cztM0_level2_quad_clean.evt |
| Size (bytes) | 532,987,200 | 98,280,000 |
| Size | 508.3 MB | 93.7 MB |
| Events in quadrant A | 3,642,591 | 623,812 |
| Events in quadrant B | 3,843,787 | 651,668 |
| Events in quadrant C | 3,797,917 | 601,520 |
| Events in quadrant D | 4,346,611 | 575,651 |
| Mode M9 | |||
|---|---|---|---|
| Quadrant | BADHDUFLAG | Total packets | Discarded packets |
| A | 0 | 3 | 0 |
| B | 0 | 3 | 0 |
| C | 0 | 3 | 0 |
| D | 0 | 4 | 0 |
| Mode M0 | |||
|---|---|---|---|
| Quadrant | BADHDUFLAG | Total packets | Discarded packets |
| A | 0 | 15763 | 3 |
| B | 0 | 16221 | 2 |
| C | 0 | 15826 | 2 |
| D | 0 | 17776 | 2 |
| Mode SS | |||
|---|---|---|---|
| Quadrant | BADHDUFLAG | Total packets | Discarded packets |
| A | 0 | 152 | 0 |
| B | 0 | 152 | 0 |
| C | 0 | 152 | 0 |
| D | 0 | 152 | 0 |
| Quadrant | Total seconds | Saturated seconds | Saturation percentage |
|---|---|---|---|
| A | 7527 | 57 | 0.757274% |
| B | 7527 | 99 | 1.315265% |
| C | 7527 | 44 | 0.584562% |
| D | 7527 | 168 | 2.231965% |
Noise dominated data is calculated using 1-second bins in cleaned event files. If a bin has >2000 counts, and if more than 50% of those come from <1% of pixels, then it is considered to be noise-dominated and hence unusable.
| Quadrant | # 1 sec bins | Bins with >0 counts | Bins with >2000 counts | High rate bins dominated by noise | Noise dominated (total time) | Noise dominated (detector-on time) | Marked lightcurve |
|---|---|---|---|---|---|---|---|
| A | 7803 | 7529 | 1 | 1 | 0.01% | 0.01% | 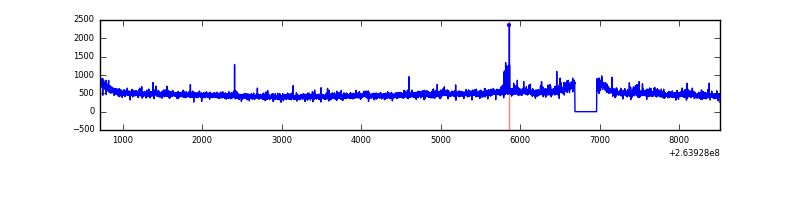 |
| B | 7803 | 7529 | 5 | 5 | 0.06% | 0.07% | 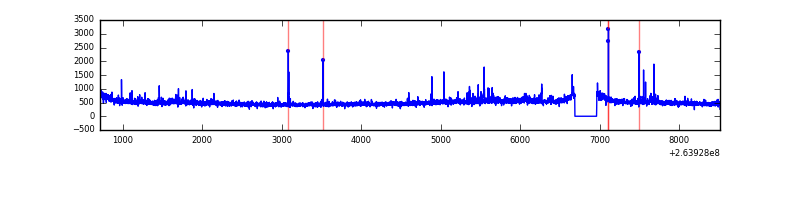 |
| C | 7803 | 7529 | 2 | 2 | 0.03% | 0.03% | 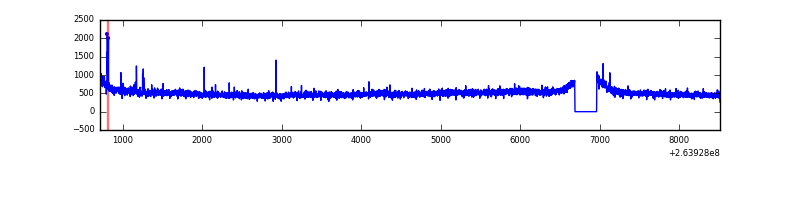 |
| D | 7803 | 7529 | 110 | 110 | 1.41% | 1.46% | 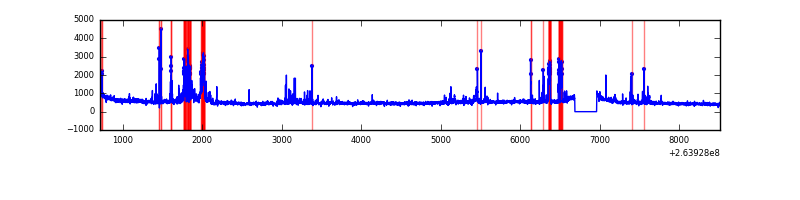 |
Top three noisy pixels from each quadrant. If the there are fewer than three noisy pixels in the level2.evt file, extra rows are filled as -1
| Pixel properties | Quadrant properties | ||||||
|---|---|---|---|---|---|---|---|
| Quadrant | DetID | PixID | Counts | Sigma | Mean | Median | Sigma |
| A | 8 | 15 | 37983 | 196.87 | 924 | 904 | 188.3 |
| A | 12 | 189 | 18673 | 94.34 | 924 | 904 | 188.3 |
| A | 12 | 96 | 13464 | 66.69 | 924 | 904 | 188.3 |
| B | 0 | 219 | 76498 | 426.87 | 935 | 915 | 177.1 |
| B | 0 | 189 | 29756 | 162.89 | 935 | 915 | 177.1 |
| B | 4 | 142 | 28229 | 154.26 | 935 | 915 | 177.1 |
| C | 3 | 233 | 290431 | 1407.83 | 894 | 899 | 205.7 |
| C | 0 | 207 | 22469 | 104.88 | 894 | 899 | 205.7 |
| C | 13 | 61 | 6490 | 27.19 | 894 | 899 | 205.7 |
| D | 10 | 172 | 273172 | 1279.04 | 883 | 862 | 212.9 |
| D | 8 | 195 | 239915 | 1122.84 | 883 | 862 | 212.9 |
| D | 12 | 110 | 144470 | 674.53 | 883 | 862 | 212.9 |
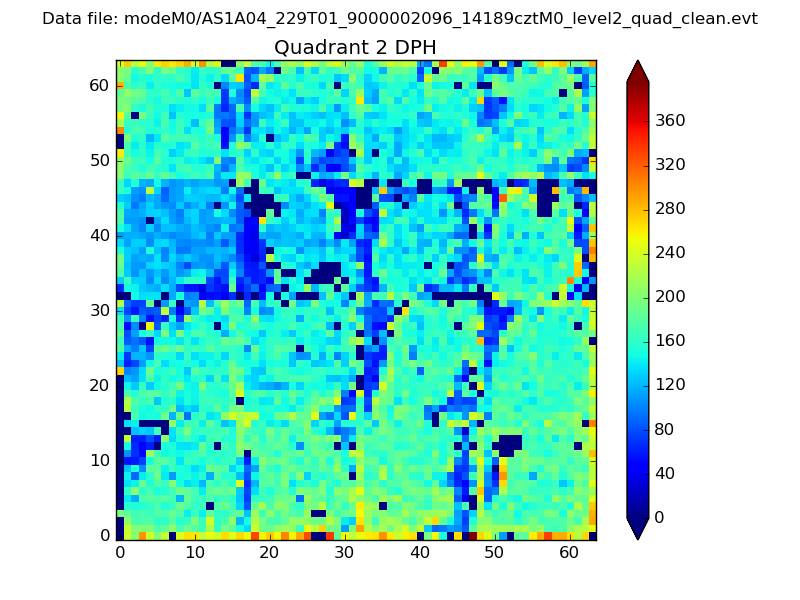
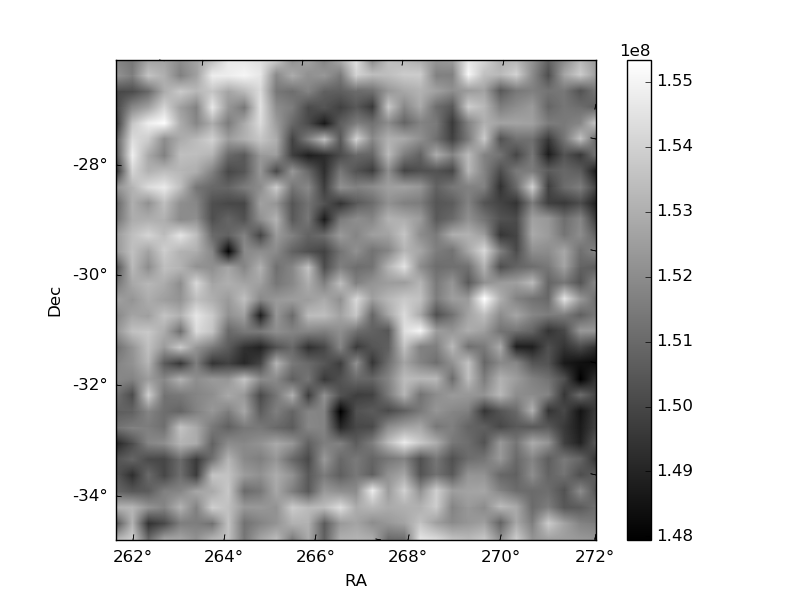
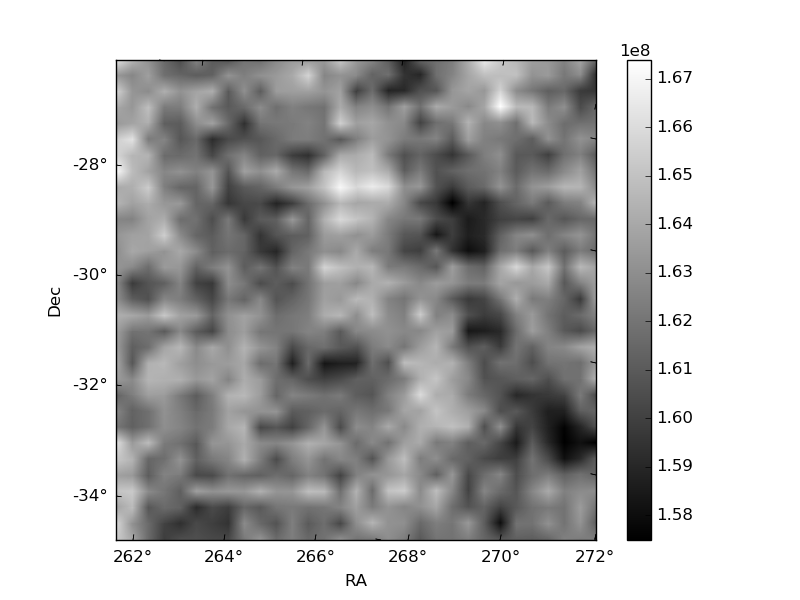
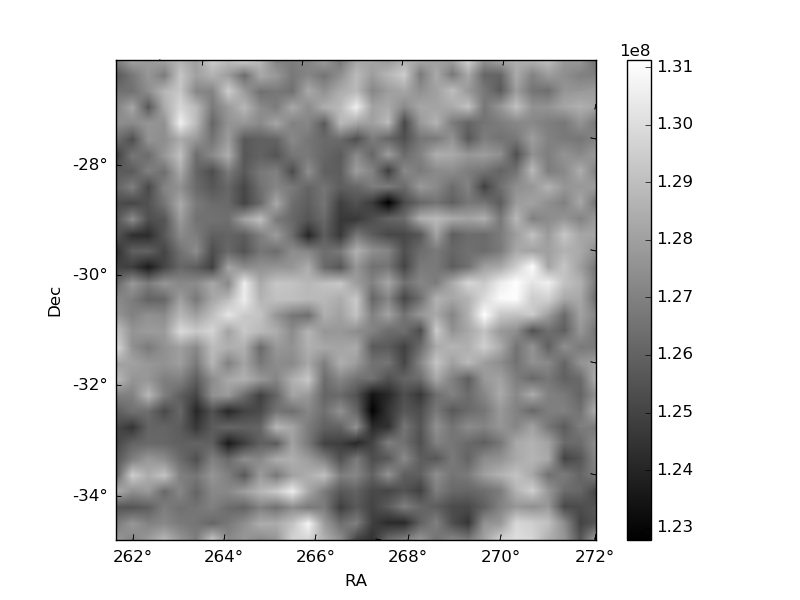
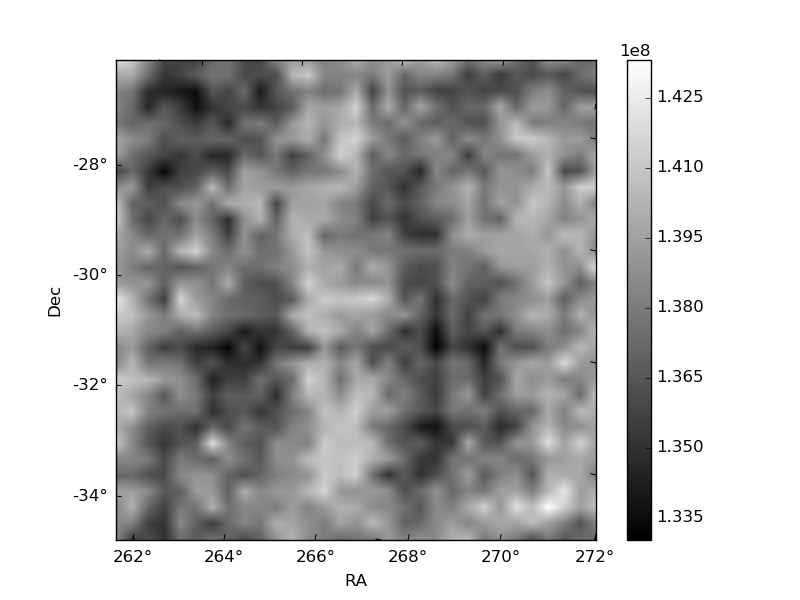
Histogram calculated using DETX and DETY for each event in the final _common_clean file
| Quadrant A | 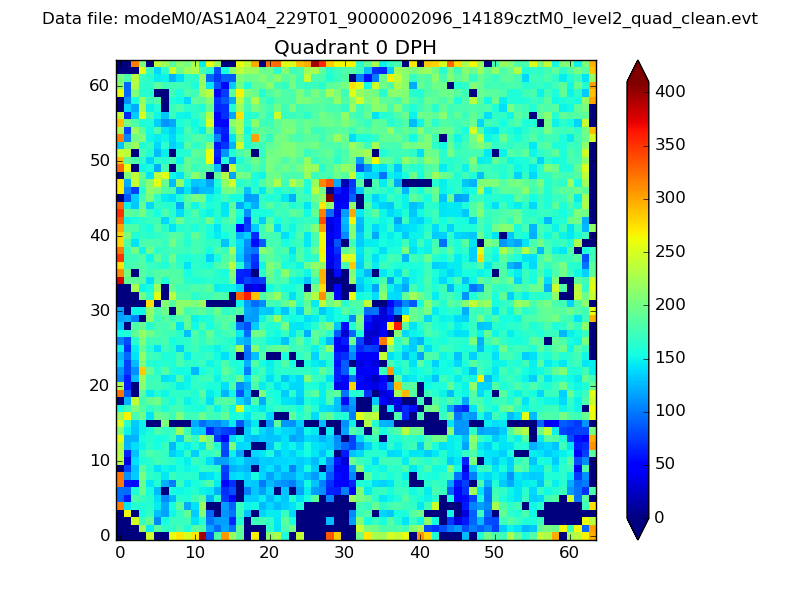 |
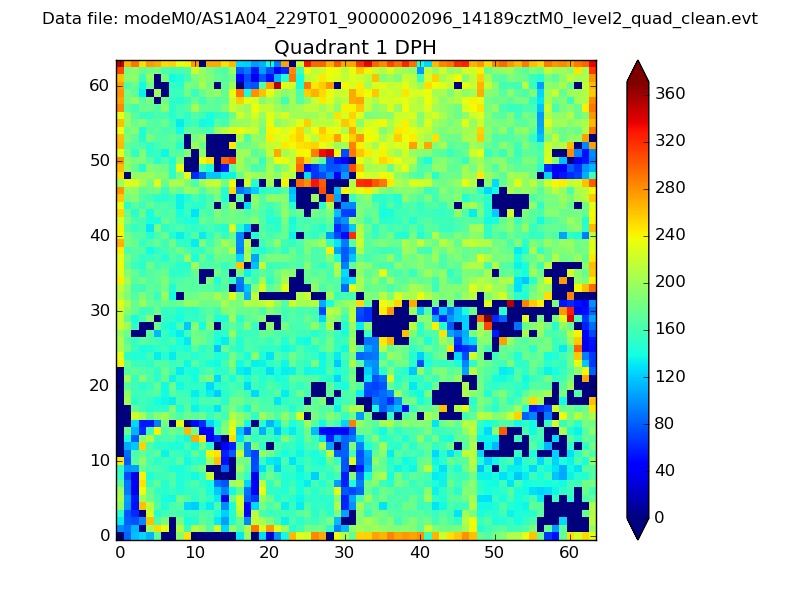 |
Quadrant B |
|---|---|---|---|
| Quadrant D | 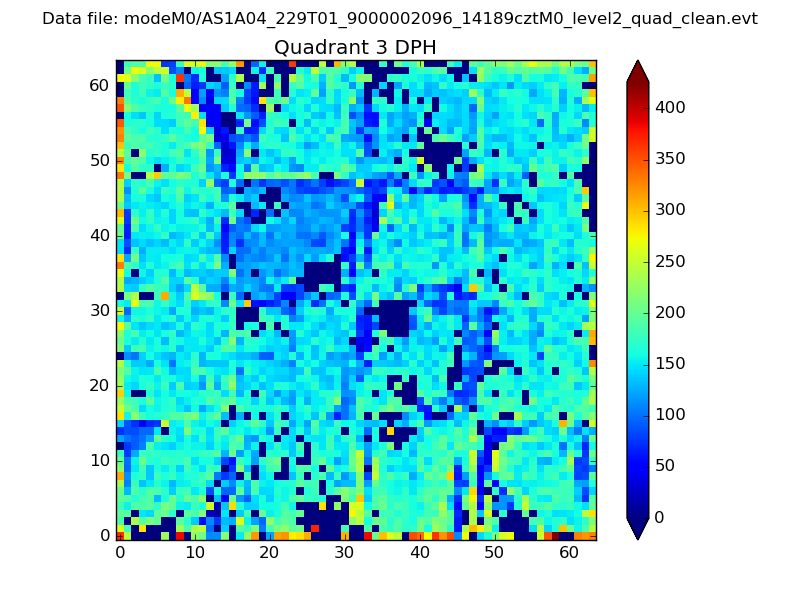 |
 |
Quadrant C |
| Plot type | Count rate plots | Images |
|---|---|---|
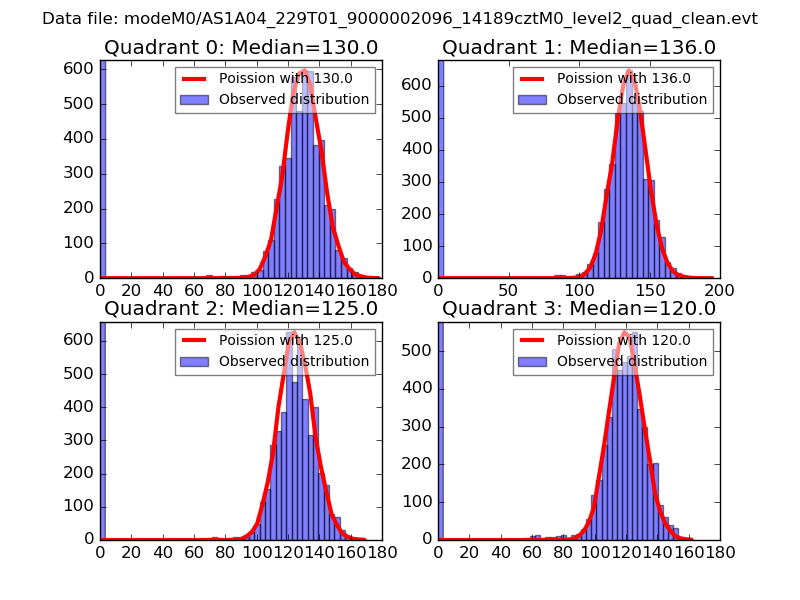
| Comparison with Poisson distribution Blue bars denote a histogram of data divided into 1 sec bins. Red curve is a Poisson curve with rate = median count rate of data. |
 |
 |
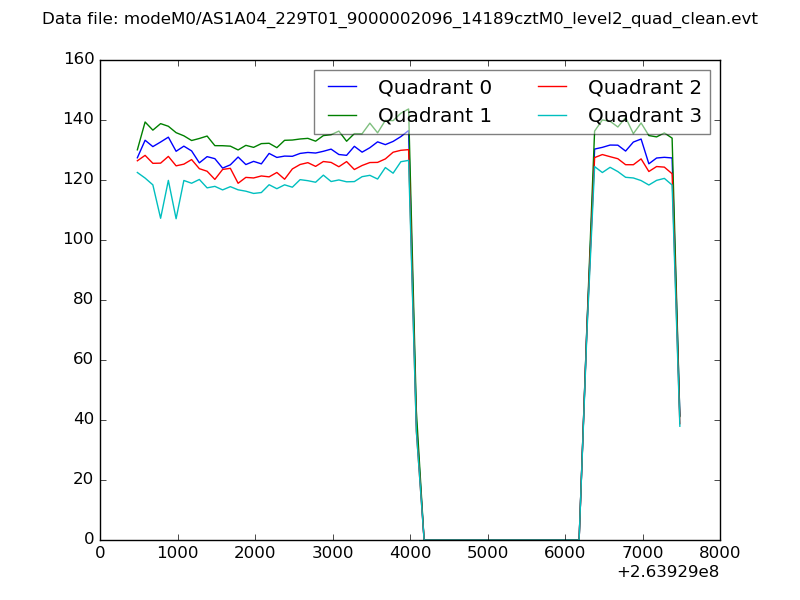
| Quadrant-wise count rates Data is divided into 100 sec bins |
 |
|
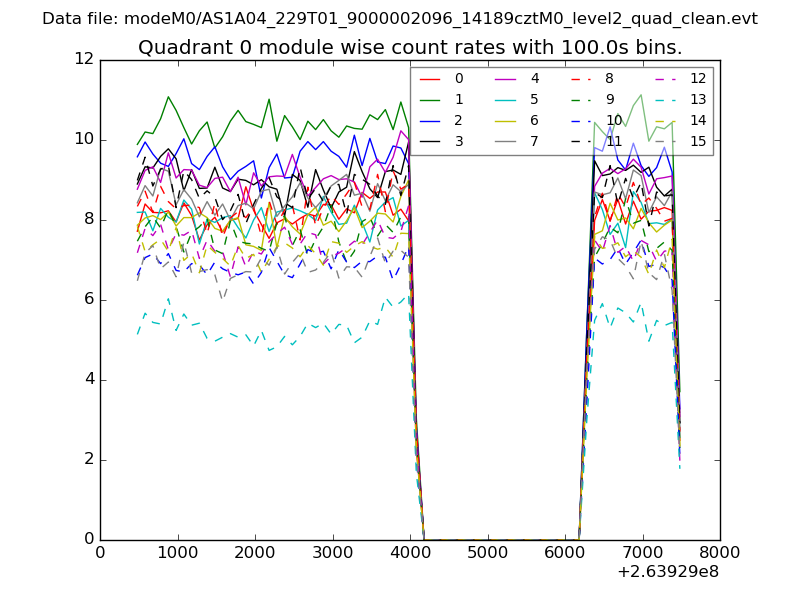
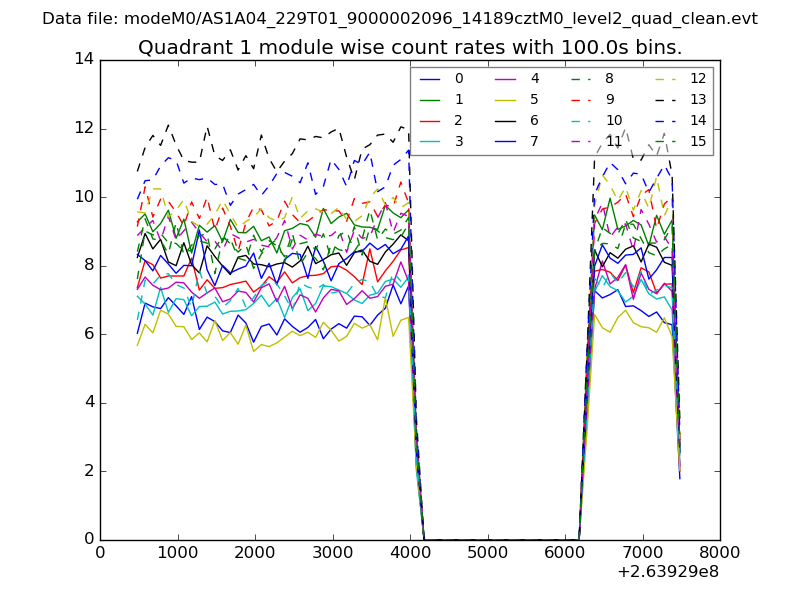
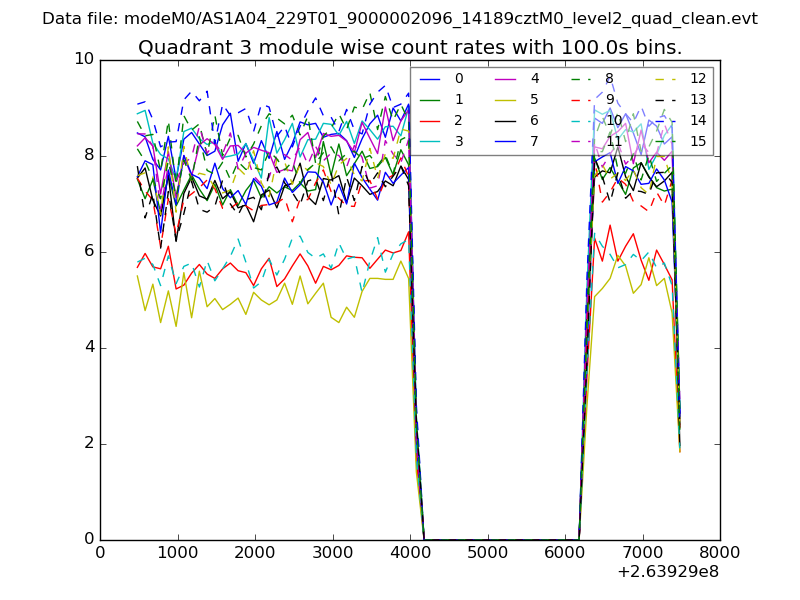
| Module-wise count rates for Quadrant A Data is divided into 100 sec bins |
 |
 |
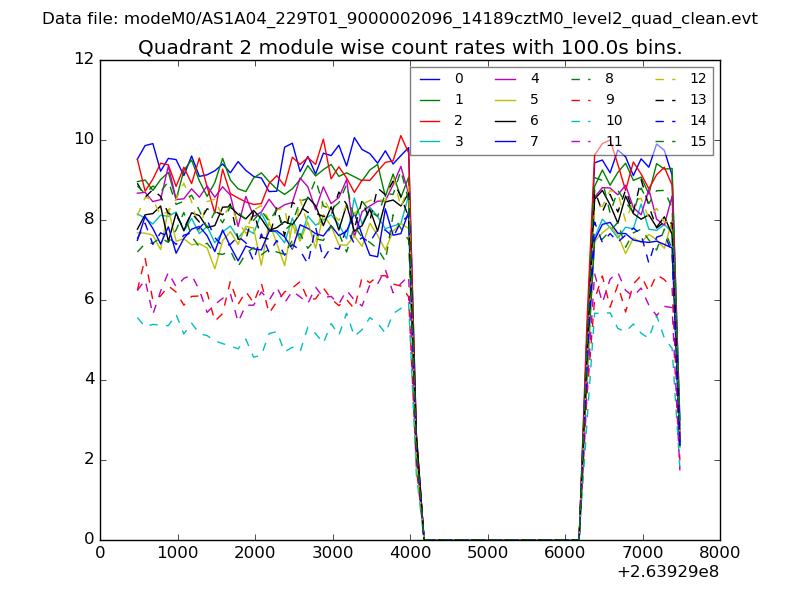
| Module-wise count rates for Quadrant B Data is divided into 100 sec bins |
 |
 |
| Module-wise count rates for Quadrant C Data is divided into 100 sec bins |
 |
 |
| Module-wise count rates for Quadrant D Data is divided into 100 sec bins |
 |
 |
| Parameter | Plot |
|---|---|
| CZT HV Monitor | 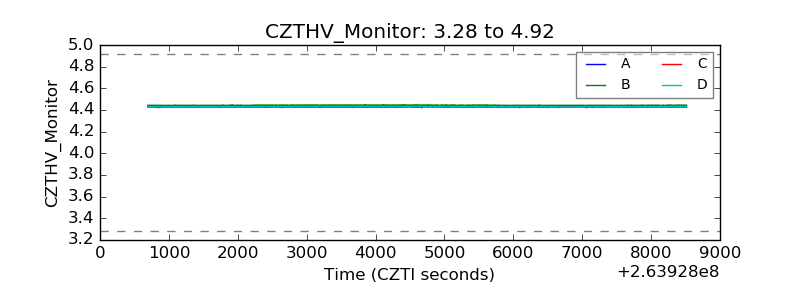 |
| D_VDD | 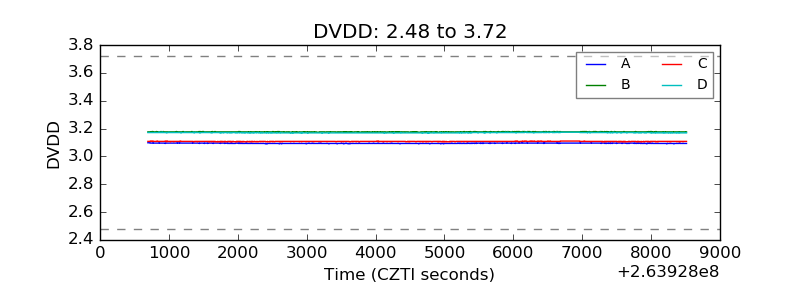 |
| Temperature 1 | 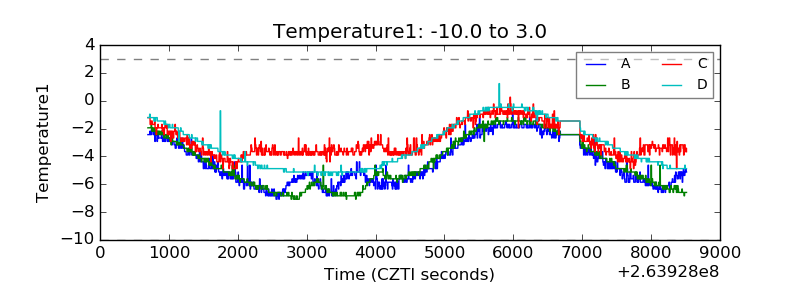 |
| Veto HV Monitor | 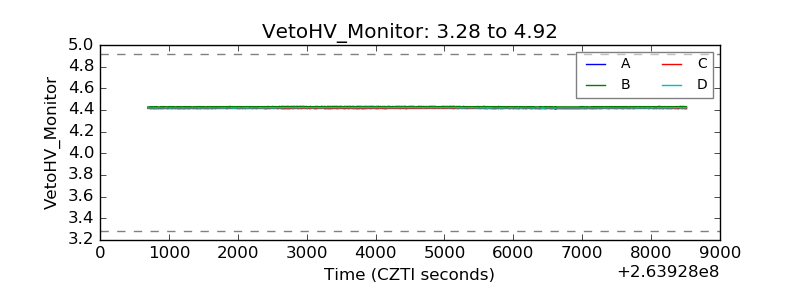 |
| Veto LLD | 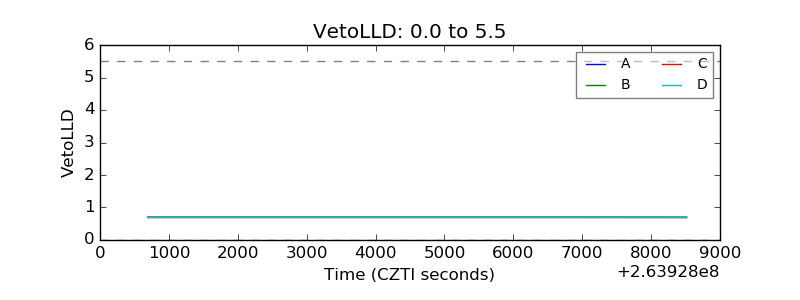 |
| Alpha Counter | 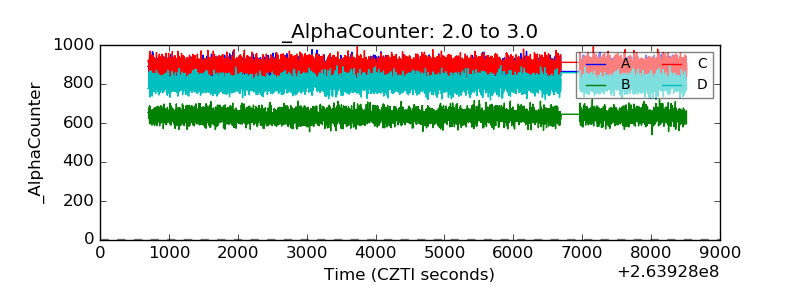 |
| _CPM_Rate | 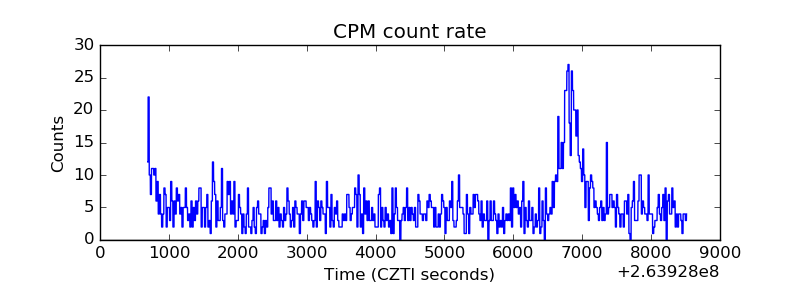 |
| CZT Counter | 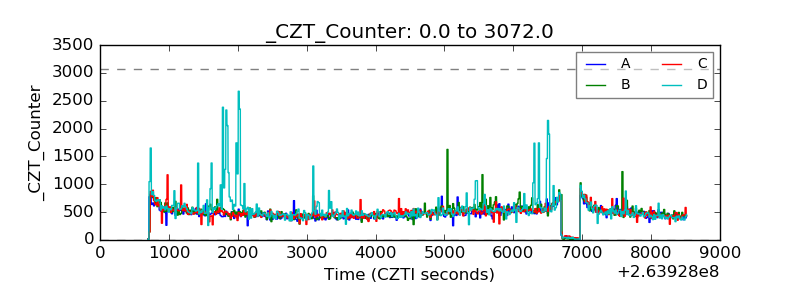 |
| +2.5 Volts monitor |  |
| +5 Volts monitor |  |
| _ROLL_ROT | 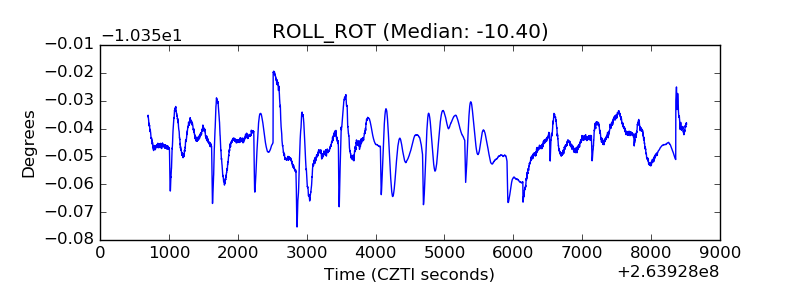 |
| _Roll_DEC | 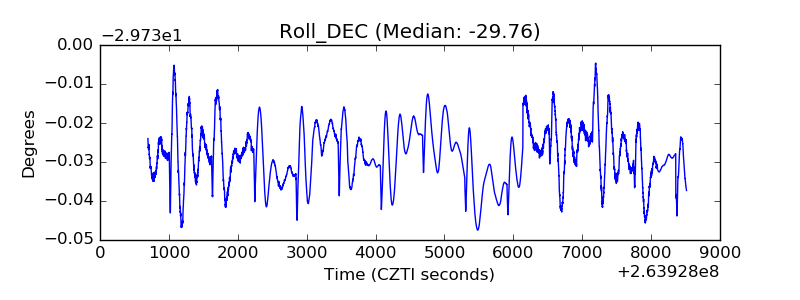 |
| _Roll_RA | 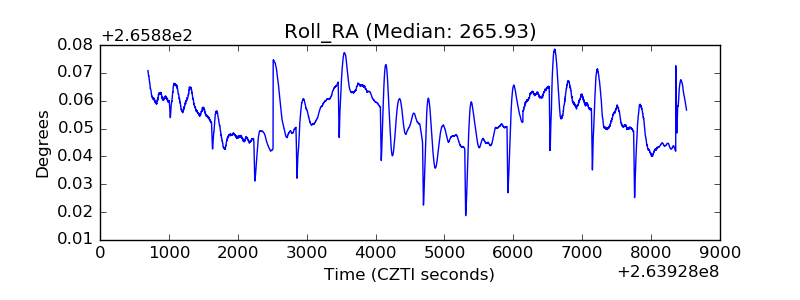 |
| Veto Counter | 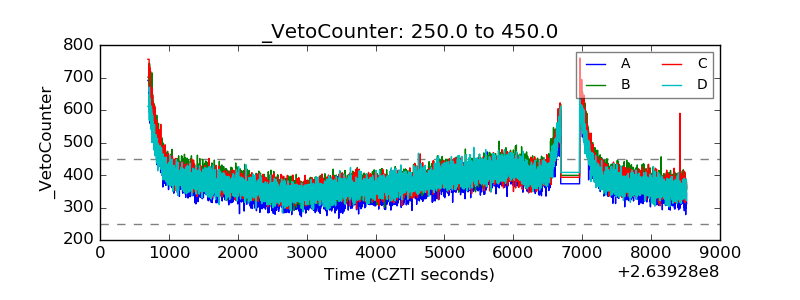 |